Trading Trend Continuation Patterns in Binary Options
Since binary options expiry lasts from as little as 1 minute, traders are able to profit from minor intraday momentum. Thus, the patterns for trading trend continuation sets are even more important, among them:
-
Breaking Triangles (Symmetrical, Ascending, Descending)
-
Breaking Support (Resistance)
-
Testing Support (Resistance)
-
Three Black Crows/Three White Soldiers
Trends form the essence of any market, and binary options are no different. A trend signifies the general direction in which the market is headed. Recognizing trends is pivotal for binary options traders as it aids in predicting potential future price movements. Trends can manifest as upward (bullish), downward (bearish), or sideways (neutral).
Reversal patterns, such as head and shoulders, double tops, and double bottoms, indicate a potential alteration in the ongoing trend. Identifying these patterns allows traders to foresee a shift in market direction, enabling strategic adjustments to trading positions. Trends serve as a foundation for making well-informed trading decisions. By understanding the prevailing direction, traders can anticipate and leverage future price movements.
-
What is the best trend indicator for binary options?
There's no definitive "best" trend indicator for binary options, as their effectiveness varies. Notable options include moving averages such as MACD or EMA, Bollinger Bands, and Relative Strength Index (RSI). To find what suits your trading style, it's advisable to experiment with different indicators and combine them with other technical analysis tools.
-
What are trend continuation patterns?
Trend continuation patterns are technical formations on charts signaling the likelihood of an ongoing trend persisting. Examples encompass triangles, breakouts of support/resistance levels, and candlestick formations like three black crows or three white soldiers. Recognizing these patterns aids traders in pinpointing potential entry points for trades aligned with existing market momentum.
-
Does anyone make money with binary options?
Some traders profit from binary options, but it's crucial to grasp the associated risks. Binary options represent a high-risk, high-reward market with the potential for substantial losses. Success hinges on meticulous risk management, continuous learning, and discipline. For further insights on the potential of profitability, explore this article: Is making money with binary options possible?
-
What is a trend-following strategy in binary options?
A trend-following strategy seeks to capitalize on existing market trends. It involves identifying trends using technical analysis tools and entering trades in the trend direction. Trend continuation patterns are integral to this strategy, providing potential entry points for trades that align with the prevailing market trend.
Why do the trends continue?
The continuous existence of trends can be attributed to two critical factors — the psychological aspects of market participants and the technical indicators they employ, coupled with the ongoing market dynamics.
-
Psychological Influences
Trends persist due to psychological factors like FOMO (Fear of Missing Out), greed, and anchoring. Swayed by emotions, traders often trail existing trends, contributing to their prolonged continuation.
-
Technical Elements
Technical components, particularly breakouts, reinforce the continuation of trends. Breakout points, where prices breach significant levels, attract traders and algorithms, intensifying momentum and extending the trend.
-
Market Dynamics
External factors, notably news and market dynamics, play a pivotal role. Positive or negative news can fuel or prolong trends, shaping investor sentiment and prompting market participants to align with the prevailing direction.
Before diving into trend continuation patterns, it's crucial to grasp the basics of binary options trading. Read this article on How to Start Binary Options Trading in 7 Simple Steps to build a solid foundation.
How to trade trend continuation patterns?
Success in binary options trading hinges on recognizing and capitalizing on these trends, and trend continuation patterns serve as your roadmap to navigating the wave of momentum.
-
Triangles (symmetrical, ascending, descending)
-
Breaking Support (Resistance)
-
Testing Support (Resistance)
Candlestick Patterns:
-
Breakout of inside candle
-
Three black crows/and three white soldiers
Triangles
In binary options trading, triangles are chart patterns formed by converging trendlines, creating a triangular shape. There are three main types:
-
Symmetrical Triangle: Both trendlines converge, indicating consolidation before a potential breakout.
-
Ascending Triangle: The upper trendline is flat, while the lower trendline slopes upward, suggesting bullish potential.
-
Descending Triangle: The lower trendline is flat, while the upper trendline slopes downward, indicating potential bearish movements.
How to trade:
-
Identify the Triangle: Recognize a symmetrical, ascending, or descending triangle on the chart.
-
Wait for Breakout: Monitor price movement within the triangle and await a breakout above or below the trendlines.
-
Confirm with Volume: Validate the breakout with increased trading volume, supporting the move's validity.
-
Execute the Trade: Enter a trade toward the confirmed breakout — up for bullish and down for bearish.
Example:
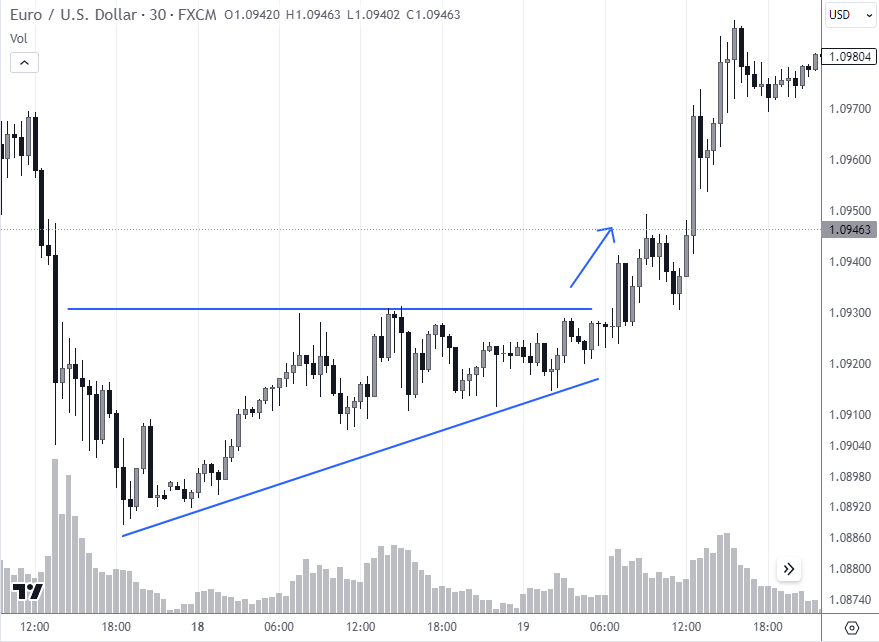
How to trade triangle breakouts
The chart shows the EUR/USD market. The rising lows indicate strengthening of demand forces during the Asian session. Therefore, a breakdown of the resistance line looks like a promising direction for trading during the European session. Binary options traders can buy call options during short-term pullbacks, increasing their chances of profiting from the upward momentum after a bullish breakout of the ascending triangle.
Breaking Support or Resistance
Breaking support or resistance refers to a critical price movement where an asset's value surpasses a significant level.
-
Breaking Support: Occurs when the price falls below a previously established support level, indicating potential bearish momentum.
-
Breaking Resistance: This happens when the price rises above a prior resistance level, suggesting potential bullish momentum.
How to trade:
-
Identify Key Levels: Recognize crucial support or resistance levels based on historical price movements.
-
Monitor Price Action: Watch for signs of the price approaching the identified level, anticipating a potential breakout.
-
Execute the Trade: Once confirmed, enter a trade aligned with the breakout direction—down for breaking support and up for breaking resistance.
Confirm Breakout: Confirm the breakout by observing sustained price movement beyond the support or resistance level.
Confirm Breakout: Confirm the breakout by observing sustained price movement beyond the support or resistance level.
Execute the Trade: Once confirmed, enter a trade aligned with the breakout direction—down for breaking support and up for breaking resistance.
Example:

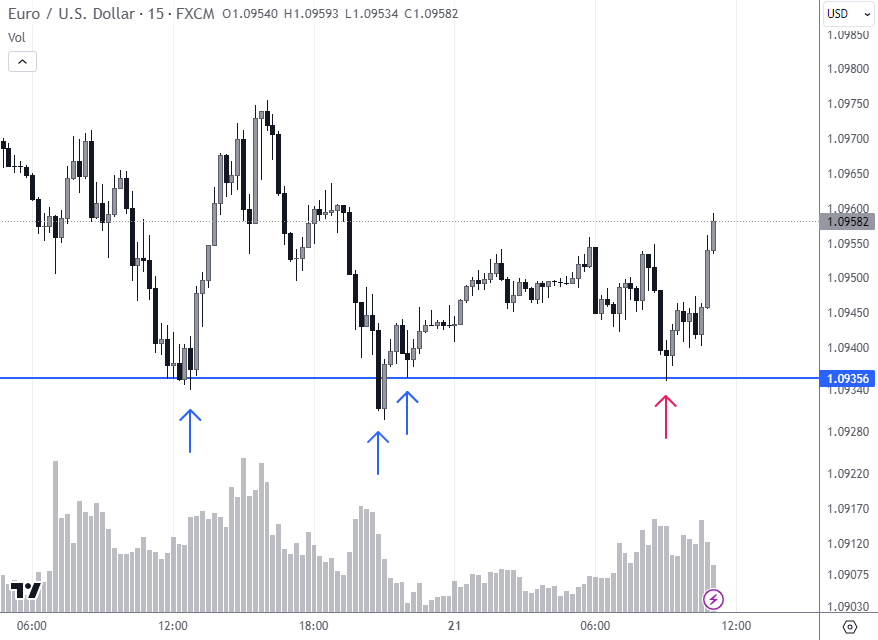
Example of a set-up for support level breakout
The blue arrows show the reference points by which the support level is determined. The support was formed during the European session. The red arrow indicates a bearish breakout of this level, which occurred at the beginning of the volatile American session. Binary options traders in such a situation should favor downside trading.
Testing Support or Resistance
Testing support or resistance involves the price approaching significantly without an immediate break. This pattern signifies a crucial evaluation point, determining whether the level will hold or lead to a breakout.
How to trade:
-
Identify Key Levels: Determine important support or resistance levels based on historical price interactions.
-
Monitor Price Testing: Watch as the price approaches the identified level without an immediate breakout.
-
Evaluate Price Behavior: Assess the price's behavior during testing — look for signs of hesitation or consolidation.
-
Wait for Confirmation: Wait for clear confirmation, such as a decisive break or bounce, before entering a trade.
-
Execute the Trade: Once confirmation occurs, enter a trade based on the anticipated direction — down for a break and up for a bounce.
Example:
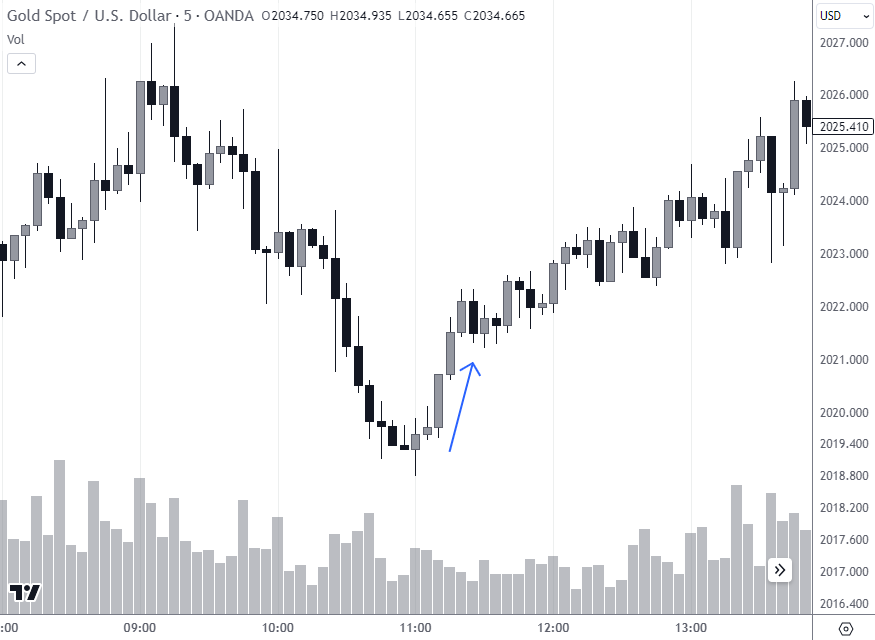
Example of a support level test pattern
The blue arrows show the pivotal reversal signals at which the support level is located. The red arrow indicates a test of this level, which traders can use to buy a call option, expecting an uptrend to form on the lower timeframes.
Get more valuable information from professional traders regarding finding important support and resistance levels in this article: How do you indicate support and resistance?
Breakout of Inside Candle
A breakout of an inside candle occurs when the price breaks out of the high or low range of the previous candlestick, often signaling potential shifts in market direction.
How to trade:
-
Identify Inside Candle: Recognize a candlestick with a high and low within the previous candle's range.
-
Wait for Breakout: Monitor the next candle for a breakout — either breaking above the high or below the low of the inside candle.
-
Confirm with Volume: Verify the breakout with an increase in trading volume, supporting the validity of the move.
-
Execute the Trade: Once confirmed, enter a trade toward the breakout—up for a bullish breakout and down for a bearish breakout.
Example:
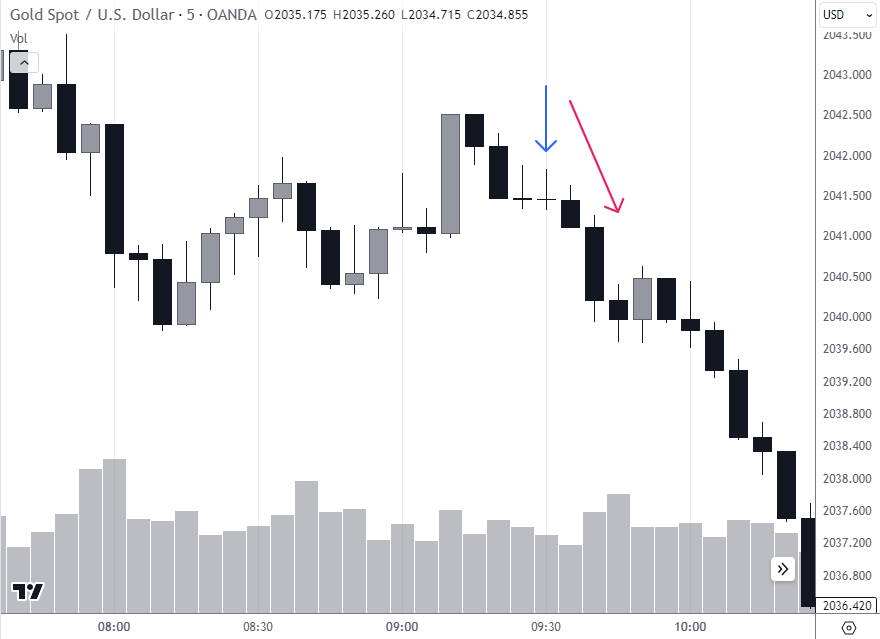
Example of inside candlestick trading
The blue arrow indicates a candle that is "inside" the previous candle. That is, the market is experiencing some balance or indecision.
A red arrow indicates that the market is heading down. This is evidenced by increased volume and closing on the lows.
Three black crows/Three white soldiers
The pattern of "Three Black Crows" and "Three White Soldiers" represents a series of three consecutive candlesticks signaling a potential reversal.
-
Three Black Crows: Three consecutive bearish candlesticks with lower lows and lower closes, suggesting a potential bearish reversal.
-
Three White Soldiers: Three consecutive bullish candlesticks with higher highs and higher closes, indicating a potential bullish reversal.
How to Trade:
-
Identify the Pattern: Spot the formation of three consecutive black crows or white soldiers on the chart.
-
Confirm the Reversal: Look for confirmation through additional technical indicators or patterns signaling a potential reversal.
-
Execute the Trade: Based on the identified pattern and confirmed reversal, consider entering a trade aligned with the anticipated market direction — down for bearish and up for bullish.
-
Trading based on Three Black Crows or Three White Soldiers involves recognizing these candlestick patterns and using them as indicators for potential market reversals, guiding traders in making informed decisions.
Example:
Three white soldiers
The blue arrow displays a bullish pattern, which should suggest to the binary options trader that the market sentiment has changed dramatically. Closings near the highs confirm that downside trading can increase risk after the pattern appears.
Flag Pattern
The flag pattern is a technical analysis formation resembling a pole flag. It is characterized by a strong price movement (flagpole) followed by a rectangular consolidation (flag) before continuing the previous trend.
-
Identify the Flagpole: Recognize a sharp and significant price movement, indicating the initial phase of the pattern.
-
Spot the Flag: Identify the rectangular-shaped consolidation that follows the flagpole.
-
Wait for Breakout: Monitor the price for a breakout from the flag, signaling the potential continuation of the previous trend.
-
Confirm with Volume: Verify the breakout with increased trading volume, confirming the pattern.
-
Execute the Trade: Once confirmed, consider entering a trade aligned with the anticipated direction — up for a bullish flag and down for a bearish flag.
Example
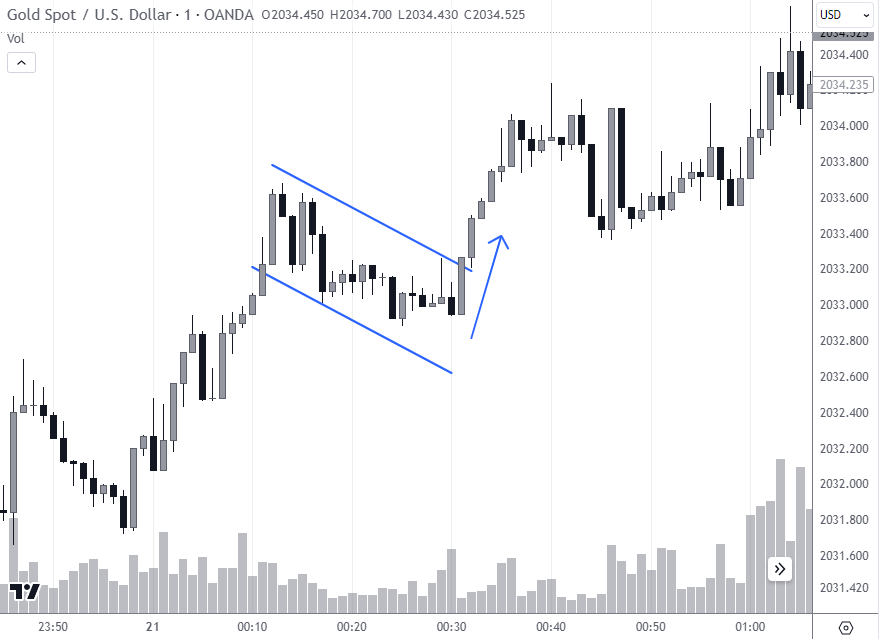
An example of a flag pattern.
The flag pattern in this case means the price correction within the prevailing uptrend. When the pattern is broken by the price, it may mean that the uptrend is ready to continue.
Best binary options brokers


Is trend continuation trading profitable?
Trading patterns can be profitable if you can be disciplined about capitalizing on their benefits and minimizing their risks.
👍 Pros
• Trend continuation trading maximizes profits by capturing established trends early in development
• Focusing on trend continuation refines entry and exit points, enhancing overall trading accuracy.
• Trend continuation strategies align seamlessly with technical analysis tools for informed decision-making.
👎 Cons
• Trend continuation trading carries the risk of unexpected reversals, potentially leading to losses.
• Successful trend continuation demands strict risk management practices to handle adverse market movements.
• The effectiveness of trend continuation relies on favorable market conditions, susceptible to disruptions from unforeseen events
Tips for trading trend continuation patterns
-
Use Multiple Indicators for Confirmation: Employ a combination of indicators to validate trend continuation patterns, enhancing the reliability of your trading signals. To know about various indicators, you can read this article on - Top 8 Best Trend Indicators You Should Know.
-
Back-Test Your Reversal Strategy: Evaluate the effectiveness of your reversal strategy by back-testing it using historical data and a demo account, ensuring its viability in varying market conditions.
-
Control Risks: Never Invest More Than You Can Afford to Lose. Prioritize risk management by setting clear investment limits ensuring potential losses are within acceptable boundaries.
Summary
Trend continuation patterns provide a valuable tool for binary options traders, yet they don't assure guaranteed success. Consider them as a puzzle piece, complementing other technical and fundamental analyses. Integrating sound risk management practices and maintaining a commitment to continuous learning enhances your ability to confidently navigate the market, increasing the potential to achieve your trading goals.
Glossary for novice traders
-
1
Bollinger Bands
Bollinger Bands (BBands) are a technical analysis tool that consists of three lines: a middle moving average and two outer bands that are typically set at a standard deviation away from the moving average. These bands help traders visualize potential price volatility and identify overbought or oversold conditions in the market.
-
2
Cryptocurrency
Cryptocurrency is a type of digital or virtual currency that relies on cryptography for security. Unlike traditional currencies issued by governments (fiat currencies), cryptocurrencies operate on decentralized networks, typically based on blockchain technology.
-
3
Fundamental Analysis
Fundamental analysis is a method or tool that investors use that seeks to determine the intrinsic value of a security by examining economic and financial factors. It considers macroeconomic factors such as the state of the economy and industry conditions.
-
4
Risk Management
Risk management is a risk management model that involves controlling potential losses while maximizing profits. The main risk management tools are stop loss, take profit, calculation of position volume taking into account leverage and pip value.
-
5
Investor
An investor is an individual, who invests money in an asset with the expectation that its value would appreciate in the future. The asset can be anything, including a bond, debenture, mutual fund, equity, gold, silver, exchange-traded funds (ETFs), and real-estate property.
Related Articles


Team that worked on the article

Upendra Goswami is a full-time digital content creator, marketer, and active investor. As a creator, he loves writing about online trading, blockchain, cryptocurrency, and stock trading.

Dr. BJ Johnson is a PhD in English Language and an editor with over 15 years of experience. He earned his degree in English Language in the U.S and the UK. In 2020, Dr. Johnson joined the Traders Union team. Since then, he has created over 100 exclusive articles and edited over 300 articles of other authors.

Tobi Opeyemi Amure is an editor and expert writer with over 7 years of experience. In 2023, Tobi joined the Traders Union team as an editor and fact checker, making sure to deliver trustworthy and reliable content. The topics he covers include trading signals, cryptocurrencies, Forex brokers, stock brokers, expert advisors, binary options.
Tobi Opeyemi Amure motto: The journey of a thousand miles begins with a single step.
