Trading Trend Reversal Patterns in Binary Options


Editorial Note: While we adhere to strict Editorial Integrity, this post may contain references to products from our partners. Here's an explanation for How We Make Money. None of the data and information on this webpage constitutes investment advice according to our Disclaimer.
Reversal patterns provide signals of a potential change in trend direction. These patterns observed on price charts offer traders valuable information about potential entry or exit points. Among the reversal patterns are differentiated:
Chart patterns: head and shoulders, double bottoms.
Indicator patterns: Divergences.
In binary options trading, where prices can change quickly and unpredictably, spotting potential turning points is essential for success. Here's where reversal patterns emerge as invaluable tools, aiding traders in anticipating and potentially profiting from market shifts.
These reversal patterns are crucial because they provide valuable insights and improve trading opportunities. They act as essential guides for binary options traders, helping them understand and navigate the unpredictable market, aiming for consistent success.
What are the reversal patterns for binary options?
In binary options trading, reversal patterns are crucial in identifying potential shifts in market trends. These patterns indicate a change in the prevailing direction of an asset's price movement, providing traders with valuable insights for making informed decisions.
Before getting into specific reversal patterns, it's crucial to understand the concept of a trend in binary options trading.
A trend signifies the market's general direction — upward (bullish) or downward (bearish).
Reversal patterns are specific formations on price charts that indicate a potential shift in the current trend. These patterns can be grouped into chart patterns and candlestick patterns.
Chart patterns
Head and Shoulders (SHS)
Double Top/Bottom and Triple Top/Bottom
Wedges
Candlestick patterns
Engulfing
Doji
Shooting star
Indicator patterns
Divergences
Head and Shoulders
This classic pattern depicts a head (highest peak) flanked by two lower peaks (shoulders) with a neckline connecting the troughs. A confirmed SHS suggests a potential downtrend reversal.
Example
Consider a chart showing a high, higher, and lower high — a classic head and shoulders pattern.
 Inverted head and shoulders – bullish
The chart above shows an inverted SHS – it helps to identify the end of a downtrend and the beginning of a period of rising prices.
How to trade
Traders often initiate a short position when the price breaks below the neckline, anticipating a downtrend.
Double Top/Bottom
Two consecutive peaks (tops) or troughs (bottoms) forming a distinct resistance or support zone, indicating a potential trend reversal. Double top signifies a trend reversal after an uptrend, while Double Bottom suggests a reversal after a downtrend.
Example
Observing a currency pair reaching a peak twice before a decline — a precise double-top scenario.
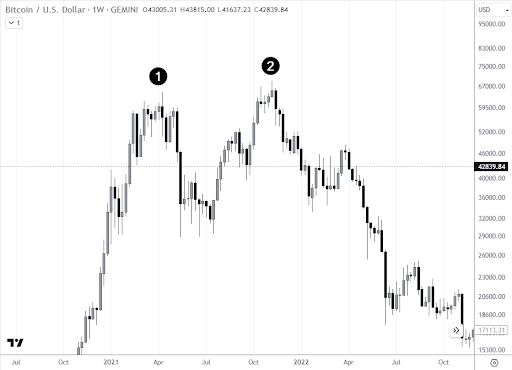 Double Top
The weekly chart above shows a double top in the bitcoin market (although the pattern can form even on minute charts). Moreover, the second top is above the first one, as if trapping buyers who think that the bullish trend will continue and the price will reach $100,000 per coin.
How to trade
Get confirmation (for example, by seeing expanding bearish candles and increasing volumes). Find an entry point for a short position on the lower timeframes - for example, when a support level is broken.
Similar to Double Top/Bottom, Triple Top/Bottom indicates trend reversal with three peaks or troughs. But with three peaks or troughs, this pattern offers a stronger confirmation of a potential trend reversal.
Rising/Falling Wedges
These formations are characterized by converging trendlines, narrowing down towards a point, suggesting a potential trend reversal upon breaking out of the wedge. Wedges signal a reversal, with Rising Wedges indicating a potential bearish reversal and Falling Wedges suggesting a bullish reversal.
Example
Spot security forming converging trendlines, indicating a potential trend reversal.
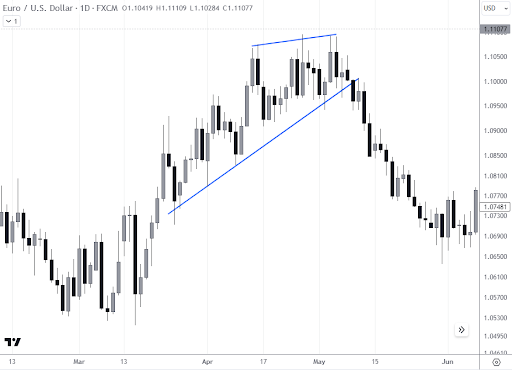 Rising Wedge
The chart above shows a wedge pattern in the EURUSD market. Even though the price consistently showed the formation of higher highs and lows (a sign of an uptrend), the situation quickly changed to bearish.
How to trade
Trade in the direction opposite to the wedge, anticipating a reversal. Look for confirmation (e.g. rising volumes and expanding bearish candles). Consider opening a short position - alternatively, on a breakdown of the pattern's lower boundary or other support levels. Opening a short position on short-term recoveries can also be justified and may suit more conservative traders.
Engulfing
A longer candle engulfs the previous candle's body, signifying a solid shift in momentum, potentially indicating a trend reversal. Engulfing patterns involve one candle fully covering the previous one.
Example
A bullish engulfing pattern occurs when an upward candle follows a downward one.
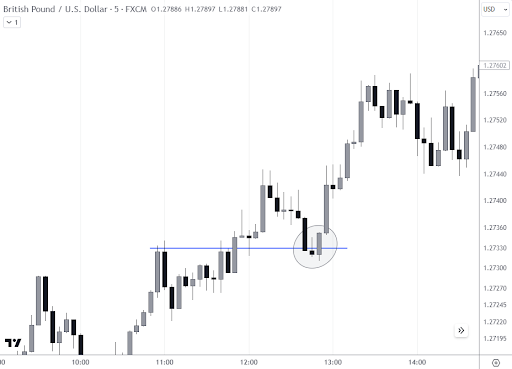 BullishEngulfing
Binary options traders should favour the bullish engulfment pattern if there is a prevailing uptrend in the background. The chart above shows how the breakout level test occurred. A bullish engulfment in this case means the end of the test and reversal of the short-term decline to the upside.
How to trade
Traders may enter a long position after identifying a bullish engulfing pattern.
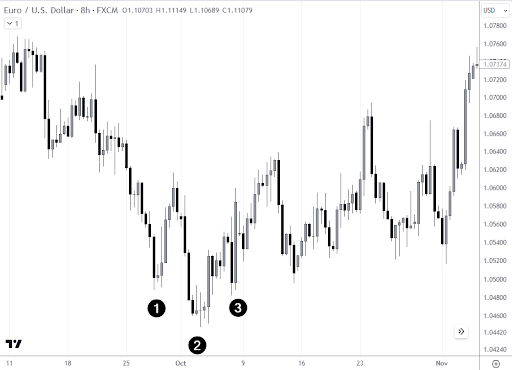
Doji & Shooting star
The chart below shows two candlestick patterns, a doji (1) and a shooting star (2):
A Doji is a candlestick with an open and close at the same or nearly the same price, suggesting indecision in the market. The Doji is often part of other candlestick reversal patterns consisting of 2-3 candles.
A Shooting Star is a single candlestick pattern with a small body and a long shadow, signaling a potential reversal.
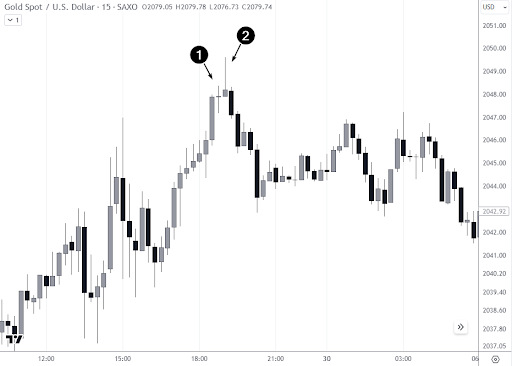 Doji & Shooting star
Although each of these 2 patterns can be considered separately, together they tell the story of how, after a period of indecision, the bulls tried to continue the uptrend but failed.
This should warn the binary options trader of a likely trend reversal in a downward direction.
Divergences
In binary options trading, divergence occurs when the price of an asset moves in the opposite direction of a technical indicator, such as an oscillator. This can signal a potential trend reversal or continuation.
Example
In the illustrated example of positive divergence, a noteworthy observation emerges. Despite the price continuing its descent and forming a lower low, the Relative Strength Index (RSI) demonstrates a contrasting behavior, showing higher lows. This divergence signifies a potential weakening of the downward trend in EUR/USD, as the price's negative momentum loses strength while the RSI suggests a positive divergence in market dynamics.
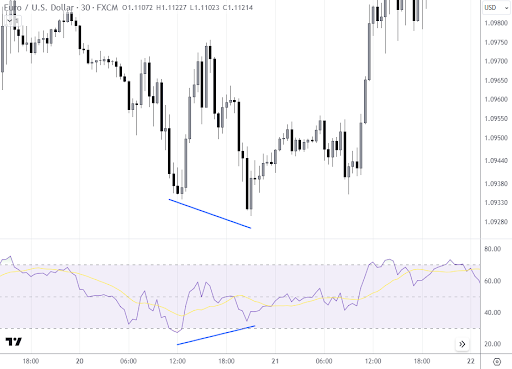 A bullish divergence
How to trade
When engaging in divergence trading, it's crucial not to depend solely on divergence signals for trading decisions. Look for additional confirmation signals, such as:
Candlestick Patterns: Watch for bullish Hammer or Engulfing patterns occurring after the identified divergence. These patterns can strengthen the case for a potential reversal.
Support/Resistance Levels: Check if the price aligns with known support or resistance levels at the time of the identified divergence. Confluence with these levels can enhance the likelihood of a market bounce.
Entry Point: Consider initiating a long position once the confirmation signals have manifested. Determine an appropriate expiry time based on your risk tolerance and the prevailing market volatility.
Stop-Loss: If the trend persists in the opposite direction, strategically place a stop-loss order below the recent swing low to mitigate potential losses. This risk management measure helps safeguard your capital during adverse market movements.
Choosing a broker for trading reversal patterns
In binary options trading, the effectiveness of reversal strategies depends not only on analysis but also on execution quality. Fast order processing, stable pricing, and clear contract conditions are essential when trading short-term setups such as reversals, where timing plays a critical role.
Below is a selection of brokers that provide suitable conditions for trading binary options.
| CloseOption | Capitalcore | Nadex | Pocket Option | QUOTEX | Deriv | |
|---|---|---|---|---|---|---|
|
Foundation year |
2013 | 2019 | 2009 | 2017 | 2019 | 1999 |
|
Min. deposit |
5 | 10 | 250 | 5 | 10 | 5 |
|
Min. trade size |
1 | 1 | 1 | 1 | 1 | 0.01 lots |
|
Min. Payout (%) |
17 | 60 | No | 50 | 20 | 70 |
|
Max. Payout (%) |
95 | 90 | 100 | 128 | 98 | 92 |
|
Bots or copy trading |
No | No | No | Yes | No | Yes |
|
Open an account |
Go to broker Your capital is at risk. |
Go to broker Your capital is at risk.
|
Study review | Go to broker Your capital is at risk. |
Go to broker Your capital is at risk. |
Go to broker Your capital is at risk. |
Is reversal trading profitable?
Whether reversal trading is profitable is a complex question with no simple answer. It depends on various factors like your trading skills, risk management, and the specific trading strategy you use.
The choice to trade breakouts or reversals also depends on personal preference. If by nature you are close to selling at the highs and buying at the lows, consider the pros and cons of trading reversals. This trading style may be more suitable for you.
- Pros
- Cons
- Capitalize on both upward and downward price movements.
- Identify support and resistance levels for better stop-loss placement.
- Effective risk management with clear reversal signals.
- Not all patterns are reliable, and some may lead to false signals.
- Binary options have limited expiry times, increasing pressure for accurate predictions.
- Facing losses and managing emotions during reversals can be challenging.
If you are wondering if you can benefit from trading reversal patterns, try doing it on a demo account first. More details for beginners - in the article: How to Start Binary Options Trading in 7 Simple Steps.
Tips for trading reversal patterns
Trading reversal patterns require a strategic approach to maximize potential returns while managing risks effectively. Here are essential tips to enhance your understanding and improve your success rate in identifying and trading these patterns:
Look for Patterns at Support or Resistance Levels
Understanding the context in which reversal patterns form is crucial. Focus on identifying patterns that occur at significant support or resistance levels. These levels provide additional confirmation and increase the probability of a successful reversal.Use Multiple Indicators to Confirm the Pattern
Enhance your analysis by incorporating multiple indicators that complement your identified reversal pattern. Combining technical indicators such as moving averages, RSI (Relative Strength Index), or MACD (Moving Average Convergence Divergence) can provide additional confirmation, strengthening your trading decision.Back-Test Your Reversal Strategy
Conduct thorough back-testing using historical data before implementing your reversal strategy in live markets. This process involves applying your strategy to past market conditions to assess its effectiveness. Back-testing helps identify strengths, weaknesses, and potential areas for improvement in your approach.Control Risks and Never Overcommit
Risk management is a cornerstone of successful trading. Set clear risk limits for each trade, and ensure you only invest what you can afford to lose. By defining and adhering to your risk tolerance, you protect your capital and maintain a disciplined approach to trading.
Reversal patterns work best with confirmation and discipline

I treat reversal patterns as early signals, not final trade triggers. In my experience, many losses come from entering too early, before the market confirms the shift. I always wait for additional signals such as volume changes, support or resistance reactions, or stronger candle structure before taking a position.
Another key point is timing. In binary options, expiry selection is just as important as entry. Even if the direction is correct, poor timing can turn a good setup into a losing trade. I usually align expiry with the timeframe of the pattern to avoid unnecessary pressure on the position.
Finally, I recommend focusing on consistency rather than frequency. Reversal setups do not appear constantly, but when they do, they tend to offer clearer structure. Being selective and disciplined often leads to more stable results than trying to trade every potential signal.
Conclusion
Mastering trend reversal patterns can be a game changer for binary options traders, offering the ability to anticipate market shifts and enhance the precision of trade entries and exits. Whether you rely on chart setups like Head and Shoulders or candlestick signals such as Engulfing and Doji, always seek confirmation from additional technical indicators before acting. As highlighted in the article, the most successful traders combine disciplined strategy, careful risk management, and timing that aligns with both the pattern and expiry. Ultimately, the key to profitability lies in consistency and patience—waiting for high-quality reversal setups rather than chasing every potential signal will set you apart in the fast-paced world of binary options.
FAQs
How do trend reversal patterns differ from continuation patterns in binary options trading?
What role does confirmation play when using trend reversal patterns in binary options?
Are certain timeframes more effective for identifying trend reversal patterns in binary options?
What common challenges do traders face when trading trend reversal patterns in binary options?
Editors' Top Picks and Insights

Bitcoin price prediction and Bollinger Bands: Can BTC recover after falling to $63,000?

FIFA World Cup on blockchain: Where football meets crypto

Aliens, Satoshi, and Bitcoin: How the extraterrestrial theory emerged

Blockchain nation in crisis: How a power struggle split Liberland

Shifting priorities: Governments back mining as businesses turn to AI

Intel's comeback: Apple, Trump and the AI bet
Related Articles
Team that worked on the article
Upendra Goswami is a full-time digital content creator, marketer, and active investor. As a creator, he loves writing about online trading, blockchain, cryptocurrency, and stock trading.
Dr. BJ Johnson is a PhD in English Language and an editor with over 15 years of experience. He earned his degree in English Language in the U.S and the UK.
Tobi Opeyemi Amure is an editor and expert writer with over 7 years of experience. In 2023, Tobi joined the Traders Union team as an editor and fact checker, making sure to deliver trustworthy and reliable content.
Risk management in Forex involves strategies and techniques used by traders to minimize potential losses while trading currencies, such as setting stop-loss orders and position sizing, to protect their capital from adverse market movements.
Options trading is a financial derivative strategy that involves the buying and selling of options contracts, which give traders the right (but not the obligation) to buy or sell an underlying asset at a specified price, known as the strike price, before or on a predetermined expiration date. There are two main types of options: call options, which allow the holder to buy the underlying asset, and put options, which allow the holder to sell the underlying asset.
Risk management is a risk management model that involves controlling potential losses while maximizing profits. The main risk management tools are stop loss, take profit, calculation of position volume taking into account leverage and pip value.
Forex trading, short for foreign exchange trading, is the practice of buying and selling currencies in the global foreign exchange market with the aim of profiting from fluctuations in exchange rates. Traders speculate on whether one currency will rise or fall in value relative to another currency and make trading decisions accordingly. However, beware that trading carries risks, and you can lose your whole capital.
CFD is a contract between an investor/trader and seller that demonstrates that the trader will need to pay the price difference between the current value of the asset and its value at the time of contract to the seller.

-
 Afghanistan
-
 Albania
-
 Algeria
-
 Angola
-
 Argentina
-
 Armenia
-
 Australia
-
 Austria
-
 Azerbaijan
-
 Bahamas
-
 Bahrain
-
 Bangladesh
-
 Belarus
-
 Belgium
-
 Bolivia
-
 Botswana
-
 Brazil
-
 Brunei
-
 Bulgaria
-
 Cambodia
-
 Cameroon
-
 Canada
-
 Chile
Chile
-
 China
China
-
 Colombia
-
 Congo
Congo
-
 Costa Rica
-
 Cote d'Ivoire
-
 Croatia
-
 Cuba
Cuba
-
 Cyprus
-
 Czechia
-
 DR Congo
-
 Denmark
-
 Dominican Republic
-
 Ecuador
-
 Egypt
Egypt
-
 El Salvador
-
 Estonia
-
 Eswatini
-
 Ethiopia
-
 Finland
-
 France
-
 Georgia
-
 Germany
-
 Ghana
Ghana
-
 Greece
-
 Haiti
Haiti
-
 Hong Kong
-
 Hungary
-
 India
India
-
 Indonesia
-
 Iran, Islamic republic
-
 Iraq
Iraq
-
 Ireland
-
 Israel
-
 Italy
Italy
-
 Jamaica
-
 Japan
Japan
-
 Jordan
-
 Kazakhstan
-
 Kenya
Kenya
-
 Korea
Korea
-
 Kuwait
-
 Kyrgyzstan
-
 Laos
Laos
-
 Latvia
-
 Lebanon
-
 Lesotho
-
 Libya
Libya
-
 Lithuania
-
 Luxembourg
-
 Madagascar
-
 Malaysia
-
 Malta
Malta
-
 Mauritius
-
 Mexico
-
 Moldova
-
 Mongolia
-
 Montenegro
-
 Morocco
-
 Mozambique
-
 Myanmar
-
 Namibia
-
 Nepal
Nepal
-
 Netherlands
-
 New Zealand
-
 Nigeria
-
 North Macedonia
-
 Norway
-
 Oman
Oman
-
 Pakistan
-
 Palestine
-
 Panama
-
 Papua New Guinea
-
 Paraguay
-
 Peru
Peru
-
 Philippines
-
 Poland
-
 Portugal
-
 Puerto Rico
-
 Qatar
Qatar
-
 Reunion
-
 Romania
-
 Rwanda
-
 Saudi Arabia
-
 Serbia
-
 Singapore
-
 Slovakia
-
 Slovenia
-
 Somalia
-
 South Africa
-
 Spain
Spain
-
 Sri Lanka
-
 Sweden
-
 Switzerland
-
 Syria
Syria
-
 Taiwan
-
 Tajikistan
-
 Tanzania
-
 Thailand
-
 Trinidad and Tobago
-
 Tunisia
-
 Turkey
-
 UAE
UAE
-
 Uganda
-
 Ukraine
-
 United Kingdom
-
United States
-
 Uruguay
-
 Uzbekistan
-
 Venezuela
-
 Vietnam
-
 Yemen
Yemen
-
 Zambia
-
 Zimbabwe
- Forex
- Crypto
