Key technical indicators for trading binary options


Editorial Note: While we adhere to strict Editorial Integrity, this post may contain references to products from our partners. Here's an explanation for How We Make Money. None of the data and information on this webpage constitutes investment advice according to our Disclaimer.
The application of technical analysis in binary options trading is generally done by the use of the following indicators
Binary options trading is a popular form of financial trading that involves predicting whether the price of an asset will rise or fall within a specific time frame. Technical analysis is an important tool for binary options traders, as it helps evaluate historical price movements and anticipate future trends. This article explores the concept of technical analysis, its role in binary options trading, and the key benefits of applying it in practice.
Introduction
Technical analysis is the go-to analytical approach for binary options trading, and the reason behind the same can easily be understood through the meaning, significance, and benefits of technical analysis for binary trading.
Technical analysis and its significance in binary options trading
At its core, technical analysis uncovers an asset's historical price movements, employing tools like price charts and indicators to uncover patterns and trends. For binary options traders, it enables the assessment of underlying asset values and the prediction of their future price dynamics.
If you are interested in learning about Trend Reversal Patterns In Binary Options, read the Traders Union article.
Benefits of using technical analysis for binary options trading
The advantages of integrating technical analysis into binary options trading are manifold. Firstly, it excels in predicting short-term price movements, offering insights for traders navigating the rapid twists and turns of the market. Additionally, it helps traders to identify trends and patterns, providing valuable cues for strategic decision-making. Lastly, it assists in pinpointing optimal entry and exit points, a critical aspect of maximizing profits and minimizing losses in the binary options arena.
Understanding technical indicators
Technical indicators can broadly be classified into the following categories
Trend indicators
At the core of technical analysis are trend indicators, crucial for assessing the direction and strength of a trend. Moving averages, a stalwart in this category, provide a smoothed average of past prices. Parabolic SAR and Moving Average Convergence Divergence (MACD) further complement the toolkit, offering insights into trend dynamics. For instance, when MACD lines converge, signaling a potential new trend, traders are alerted to shifts in market sentiment.
Momentum indicators
Momentum indicators play a pivotal role in identifying the rate of change in an asset's price, aiding traders in recognizing overbought or oversold conditions. The Relative Strength Index (RSI), stochastic oscillator, and the Rate of Change (ROC) are key players in this type. RSI, for instance, acts as a signal for potential reversals, helping traders determine optimal entry or exit points.
Volatility indicators
Volatility indicators, such as Bollinger Bands and Average True Range (ATR), offer insight into the magnitude and rate of price movements. Bollinger Bands dynamically generate upper and lower levels based on recent price moves, allowing traders to gauge potential reversals. Meanwhile, ATR serves as a reliable indicator of volatility, crucial for risk management in binary options trading.
Volume indicators
Understanding market interest and trend strength is facilitated by volume indicators like On-Balance Volume (OBV) and Volume Rate of Change. These indicators provide an insight into the trading activity surrounding an asset, generating hints of the prevailing sentiment.
Best technical analysis indicators for binary trading
Moving averages
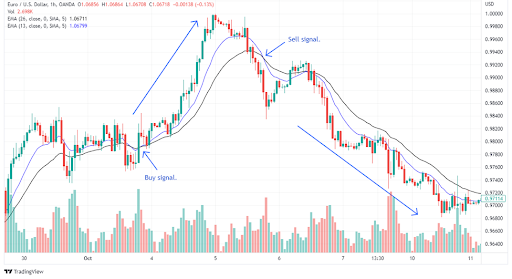 Moving averages
Moving averages, whether simple (SMA) or exponential (EMA), validate trends by presenting averages of past prices. While SMAs offer a straightforward mean average, EMAs lend more weight to recent values, catering to traders keen on short-term contracts. These indicators, often used in conjunction with others, contribute to a holistic market analysis.
Average True Range (ATR)
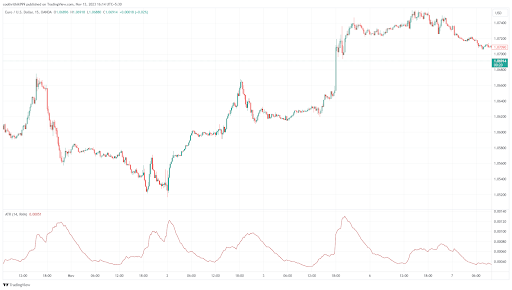 Average True Range (ATR)
Calculated by analyzing the price range over a set period, ATR reflects the potential market movement. Higher ATR values indicate increased volatility, guiding traders in navigating the binary options landscape with a keen awareness of potential market shifts.
Moving Average Convergence/Divergence (MACD)
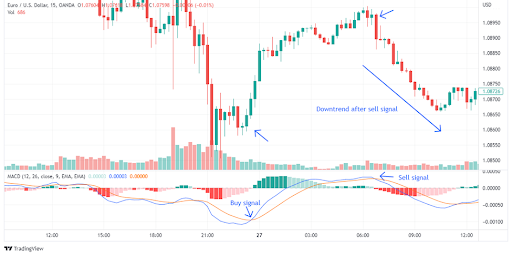 Moving Average Convergence/Divergence (MACD)
MACD, with its fast and slow lines, signifies the relationship between two moving averages. Convergence heralds the potential onset of a new trend, while divergence indicates a reversal. This nuanced insight empowers traders to anticipate market movements and make informed decisions in the binary options arena.
Relative Strength Index (RSI)
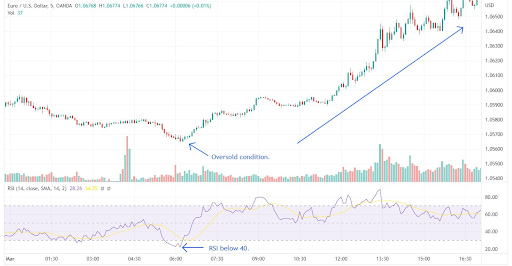 Relative Strength Index (RSI)
RSI serves as a valuable momentum indicator, signaling whether a market is overbought or oversold. This critical information aids traders in deciding when to buy or sell, aligning their actions with potential trend reversals. In the context of binary options contracts, RSI guides traders in selecting optimal expiry times.
Stochastic Oscillator
 Stochastic Oscillator
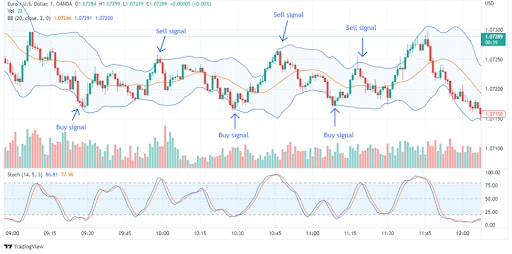
Functioning in a manner akin to RSI, the stochastic oscillator offers a unique perspective on market conditions. With two lines delineating trends, stochastics indicate potential reversals when exceeding 80 (overbought) or falling below 20 (oversold).
Bollinger Bands
 Bollinger Bands
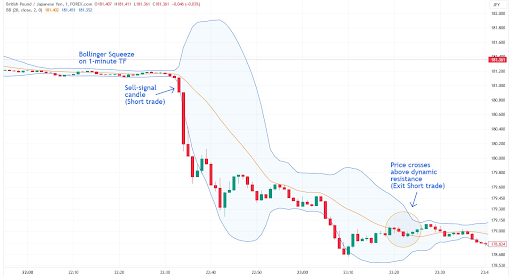
A distinctive feature of volatility analysis, Bollinger Bands dynamically set upper and lower levels based on recent price moves. Contraction and expansion of these bands offer vital reversal signals, aiding traders in positioning themselves strategically within the binary options market.
Commodity Channel Index (CCI)
 Commodity Channel Index (CCI)
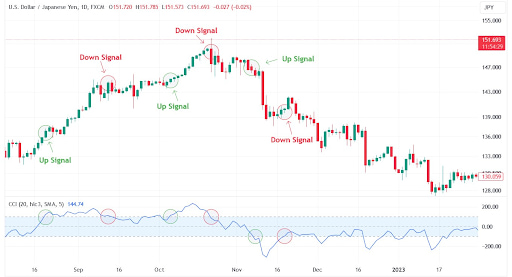
Calibrating the current price level relative to the average price, CCI is a versatile tool for identifying trends and extreme market conditions. With values above +100 indicating a robust uptrend and below -100 signaling a potent downtrend, CCI enables traders to take trading calls for short-term binary options trading.
Applying technical analysis to binary options trading
In this section, experts have broken down the entire technical analysis process for aspiring binary options traders. The core building blocks for same are as follows
Identifying potential trading opportunities using technical indicators
To uncover potential trading opportunities, traders delve into past market data, understanding price and volume to spot patterns and trends. If the analogy of decoding a map were to be taken – technical indicators would act as guides, revealing potential paths. For instance, let’s say that you identify an upward trend through technical analysis; this could prompt you to opt for a call option, anticipating the upward trend to persist.
Strategies for using technical indicators to make informed trading decisions
Analyzing price charts and technical indicators reveals patterns and trends that can form base for most trading decisions. For instance, the use of moving averages unveils trends, while support and resistance levels guide entry and exit points. Bollinger Bands, ADX, and RSI are popular indicators for identifying trends, volatility, and pivot points in advanced binary options strategies. Combining these varied pieces of information with conviction can result in a high-performing trading set-up.
Using charts to analyze price movements
Charts are like visual storytellers in technical analysis. Whether it's a line chart, bar chart, or candlestick chart, these tools show trends and patterns clearly. For example, candlestick charts comprehensively display how prices change over time with their open, close, high, and lows, giving a snapshot of market dynamics.
Identifying support and resistance levels
In technical analysis, finding support and resistance levels is like figuring out a market's strengths and weaknesses. Imagine support as a historical barrier stopping prices from dropping further, and resistance as a limit to upward movement. Traders strategically position themselves, expecting price changes at these crucial levels.
Using indicators to identify trends and patterns
Apart from charts, technical analysts use indicators as mathematical helpers. Whether it's moving averages, Bollinger Bands, or the Relative Strength Index (RSI), these indicators provide different perspectives on market movements. Like skilled musicians blending different notes, traders combine indicators to spot potential trades.
Managing risk
Providing for the risks of binary options trading is non-negotiable. Risk management strategies, like diversification and setting stop-loss orders, act as a shield against potential losses. Using stop-loss orders is like having an emergency exit plan, automatically triggered to protect against unexpected market turns. Experts lay special focus on the advice that traders should only invest what they are comfortable losing, ensuring that the excitement of trading remains enjoyable rather than stressful. If you want to learn about the best chart patterns for binary trading, read the Traders Union article.
Advanced technical analysis techniques
How can advanced technical analysis techniques enhance trading performance?
Advanced technical analysis techniques serve as enhanced tools for traders aiming to elevate their performance. These techniques go beyond conventional tools, offering deeper insights into market dynamics and aiding in making well-informed trading decisions. By using these advanced methods, traders are likely to unlock a new level of precision in identifying entry and exit points.
Fibonacci Retracements: How do they identify support and resistance levels?
Fibonacci retracements, rooted in the mathematical elegance of the Fibonacci sequence, emerge as a widely used tool for pinpointing potential support and resistance levels in an asset's price movement. Picture this as a financial compass – traders leverage Fibonacci retracements to navigate the market terrain, strategically identifying optimal moments to enter or exit trades. For example, if a trader spots a retracement level aligning with historical price patterns, it could signify a compelling entry point.
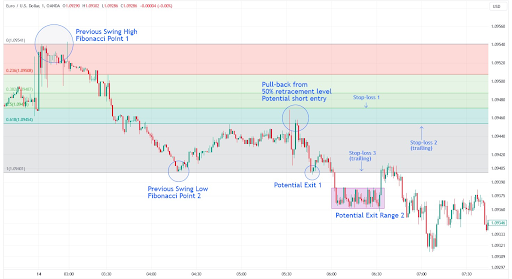
Suppose a trader observes a downtrend in an asset's price chart and anticipates a potential retracement. Applying Fibonacci retracements, the trader identifies key levels – 50% and 61.8% – as potential resistance zones. If the retracement aligns with historical patterns, the trader might consider this an entry signal for a put option, anticipating a pull-back.
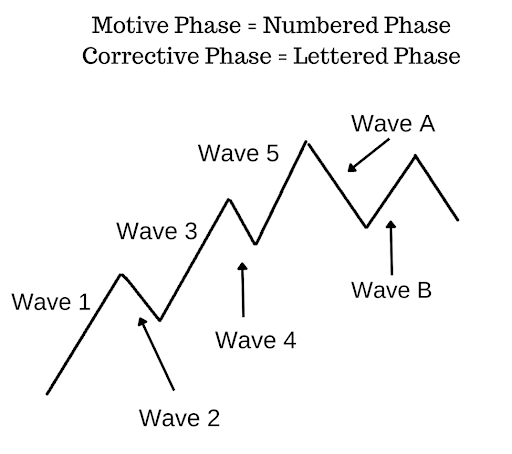
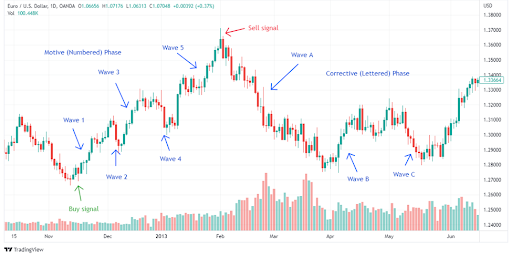
Elliott Wave Theory: How does it forecast price movements?
 Elliott Wave Theory
Elliott Wave Theory, based on the idea of trading the rhythmic patterns of market trends, offers a sophisticated lens for predicting price movements. Based on the notion that market trends unfold in a series of waves, each comprising smaller waves, this theory becomes a roadmap for traders. Visualize this as a musical score – traders employing Elliott Wave Theory judge the rhythm of market trends, trying to find well-timed entries and exits. Suppose a trader identifies a corrective wave about to conclude; this could signal an opportune moment to enter a trade.
 Elliott Wave Theory
Imagine a trader scrutinizing an asset's price movements and recognizing the completion of a motive wave, poised for a corrective wave. Leveraging Elliott Wave Theory, the trader gauges the rhythm of the potential downward movement. With this insight, the trader strategically enters a put option, aligning with the projected bearish wave.
Fractal Analysis: How does it uncover patterns in price charts?
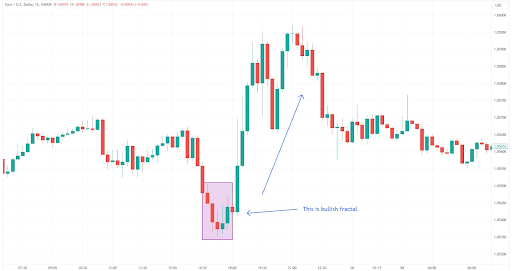
Fractal analysis is based on the assumption that market trends unfold like patterns in a constantly repeating kaleidoscope. This analytical tool operates on the idea that market trends show fractal characteristics, repeating patterns on different scales. It's similar to identifying recurring themes in a masterpiece. Traders who use fractal analysis aim to recognize these patterns, gaining insights into when to enter or exit the market. For example, if a trader spots a fractal pattern similar to a historical upward movement, it might prompt them to enter a long-side trade.
 Fractal Analysis
Imagine a trader using fractal analysis who identifies a repeating pattern resembling a historical market surge. Understanding the fractal nature of this pattern, the trader would interpret it as a signal to enter a call option, anticipating a repeat of the previous positive trend. Discover advanced fractal binary options strategies with detailed guidance on reading market structure, combining fractals with momentum filters and managing risk.
Combining technical analysis with other forms of analysis
For any trader, a holistic approach that integrates various forms of analysis is often the key to informed decision-making. By combining technical analysis with fundamental analysis and market sentiment analysis, traders can gain a more comprehensive understanding of market movements, mitigating risks and enhancing the precision of their trades.
Importance of combining technical analysis
While technical analysis excels in decoding price charts and identifying patterns, its power amplifies when complemented by other analytical dimensions. Fundamental analysis, focused on the intrinsic value of assets, and market sentiment analysis, which incorporates the prevailing mood of traders, offer crucial layers of insight.
Insights from fundamental analysis
Fundamental analysis focuses on the core factors influencing an asset's value. Economic indicators, company financials, and global events are the key branches of this study. For instance, if a binary options trader is assessing a tech company's stock, fundamental analysis might involve studying its earnings reports. If the company reports robust earnings, this positive fundamental indicator could align with a bullish technical trend, reinforcing the decision to enter a call option.
Deciphering market sentiment
Market sentiment analysis taps into the collective psychology of traders. It gauges whether the prevailing mood is bullish, bearish, or neutral. Suppose technical analysis reveals an asset approaching a key resistance level. Concurrently, market sentiment analysis indicates a widespread bullish sentiment. In such a scenario, a binary options trader might interpret this convergence as a potent signal to enter a call option, anticipating a potential breakout.
Summing it all up
Consider a hypothetical scenario involving a binary options trader eyeing a currency pair. Technical analysis unveils a clear uptrend, supported by the emergence of a bullish chart pattern. However, before finalizing the trade, the trader turns to fundamental analysis. Economic indicators suggest a potential interest rate hike in the currency's home country. This fundamental insight aligns with the upward technical trend, increasing the trader's confidence in entering a call option. However, the prevailing market sentiment is bearish given the geopolitical scenario, especially for the two currencies involved. In that case, the trader is less likely to execute the trade and more likely to look for other opportunities.
Top 3 binary options brokers


Conclusion
Mastering technical indicators is essential for binary options traders looking to achieve consistency and precision in a fast-moving market. By leveraging tools such as moving averages, MACD, and RSI, traders can decode price action, anticipate reversals, and strategically time their trades for maximum profitability. For instance, combining support-resistance analysis with momentum indicators can yield strong entry signals, while advanced methods like Fibonacci retracements fine-tune decision-making. Ultimately, success in binary options comes from blending technical expertise with sound risk management and awareness of broader market forces, ensuring every trade is backed by insight rather than impulse.
FAQs
What is the difference between trend, momentum, volatility, and volume indicators in technical analysis for binary trading?
How do traders use support and resistance levels to improve accuracy in binary options trading?
What are some common risk management strategies applied in technical analysis for binary options?
Can combining technical analysis with fundamental and sentiment analysis enhance binary trading outcomes?
Editors' Top Picks and Insights

Do politicians make the best stock traders?

Crypto test drive: How automakers are exploring digital assets

Lindsey Graham death: U.S. senator’s crypto legacy

Tether under pressure: USDT in Europe, audit questions, and the fight for trust

Lean Ethereum: Why Buterin wants to rebuild the network

SK Hynix debuts on Nasdaq: Largest U.S. offering by foreign company
Related Articles
Team that worked on the article
Chinmay Soni is a financial analyst with more than 5 years of experience in working with stocks, Forex, derivatives, and other assets. As a founder of a boutique research firm and an active researcher, he covers various industries and fields, providing insights backed by statistical data.
Dr. BJ Johnson is a PhD in English Language and an editor with over 15 years of experience. He earned his degree in English Language in the U.S and the UK.
Mirjan Hipolito is a journalist and news editor at Traders Union. She is an expert crypto writer with five years of experience in the financial markets.
CFD is a contract between an investor/trader and seller that demonstrates that the trader will need to pay the price difference between the current value of the asset and its value at the time of contract to the seller.
Forex trading, short for foreign exchange trading, is the practice of buying and selling currencies in the global foreign exchange market with the aim of profiting from fluctuations in exchange rates. Traders speculate on whether one currency will rise or fall in value relative to another currency and make trading decisions accordingly. However, beware that trading carries risks, and you can lose your whole capital.
Cryptocurrency is a type of digital or virtual currency that relies on cryptography for security. Unlike traditional currencies issued by governments (fiat currencies), cryptocurrencies operate on decentralized networks, typically based on blockchain technology.
Risk management in Forex involves strategies and techniques used by traders to minimize potential losses while trading currencies, such as setting stop-loss orders and position sizing, to protect their capital from adverse market movements.
The Stochastic Oscillator is a technical indicator used in financial analysis to gauge the momentum of a security's price and identify overbought or oversold conditions by comparing the closing price to a specified price range over a defined period.

-
 Afghanistan
-
 Albania
-
 Algeria
-
 Angola
-
 Argentina
-
 Armenia
-
 Australia
-
 Austria
-
 Azerbaijan
-
 Bahamas
-
 Bahrain
-
 Bangladesh
-
 Belarus
-
 Belgium
-
 Bolivia
-
 Botswana
-
 Brazil
-
 Brunei
-
 Bulgaria
-
 Cambodia
-
 Cameroon
-
 Canada
-
 Chile
Chile
-
 China
China
-
 Colombia
-
 Congo
Congo
-
 Costa Rica
-
 Cote d'Ivoire
-
 Croatia
-
 Cuba
Cuba
-
 Cyprus
-
 Czechia
-
 DR Congo
-
 Denmark
-
 Dominican Republic
-
 Ecuador
-
 Egypt
Egypt
-
 El Salvador
-
 Estonia
-
 Eswatini
-
 Ethiopia
-
 Finland
-
 France
-
 Georgia
-
 Germany
-
 Ghana
Ghana
-
 Greece
-
 Haiti
Haiti
-
 Hong Kong
-
 Hungary
-
 India
India
-
 Indonesia
-
 Iran, Islamic republic
-
 Iraq
Iraq
-
 Ireland
-
 Israel
-
 Italy
Italy
-
 Jamaica
-
 Japan
Japan
-
 Jordan
-
 Kazakhstan
-
 Kenya
Kenya
-
 Korea
Korea
-
 Kuwait
-
 Kyrgyzstan
-
 Laos
Laos
-
 Latvia
-
 Lebanon
-
 Lesotho
-
 Libya
Libya
-
 Lithuania
-
 Luxembourg
-
 Madagascar
-
 Malaysia
-
 Malta
Malta
-
 Mauritius
-
 Mexico
-
 Moldova
-
 Mongolia
-
 Montenegro
-
 Morocco
-
 Mozambique
-
 Myanmar
-
 Namibia
-
 Nepal
Nepal
-
 Netherlands
-
 New Zealand
-
 Nigeria
-
 North Macedonia
-
 Norway
-
 Oman
Oman
-
 Pakistan
-
 Palestine
-
 Panama
-
 Papua New Guinea
-
 Paraguay
-
 Peru
Peru
-
 Philippines
-
 Poland
-
 Portugal
-
 Puerto Rico
-
 Qatar
Qatar
-
 Reunion
-
 Romania
-
 Rwanda
-
 Saudi Arabia
-
 Serbia
-
 Singapore
-
 Slovakia
-
 Slovenia
-
 Somalia
-
 South Africa
-
 Spain
Spain
-
 Sri Lanka
-
 Sweden
-
 Switzerland
-
 Syria
Syria
-
 Taiwan
-
 Tajikistan
-
 Tanzania
-
 Thailand
-
 Trinidad and Tobago
-
 Tunisia
-
 Turkey
-
 UAE
UAE
-
 Uganda
-
 Ukraine
-
 United Kingdom
-
United States
-
 Uruguay
-
 Uzbekistan
-
 Venezuela
-
 Vietnam
-
 Yemen
Yemen
-
 Zambia
-
 Zimbabwe
- Forex
- Crypto
