Overbought And Oversold Conditions In Binary Options


Editorial Note: While we adhere to strict Editorial Integrity, this post may contain references to products from our partners. Here's an explanation for How We Make Money. None of the data and information on this webpage constitutes investment advice according to our Disclaimer.
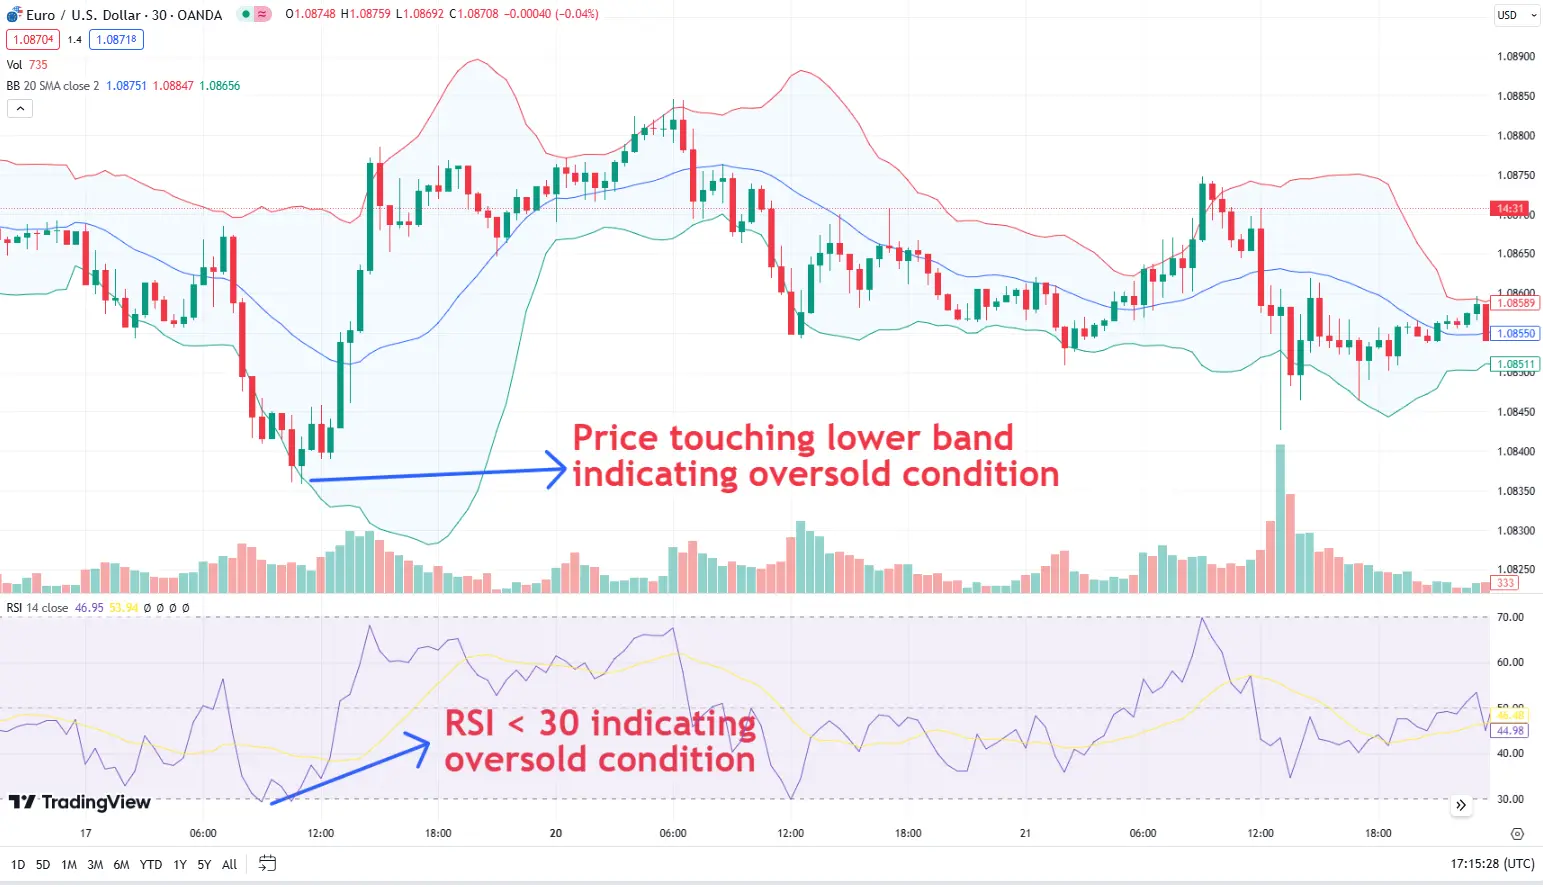
Asset can be considered overbought when the price touches or closes above the upper BB, and oversold, respectively, when the lower BB is broken. However, the signal of a trend indicator is not enough for a confident diagnosis of overbought/oversold zones. Before placing a position on a binary option, you should be sure to confirm this signal with an oscillator.rsely, the asset might be oversold when the price touches or closes below the lower BB.
Binary options trading offers a straightforward way for traders to speculate on the price movement of various assets. However, the key to success lies in understanding market conditions and using technical indicators effectively. One crucial concept in technical analysis is identifying overbought and oversold conditions. In this article we will discover the significance of recognizing overbought and oversold conditions in binary options trading. Learn how to leverage technical indicators to enhance trading strategies and optimize entry and exit points. Gain insights into risk management techniques and common pitfalls to avoid for long-term success.
Overbought and oversold conditions
Overbought and oversold conditions refer to market scenarios where an asset's price is considered either too high or too low, respectively, based on historical data and technical analysis. These conditions often indicate potential price reversals, providing trading opportunities for binary options traders.
Overbought conditions: An asset is considered overbought when its price has risen significantly and is expected to decline. You can usually spot this when the RSI, a popular technical indicator, shows a reading above 70 .
Oversold conditions: Conversely, an asset is oversold when its price has dropped substantially and is expected to rise. An RSI reading below 30 usually indicates an oversold condition.
Market context and its impact
Market conditions significantly affect the reliability of overbought and oversold signals. Understanding the broader market context helps in making better trading decisions.
Volatile markets: In volatile markets, overbought and oversold signals can be more frequent but less reliable due to rapid price fluctuations. For instance, let's say there's a sudden craze for a certain cryptocurrency. Prices shoot up, triggering overbought signals everywhere. But just as fast as it went up, the market mood changes, and prices crash. Traders who relied only on overbought signals could end up losing a lot.
Stable markets: These conditions tend to produce more reliable signals, making it easier to predict potential reversals. For example, consider a stable stock market where economic indicators are positive, and investor sentiment is optimistic. Here, overbought signals may indicate that a company's stock price has climbed too high due to excessive buying. Traders can trust these signals more because the stable market environment supports them, making it easier to anticipate potential price reversals.
| Market Condition | Characteristics | Impact on Signals | Trading Strategy |
|---|---|---|---|
Volatile Markets | Rapid price fluctuations | Signals are more frequent, yet less reliable | Adaptability is key; use shorter timeframes for entries and exits to mitigate risk. |
Higher market uncertainty | Increased likelihood of false signals | Implement stricter risk management; wait for confirmation from multiple indicators. | |
Larger price movements | Harder to predict accurate reversals | Consider using trailing stops or scaling out of positions to capture profits amidst volatility. | |
Stable Markets | Gradual price changes | Signals are less frequent, but more reliable | Utilize longer timeframes for entries and exits, focusing on trend continuation rather than quick reversals. |
Lower market uncertainty | Higher accuracy in predicting potential reversals | Take advantage of clearer signals to increase position size and hold trades for longer-term gains. | |
Smaller price movements | Easier to make well-informed trading decisions | Implement a patient approach, allowing trades to develop fully before taking action. |
Benefits of trading based on overbought and oversold conditions
Trading based on overbought and oversold conditions offers several benefits:
Higher profit potential: Identifying these conditions can help traders enter and exit trades at optimal points, maximizing profits.It's like knowing precisely when to seize the opportunity to buy low and sell high, ensuring traders capitalize on price movements for maximum gains.
Improved decision-making: Using technical indicators to identify overbought and oversold conditions can lead to more informed and strategic trading decisions. For example, when a trader sees an asset becoming overbought following a long uptrend, they might decide to reduce their position or exit entirely to protect profits and avoid losses during an expected price correction.
Mitigating Risk: Identifying overbought and oversold conditions helps traders mitigate risk by understanding when an asset's price is likely to reverse. By avoiding trades against the prevailing trend, traders minimize the potential for losses.
Identifying overbought and oversold conditions with technical indicators
Now let us discover how some technical indicators provide valuable insights into market conditions, assisting traders in strategic decision-making.
Relative strength index (RSI)
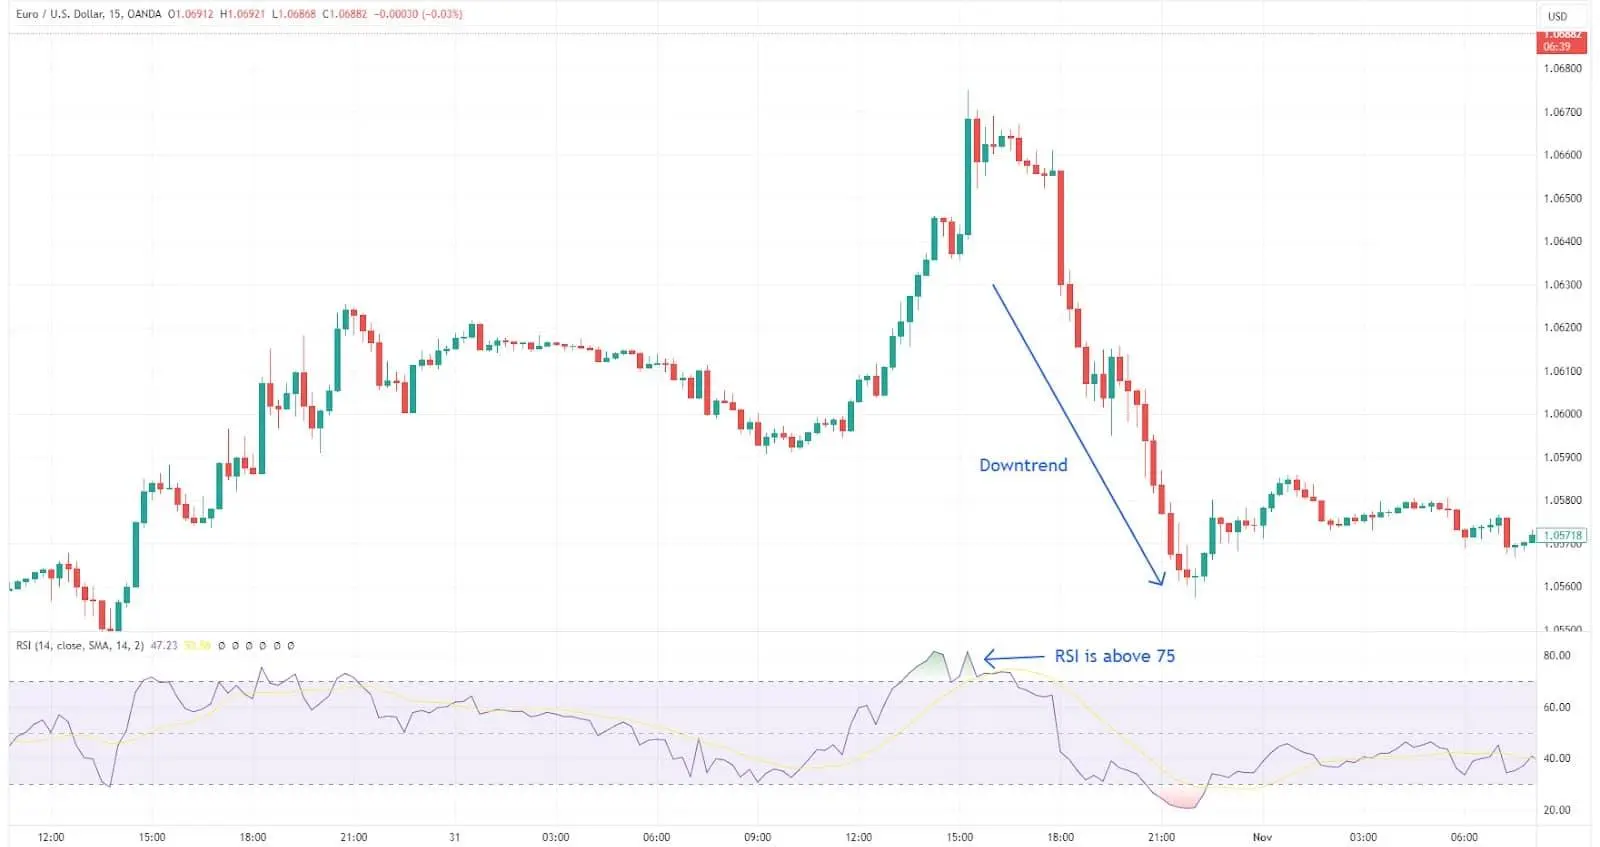
How RSI works: RSI acts like a speedometer for price movements, ranging from 0 to 100. Readings above 70 signal overbought conditions, while readings below 30 indicate oversold conditions.
Interpretation of RSI values: Traders use RSI to identify potential reversal points.
 Relative strength index (RSI)
Bollinger Bands
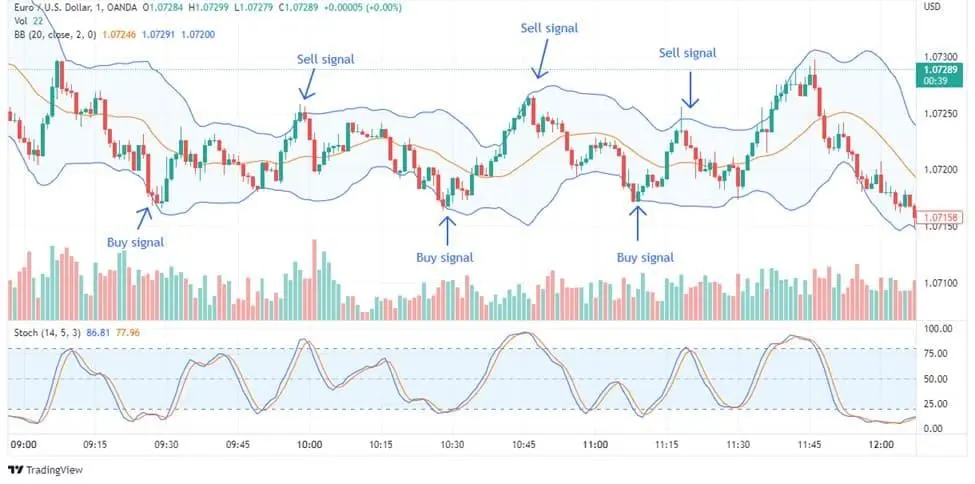
Calculation and use: Bollinger Bands consist of a moving average and two standard deviation lines. When the price moves towards the upper band, it indicates overbought conditions, while a move towards the lower band indicates oversold conditions.
Identifying breakouts and reversals: Traders use Bollinger Bands to spot potential breakouts and reversals.
 Bollinger Bands
Stochastic oscillator
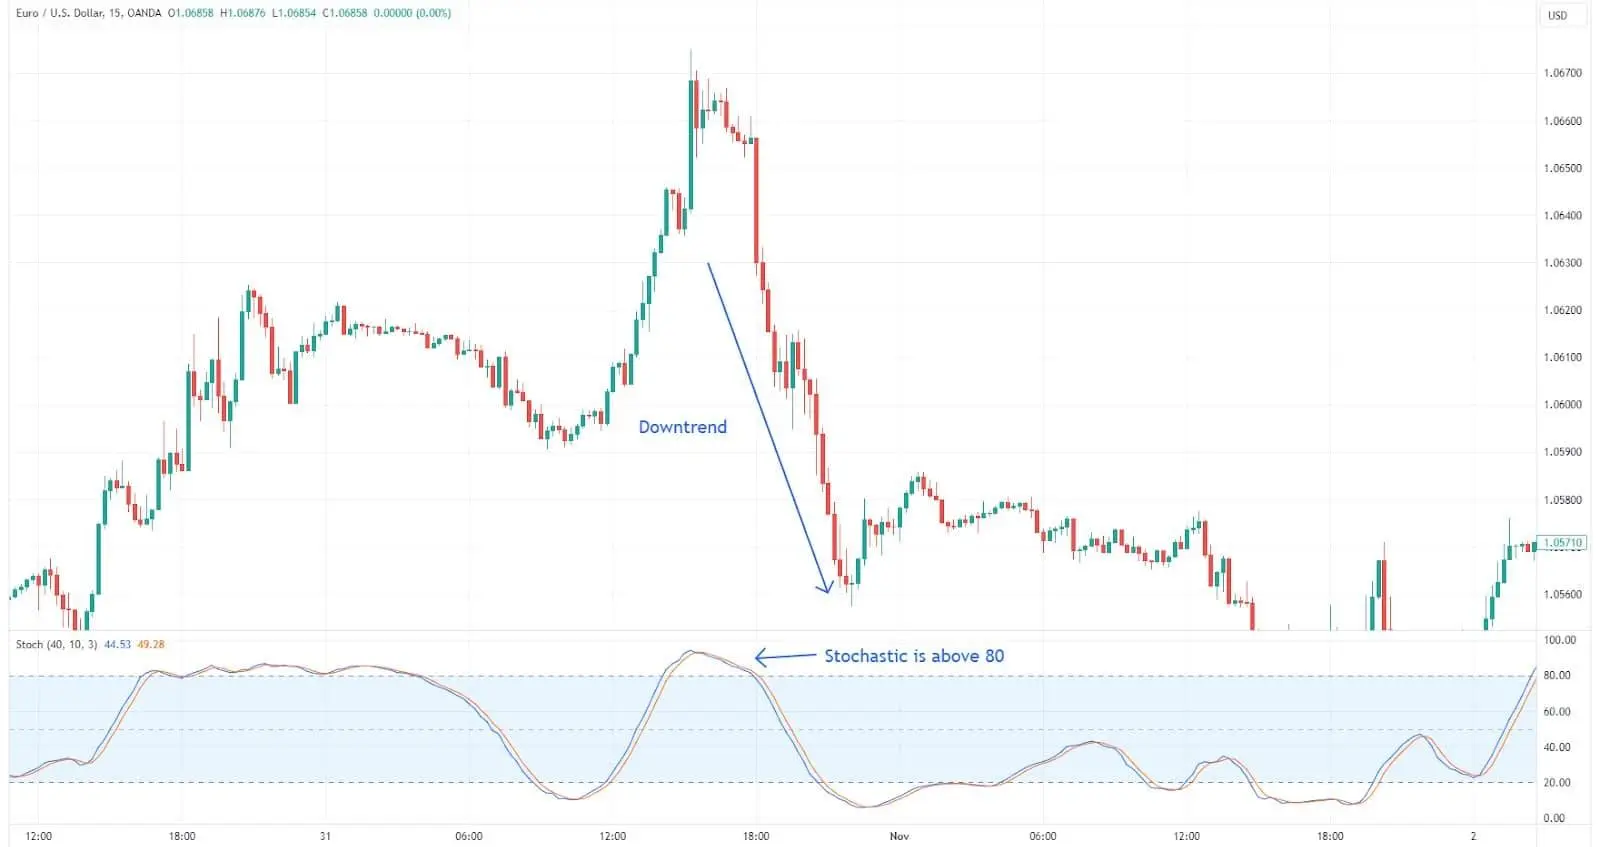
Understanding stochastic levels: This indicator compares a specific closing price of an asset to a range of its prices over a certain period. Values above 80 indicate overbought conditions, and values below 20 indicate oversold conditions.
Application in trading: The stochastic oscillator helps traders identify potential reversal points aiding in the timing of market entries and exits.
 Stochastic oscillator
Williams %R
Measuring market conditions: Williams %R is a momentum indicator that compares the current closing price to the high-low range over a specified period. Readings above -20 indicate overbought conditions, and readings below -80 indicate oversold conditions.
Using Williams %R for trade signals: This indicator is used to generate trade signals based on overbought and oversold conditions.
What influences overbought and oversold conditions?
Various factors influence overbought and oversold conditions:
 How to short cryptocurrency
Market sentiment and psychology: The overall mood of traders and investors has a big impact on market movements, often leading to situations where prices are either too high (overbought) or too low (oversold).
Economic indicators and news events: News about the economy, like job reports or inflation numbers, can cause big swings in the market, affecting overbought and oversold conditions.
Historical price data and trends: Analyzing historical data helps identify patterns and potential future movements.
External factors and market volatility: Things happening outside the market, like politics or natural disasters, can make prices swing a lot, affecting overbought and oversold conditions.
Overbought and oversold-based trading strategies
Trading strategies based on overbought and oversold conditions can be very effective if used correctly. Each indicator has its own set of strategies tailored to its unique characteristics.
RSI-based strategies
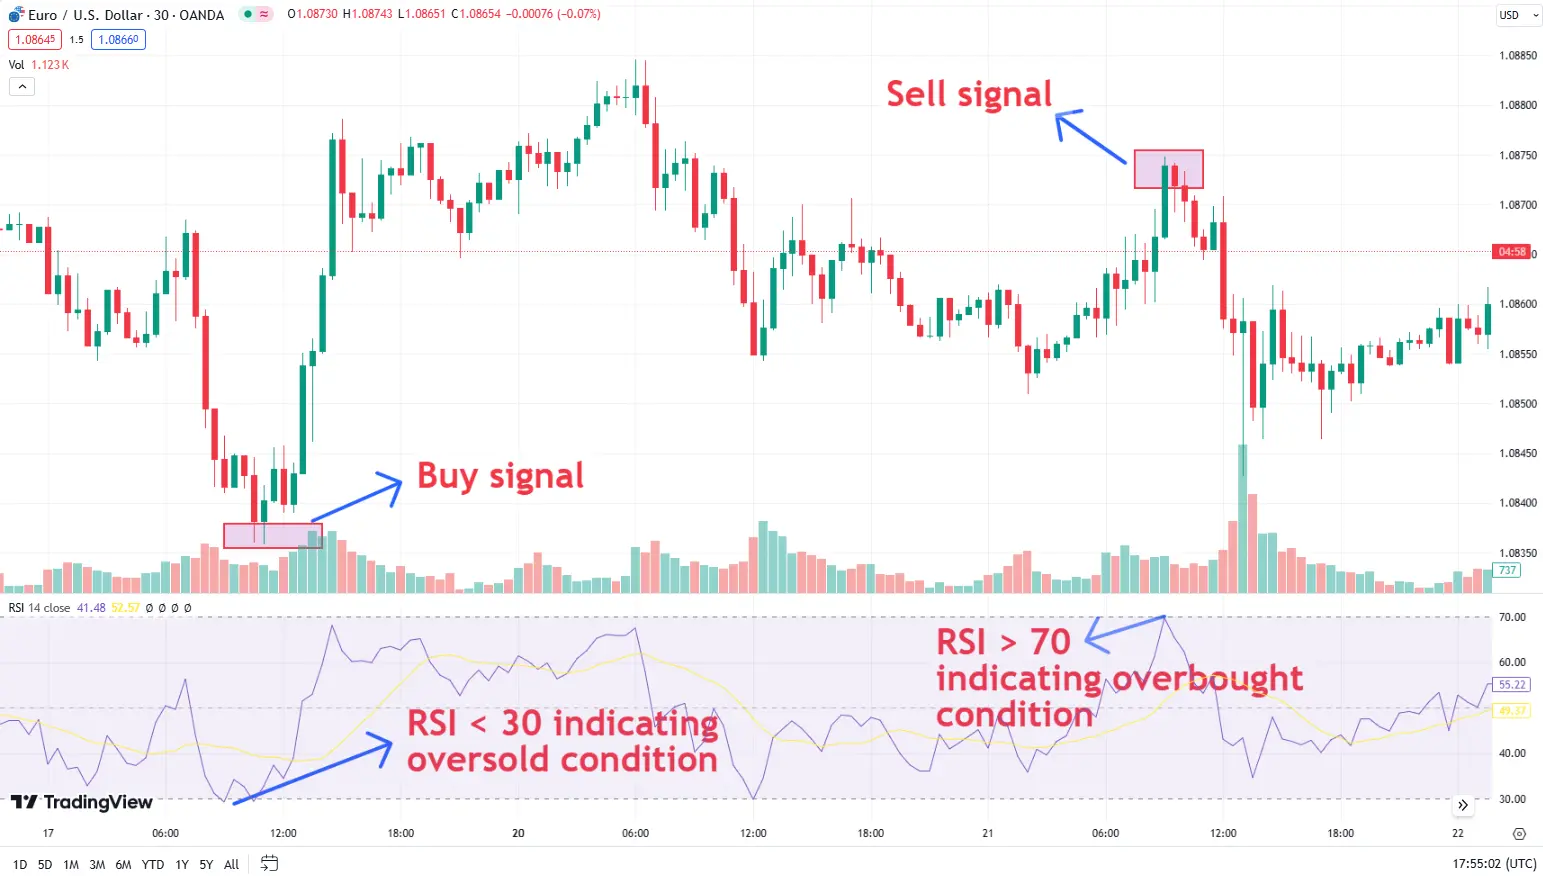
Entry and exit points: The RSI is particularly useful for identifying entry and exit points. For example, a trader might look to buy an asset when the RSI drops below 30 (indicating it is oversold) and sell when the RSI rises above 70 (indicating it is overbought).
Managing risk with RSI: Incorporate risk management techniques such as setting stop-loss orders below recent lows when buying in oversold conditions and above recent highs when selling in overbought conditions. This approach helps in protecting against significant losses.
 Using RSI strategy for buy and sell levels
Bollinger Bands strategies
Trading breakouts and contractions: Bollinger Bands can help identify when an asset is overbought or oversold based on its position relative to the bands. A move outside the bands often signals a breakout, while a move back inside can indicate a reversal.
Combining with other indicators: Enhance the effectiveness of Bollinger Bands by combining them with other indicators like RSI or moving averages. This multi-indicator approach can provide more robust signals.
 Combination of RSI strategy with bollinger band strategy
Stochastic oscillator strategies
Identifying market reversals: The stochastic oscillator is effective in identifying potential market reversals. Traders can look for buy signals when the oscillator moves below 20 (indicating an oversold condition) and sell signals when it moves above 80 (indicating an overbought condition). Learn more about stochastic oscillator strategy for binary options trading.
Setting stop-loss and take-profit levels: Use the stochastic signals to set stop-loss and take-profit levels. For instance, placing a stop-loss just below the recent low when buying in oversold conditions can help manage risk.
Indicator | Strategy | Entry/Exit Points | Risk Management | Price Action Confirmation |
|---|---|---|---|---|
RSI | Identifying market reversals based on RSI levels | Buy when RSI < 30 (oversold); Sell when RSI > 70 (overbought) | Set stop-loss orders below recent lows for buys and above recent highs for sells | Validate signals with candlestick patterns or chart formations |
Bollinger Bands | Trading breakouts and contractions, combining with other indicators | Trade on price movements relative to the bands: outside bands (breakout), inside bands (reversal) | Use other indicators like RSI for confirmation; set stop-loss outside the bands to manage risk | Confirm breakout or reversal signals with increasing volume |
Stochastic Oscillator | Identifying potential market reversals | Buy when Stochastic < 20 (oversold); Sell when Stochastic > 80 (overbought) | Set stop-loss just below recent lows for buys and just above recent highs for sells | Confirm oversold/overbought conditions with price action signals |
Williams %R | Generating trade signals based on Williams %R readings | Buy when Williams %R < -80 (oversold); Sell when Williams %R > -20 (overbought) | Consider broader market context and use other indicators for confirmation; set stop-loss according to recent price movements | Verify extreme %R readings with trendline analysis or chart patterns |
Risk and warning
Understanding the risks associated with trading based on overbought and oversold conditions is crucial for long-term success. While these indicators can provide valuable signals, they are not foolproof and should be used in conjunction with other analysis tools and strategies.
Potential risks: Overbought and oversold conditions can sometimes produce false signals, especially in highly volatile markets. Traders should be aware that relying solely on these signals can lead to losses.
Risk management techniques: Effective risk management is essential. Techniques such as setting stop-loss orders, limiting position sizes, and diversifying trades can help mitigate potential risks. Always consider the broader market context and avoid making decisions based solely on indicator readings.
Common mistakes: Common mistakes include ignoring market trends, overleveraging, and failing to set stop-loss orders. Avoiding these errors can significantly improve trading outcomes.
Understanding the Significance of Key Technical Indicators in Binary Options Trading

When analyzing overbought and oversold conditions in binary options trading, I adopt a systematic approach to ensure precision and effectiveness.
I recommend beginning with a thorough understanding of the key technical indicators , such as RSI, Bollinger Bands , and Stochastic oscillator , by studying their historical performance in various market conditions.
Next, evaluate the reliability of these indicators through backtesting. This involves applying the indicators to historical data to see how well they predict market reversals. Accuracy in backtesting is crucial for developing a reliable strategy.
Consider the market context and broader economic factors that can influence these conditions. Market volatility and news events play significant roles in the reliability of overbought and oversold signals. Understanding these external influences helps refine trading strategies.
It's also important to integrate these indicators with a solid risk management plan . This includes setting appropriate stop-loss orders and diversifying trades to manage exposure and protect your capital.
Finally, stay updated with ongoing market trends and continuously refine your strategies based on real-time data and performance feedback.
Conclusion
In binary options trading, understanding overbought and oversold conditions can significantly enhance your trading strategy. These conditions, identified through technical indicators such as RSI, Bollinger bands, Stochastic oscillator, offer critical insights into potential market reversals. By recognizing these signals, traders can optimize entry and exit points, and improve their overall trading performance.
However, it is essential to consider the broader market context and combine these signals with other analysis tools to avoid false signals and mitigate risks. Effective risk management techniques, such as setting stop-loss orders and diversifying trades, are crucial for protecting your investments and ensuring long-term success.
FAQs
What are the benefits of trading based on overbought and oversold conditions?
Trading based on overbought and oversold conditions can help traders enter and exit trades at optimal points, potentially increasing profit margins. These conditions provide clear signals for potential market reversals, aiding in better decision-making.
How do Bollinger Bands help in identifying overbought and oversold conditions?
Bollinger Bands consist of a moving average and two standard deviation lines, forming a channel around the price of an asset. When the price moves towards the upper band, it indicates overbought conditions, while a move towards the lower band indicates oversold conditions.
What are some common pitfalls when trading based on overbought and oversold conditions?
Common pitfalls include relying solely on one indicator without considering the broader market context, failing to implement proper risk management techniques like stop-loss orders, and overtrading based on frequent signals in highly volatile markets.
How does the Relative Strength Index (RSI) contribute to multiple time frame analysis?
The RSI helps identify overbought and oversold conditions across different time frames, offering insights into potential trend reversals. By comparing RSI values on short-term and long-term charts, traders can better assess the strength of a trend and make more informed trading decisions.
Editors' Top Picks and Insights

Bitcoin mining is getting greener, but the debate isn't over

Asia's largest IPO: How CXMT became China's most valuable company

Global fintech in 2026: Three trends that matter

From Jesus Christ to aliens: Polymarket's most absurd prediction markets

Hunting crypto owners: Why criminals have gone offline

BitMEX is shutting down: Why Trump could not save the exchange
Related Articles
Team that worked on the article
Parshwa is a content expert and finance professional possessing deep knowledge of stock and options trading, technical and fundamental analysis, and equity research. As a Chartered Accountant Finalist, Parshwa also has expertise in Forex, crypto trading, and personal taxation.
Dr. BJ Johnson is a PhD in English Language and an editor with over 15 years of experience. He earned his degree in English Language in the U.S and the UK.
Mirjan Hipolito is a journalist and news editor at Traders Union. She is an expert crypto writer with five years of experience in the financial markets.
Volatility refers to the degree of variation or fluctuation in the price or value of a financial asset, such as stocks, bonds, or cryptocurrencies, over a period of time. Higher volatility indicates that an asset's price is experiencing more significant and rapid price swings, while lower volatility suggests relatively stable and gradual price movements.
Overtrading is a phenomenon where a trader executes too many transactions in the market, surpassing their strategy and trading more frequently than planned. It's a common mistake that can lead to financial losses.
Bitcoin is a decentralized digital cryptocurrency that was created in 2009 by an anonymous individual or group using the pseudonym Satoshi Nakamoto. It operates on a technology called blockchain, which is a distributed ledger that records all transactions across a network of computers.
Backtesting is the process of testing a trading strategy on historical data. It allows you to evaluate the strategy's performance in the past and identify its potential risks and benefits.
Cryptocurrency is a type of digital or virtual currency that relies on cryptography for security. Unlike traditional currencies issued by governments (fiat currencies), cryptocurrencies operate on decentralized networks, typically based on blockchain technology.

-
 Afghanistan
-
 Albania
-
 Algeria
-
 Angola
-
 Argentina
-
 Armenia
-
 Australia
-
 Austria
-
 Azerbaijan
-
 Bahamas
-
 Bahrain
-
 Bangladesh
-
 Belarus
-
 Belgium
-
 Bolivia
-
 Botswana
-
 Brazil
-
 Brunei
-
 Bulgaria
-
 Cambodia
-
 Cameroon
-
 Canada
-
 Chile
Chile
-
 China
China
-
 Colombia
-
 Congo
Congo
-
 Costa Rica
-
 Cote d'Ivoire
-
 Croatia
-
 Cuba
Cuba
-
 Cyprus
-
 Czechia
-
 DR Congo
-
 Denmark
-
 Dominican Republic
-
 Ecuador
-
 Egypt
Egypt
-
 El Salvador
-
 Estonia
-
 Eswatini
-
 Ethiopia
-
 Finland
-
 France
-
 Georgia
-
 Germany
-
 Ghana
Ghana
-
 Greece
-
 Haiti
Haiti
-
 Hong Kong
-
 Hungary
-
 India
India
-
 Indonesia
-
 Iran, Islamic republic
-
 Iraq
Iraq
-
 Ireland
-
 Israel
-
 Italy
Italy
-
 Jamaica
-
 Japan
Japan
-
 Jordan
-
 Kazakhstan
-
 Kenya
Kenya
-
 Korea
Korea
-
 Kuwait
-
 Kyrgyzstan
-
 Laos
Laos
-
 Latvia
-
 Lebanon
-
 Lesotho
-
 Libya
Libya
-
 Lithuania
-
 Luxembourg
-
 Madagascar
-
 Malaysia
-
 Malta
Malta
-
 Mauritius
-
 Mexico
-
 Moldova
-
 Mongolia
-
 Montenegro
-
 Morocco
-
 Mozambique
-
 Myanmar
-
 Namibia
-
 Nepal
Nepal
-
 Netherlands
-
 New Zealand
-
 Nigeria
-
 North Macedonia
-
 Norway
-
 Oman
Oman
-
 Pakistan
-
 Palestine
-
 Panama
-
 Papua New Guinea
-
 Paraguay
-
 Peru
Peru
-
 Philippines
-
 Poland
-
 Portugal
-
 Puerto Rico
-
 Qatar
Qatar
-
 Reunion
-
 Romania
-
 Rwanda
-
 Saudi Arabia
-
 Serbia
-
 Singapore
-
 Slovakia
-
 Slovenia
-
 Somalia
-
 South Africa
-
 Spain
Spain
-
 Sri Lanka
-
 Sweden
-
 Switzerland
-
 Syria
Syria
-
 Taiwan
-
 Tajikistan
-
 Tanzania
-
 Thailand
-
 Trinidad and Tobago
-
 Tunisia
-
 Turkey
-
 UAE
UAE
-
 Uganda
-
 Ukraine
-
 United Kingdom
-
United States
-
 Uruguay
-
 Uzbekistan
-
 Venezuela
-
 Vietnam
-
 Yemen
Yemen
-
 Zambia
-
 Zimbabwe
- Forex
- Crypto
