How To Use Williams %R To Catch Fast Market Movements


Editorial Note: While we adhere to strict Editorial Integrity, this post may contain references to products from our partners. Here's an explanation for How We Make Money. None of the data and information on this webpage constitutes investment advice according to our Disclaimer.
Williams %R is a fast-moving momentum oscillator that shows where the current close stands relative to the recent high-low range. It helps traders spot quick shifts in buying or selling pressure, making it useful for identifying when a move is losing strength — even before the price fully reacts. Rather than acting on every extreme reading, smart traders use Williams %R to judge whether a trend still has energy or is about to reverse.
Williams %R is usually seen as one of those standard tools that just points to overbought or oversold conditions. But when you start to notice how fast it moves compared to other indicators it gives you something more valuable. It picks up on quick pressure changes and signs of the market tiring out.
When it stays near the top it is not just saying buyers are active. It shows that they are pushing hard. When it sinks to the bottom it does not always mean a bounce is coming. Sometimes it means the buyers are gone. To understand it truly, you will have to read through this article, where we have covered all the key aspects of Williams %R.
Introduction to Williams %R
Williams %R is a momentum oscillator that helps traders identify overbought and oversold conditions. It compares the current closing price to the high-low range over a specific period, giving a quick snapshot of whether the market is nearing a potential turning point. Despite its visual similarity to the stochastic oscillator, Williams %R is faster and tends to react more sharply to price changes.
What it shows
Ranges from 0 to -100, with values near 0 indicating overbought and values near -100 signaling oversold.
Often used to time entries and exits based on price exhaustion.
Helps traders decide whether the current move has more room or is about to reverse.
This indicator is especially popular among short-term traders and scalpers who want fast signals, but it can be applied on any timeframe for added context.
Origin and development of Williams %R
Williams %R was developed by Larry Williams, a renowned trader and market technician known for creating practical tools rooted in real trading experience. He introduced this indicator in the 1970s as a way to spot market tops and bottoms more quickly than other momentum indicators available at the time.
Who created it
Larry Williams, a trader and author with decades of market experience.
Also known for winning the Robbins World Cup Trading Championship.
Focused on creating tools that worked well in fast-paced markets.
Why it was created
Williams wanted a tool that could identify when markets were overextended within a recent trading range.
Unlike RSI or CCI, which may lag in fast conditions, Williams %R was designed to be very responsive.
It flips the values (compared to Stochastic) so traders could interpret overbought and oversold zones with a reversed scale.
How it became popular
Initially used in commodities and futures markets.
Quickly gained traction among day traders and short-term investors.
Still included in all major trading platforms and often paired with trend-following tools for confirmation.
Understanding the Williams %R formula

Williams %R is based on a simple concept — it measures where the current closing price stands relative to the highest high and lowest low over a recent period. The result shows whether price is near the top or bottom of its recent range, which helps spot potential reversals or pullbacks.
The formula
Williams %R = (Highest High − Close) / (Highest High − Lowest Low) × −100
Where:
Highest High is the highest price in the chosen period.
Lowest Low is the lowest price in that same period.
Close is the most recent closing price.
The result is multiplied by –100 to flip the scale.
What the output means
A value near 0 means price is close to the high of the range → overbought.
A value near -100 means price is near the low of the range → oversold.
Values around -50 suggest price is in the middle of the range and no strong momentum is present.
Example calculation
Let’s say:
Highest high over last 14 candles = 120
Lowest low = 100
Most recent close = 115
Williams %R = (120 − 115) / (120 − 100) × −100 = −25
This means price is close to the top of the range, and conditions may be nearing overbought.
Key insight
The shorter the lookback period (like 9 or 10), the more sensitive Williams %R becomes.
A longer period (like 20 or more) smooths the results and filters out some noise.
The indicator flips the output to stay within 0 to -100, giving it a unique scale that stands out from other tools.
How to set up Williams %R
Williams %R is available on all major trading platforms and only takes a few seconds to set up. Once added, it appears as a single line that moves between 0 and –100.
Access the indicator
Finding and applying the Williams %R to your chart is a straightforward process.
How to get started
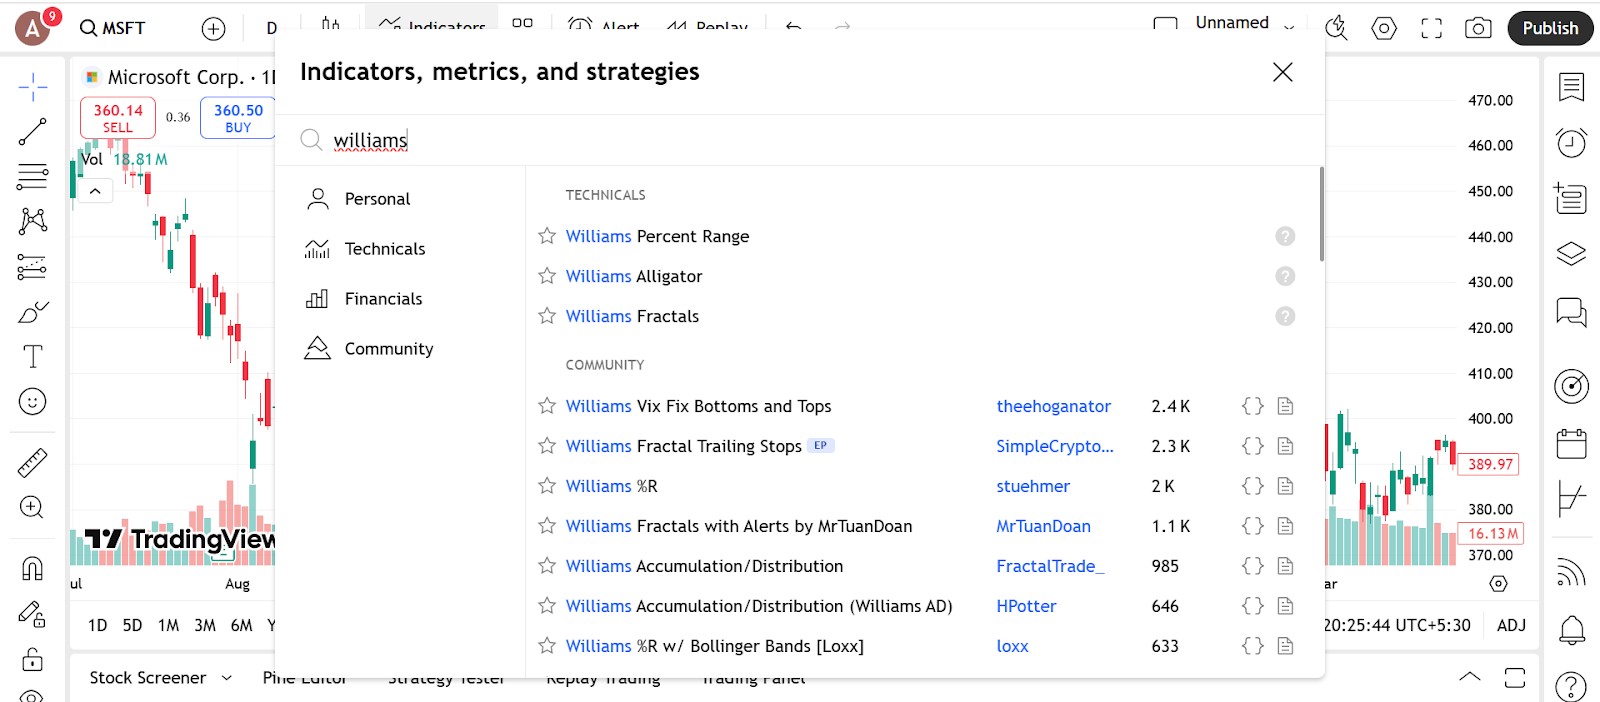
Open the indicators list on your trading platform.
Search for Williams %R or Williams Percent Range.
Click to apply — the indicator will appear in a separate pane below your price chart.
Platforms that support it
Built-in by default on TradingView, MetaTrader 4 and 5, ThinkorSwim, NinjaTrader, and most other platforms.
No custom downloads or plug-ins are required.
What it looks like
A single line oscillates between 0 and –100.
Many platforms also add horizontal levels at –20 (overbought) and –80 (oversold) for quick reference.
Configure the parameters

Once the indicator is on your chart, you can adjust the settings to better fit your trading style.
Default settings
The most common setting is a 14-period.
This means Williams %R will compare the current closing price to the high-low range of the last 14 candles.
It offers a balanced view between sensitivity and stability.
Custom adjustments
Shorter periods (e.g. 9 or 10)
Respond faster to price movement.
More suitable for intraday or fast-paced trading.
Can generate more frequent signals.
Longer periods (e.g. 20 or 21)
Smoother results with fewer false signals.
Useful for swing or position trading.
Visual settings
You can customize the color and thickness of the %R line for better visibility.
Adjust the overbought and oversold lines (default is –20 and –80) to fit your strategy, for example, use –10 and –90 for more extreme signals.
Enable alerts when the line crosses key levels if your platform supports it.
Trading strategies using Williams %R
Williams %R works best when combined with trend filters or price action and is especially useful in fast-moving markets. Here are the most popular strategies built around it:
Overbought and oversold reversal strategy
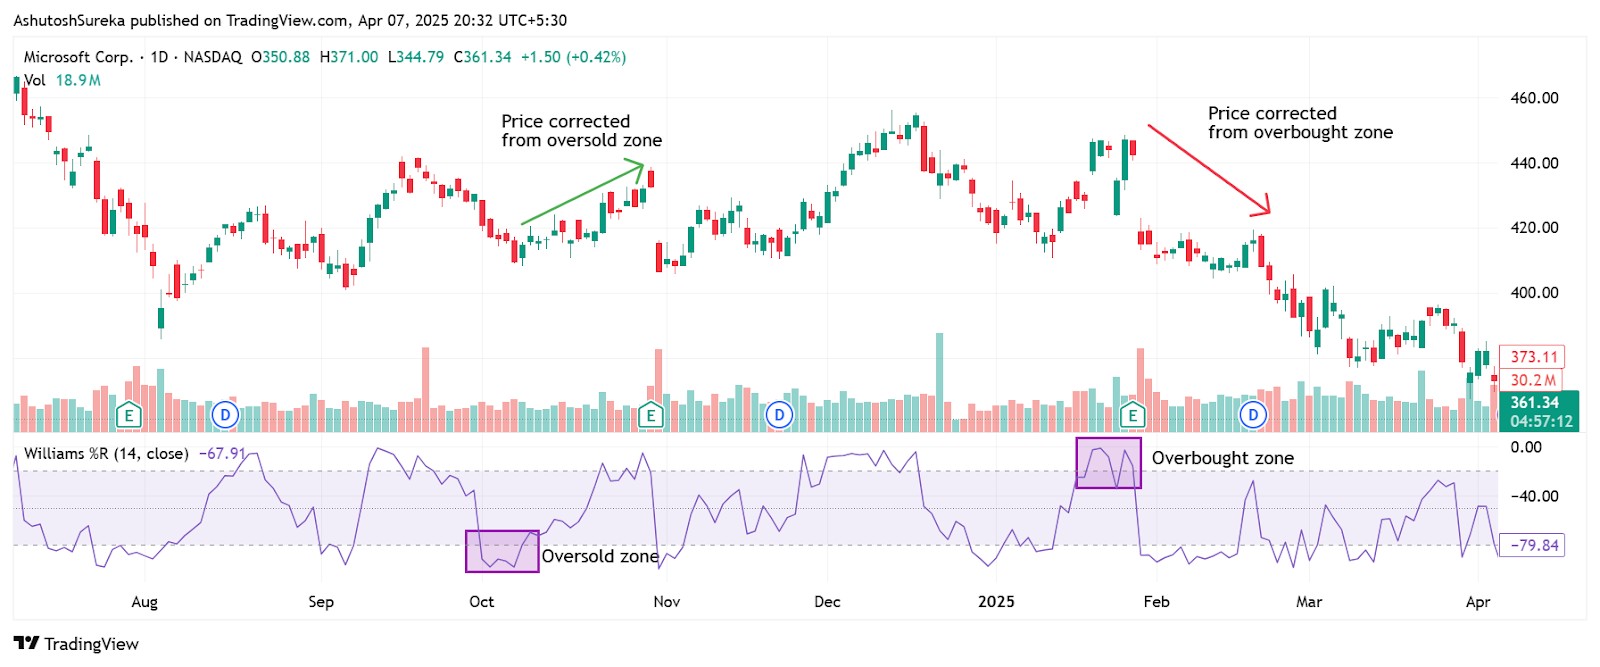
This is the most common way traders use Williams %R, spotting when a strong move is likely to slow down or reverse.
How it works
When Williams %R rises above –20, price is considered overbought.
When it falls below –80, price is considered oversold.
Look for price stalling or reversing near these levels for potential entries.
Entry tips
Enter short when price hits resistance and Williams %R crosses down from the overbought zone.
Enter long when price hits support and the line crosses up from the oversold zone.
Use price confirmation — like a candlestick pattern — before pulling the trigger.
Trend continuation pullback strategy

Williams %R is also useful for finding trades in the direction of the trend — after a temporary pullback.
How it works
In an uptrend, wait for Williams %R to dip below –80, then rise back above it.
In a downtrend, wait for it to spike above –20, then fall again.
This shows the pullback is losing steam, and momentum is resuming.
Entry idea
Combine this setup with a moving average (like the 50 EMA) to confirm the trend.
Enter in the trend direction once Williams %R comes out of the extreme zone.
Breakout confirmation strategy
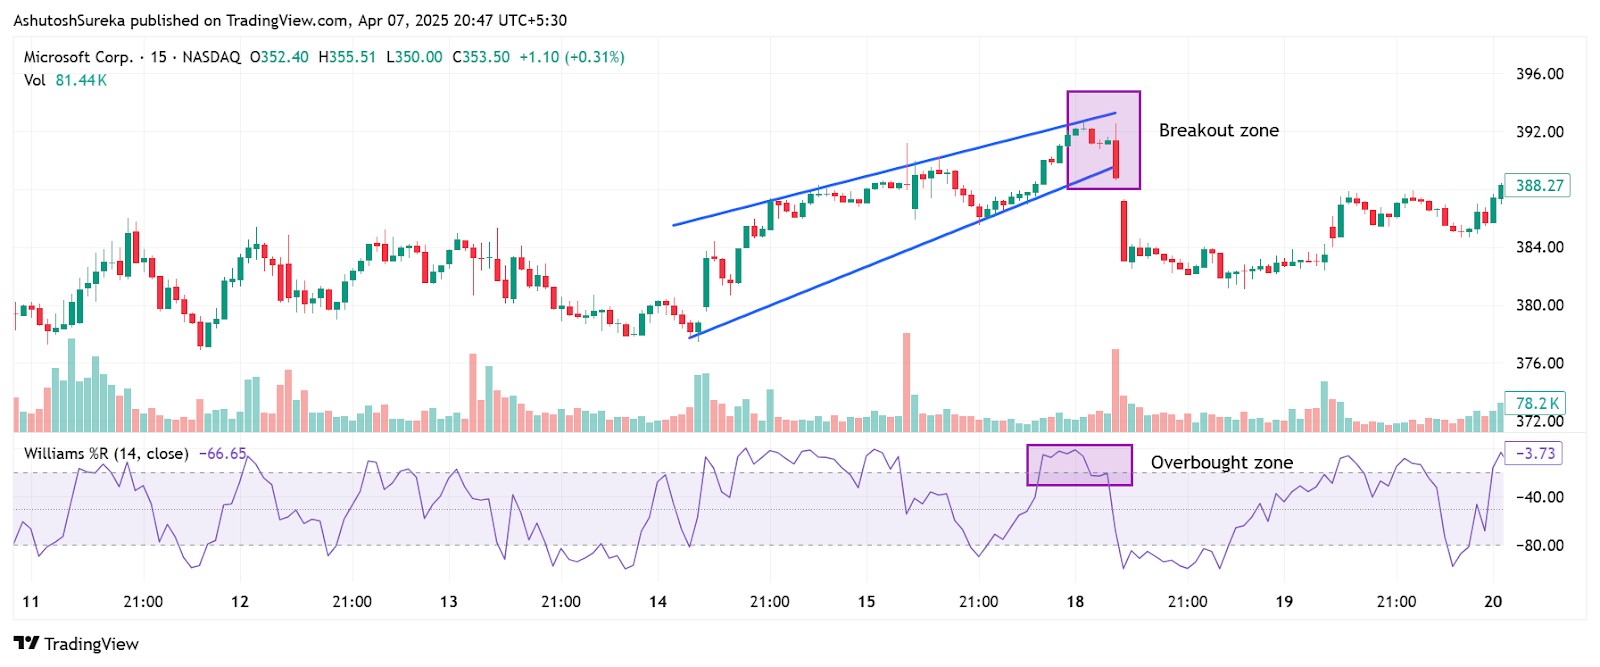
You can use Williams %R to confirm whether a breakout has real momentum or is likely to fail.
What to watch
When price breaks above resistance, check if Williams %R is near –20 or above.
When breaking below support, see if it’s near –80 or lower.
If the indicator is flat near –50, the breakout may lack momentum.
How this helps
Prevents chasing weak breakouts.
Adds momentum confirmation to price action setups.
If your trading strategy requires the use of many technical indicators, using a broker that supports TradingView, MT5, or cTrader can make your life easier. These tools provide access to a wide range of technical tools, covering almost all the strategies you can think of. In the table below, we have presented the top brokers with access to the abovementioned platforms. You can compare them and choose the best one for yourself:
| Currency pairs | Crypto | Stocks | Min. deposit, $ | Max. leverage | TradingView | MT5 | cTrader | Regulation | TU overall score | Open an account | |
|---|---|---|---|---|---|---|---|---|---|---|---|
| 50 | Yes | Yes | 10 | 1:1000 | No | Yes | No | No | 7.95 | Go to broker Your capital is at risk.
|
|
| 60 | Yes | Yes | 100 | 1:300 | Yes | No | No | CySEC, FCA, ASIC, FMA, FSCA, FSA Seychelles, EFSA, MAS, DFSA, SCB | 7.52 | Go to broker 80% of retail CFD accounts lose money. |
|
| 69 | No | No | 50 | 1:50 | Yes | Yes | No | CFTC, NFA | 6.81 | Go to broker Your capital is at risk. |
|
| 68 | Yes | Yes | No | 1:200 | Yes | Yes | No | FSC (BVI), ASIC, IIROC, FCA, CFTC, NFA | 6.8 | Go to broker Your capital is at risk. |
|
| 80 | Yes | Yes | 100 | 1:50 | Yes | Yes | No | CIMA, FCA, FSA (Japan), NFA, IIROC, ASIC, CFTC | 6.74 | Study review |
Why trust us
15+ years of independent market analysis
140+ evaluation criteria, reviewed by 50+ experts
Data-driven reviews of 200+ platforms, updated regularly
20+ industry awards & a wide network of global media partners
Learn more about our methodology and editorial policies.


Advantages of Williams %R
It reacts fast and helps you stay ahead. Williams %R is quicker than most momentum tools, making it great for spotting short-term shifts before they fully show up on the chart. It's ideal for scalping, timing breakouts, or catching early signs of a reversal.
It’s simple, clean, and easy to read. The indicator uses one line that moves between 0 and –100, with clear zones at –20 and –80 to mark overbought and oversold levels. Even on a cluttered chart or in fast markets, it gives you instant visual cues without confusion.
It sharpens your entry and exit timing. Instead of buying into peaks or selling too early, Williams %R helps you spot exhaustion points in a move. Paired with price structure, it works in both trends and ranges to show when momentum is fading or picking up.
It’s ready to use on any platform. No special setup needed, it’s built into MetaTrader, TradingView, ThinkorSwim, and more. You can combine it effortlessly with moving averages or volume indicators to add extra confirmation to your trades.
Limitations of Williams %R
It can fire off signals too early. Because Williams %R is so responsive, it might flash an entry before the market is actually ready to reverse. A move past –80 or –20 doesn’t always mean a turn is coming right away. It’s best to wait for confirmation from price action or a secondary indicator.
It doesn’t tell you the trend direction. Williams %R only measures where price sits within its recent range, it won’t tell you if the broader trend is up or down. To avoid trading against the momentum, it’s smart to pair it with a moving average or support/resistance zones.
It loses clarity in sideways markets. When price is choppy or volume drops, Williams %R tends to hover near the middle or whip around without offering useful signals. In these cases, it’s easy to get caught in fake outs unless the market is moving with purpose.
It needs tuning to fit your trading style. The default 14-period setting works fine for many, but it may lag in fast trades or be too noisy if shortened. You’ll need to adjust the settings based on your timeframe, asset, and strategy to get the best results.
Wait for confirmation bounce and watch mid-range momentum clues

Most traders jump into trades the moment Williams %R hits extreme levels, but here’s the real edge, wait for the bounce back. If it drops below –80 and then pulls back up, that’s a clue that buyers didn’t panic — they stepped up and pushed back. It’s like watching someone fall, then stand right back up. That comeback tells you a lot more than just a dip. The same works in reverse — when %R crosses above –20 and then turns back down, it’s often the first sign that the rally is running on fumes.
Here’s another move most people miss: watch how %R behaves in the middle, not just at the extremes. If it can’t push above –50 during a bounce, something’s off. That’s a red flag that momentum is already fading, even if the price looks steady. On the flip side, when %R keeps pressing near –20 in an uptrend and refuses to drop — that’s strength. It’s not about just spotting turns; it’s about seeing who’s in control before the chart makes it obvious.
Conclusion
Williams Percent R is not built to call exact tops and bottoms. It helps you spot how strong the move really feels right now. The mistake is jumping in every time it hits a zone. What makes it useful is noticing how long the price stays strong or how quickly it loses steam. You are not reacting to a number. You are watching how the move plays out. When price keeps climbing but Williams Percent R cannot hold the highs that is your heads-up. Solid trades usually show up when the indicator reacts faster than the chart does.
FAQs
How is Williams %R different from RSI?
Williams %R measures the level of the current close relative to the high-low range over a set period, while RSI compares average gains and losses. Williams %R is more focused on recent highs and is plotted on an inverted scale.
Can Williams %R be used in Forex?
Yes, Williams %R is widely used in Forex trading to identify overbought and oversold conditions. It helps traders spot potential reversals, especially when combined with trend or volume indicators.
What is the difference between Williams %R and stochastic?
Both measure momentum and overbought or oversold levels, but Williams %R is faster and more sensitive to price changes. Stochastic includes a smoothing element, which can filter out some market noise.
Is Williams %R a reliable indicator on its own?
Williams %R can provide useful signals, but it's more effective when combined with other indicators. On its own, it may generate false signals, especially in choppy or sideways markets.
Editors' Top Picks and Insights

AI without limits: How dangerous are neural networks?

Worldcoin on Wall Street: From iris scans to ETF

Mark Cuban's wealth philosophy: Why stocks matter more than salary or crypto

Dangerous but indispensable: Why the crypto market needs bridges

Markus Levin: DePIN could power the AI agent economy

Pokémon cards for $2,500: How collectibles became a new form of gambling
Related Articles
Team that worked on the article
Rinat Gismatullin is an entrepreneur and a business expert with 9 years of experience in trading. He focuses on long-term investing, but also uses intraday trading.
Chinmay Soni is a financial analyst with more than 5 years of experience in working with stocks, Forex, derivatives, and other assets. As a founder of a boutique research firm and an active researcher, he covers various industries and fields, providing insights backed by statistical data.
Mirjan Hipolito is a journalist and news editor at Traders Union. She is an expert crypto writer with five years of experience in the financial markets.
Position trading is a long-term strategy where traders hold positions for extended periods, often weeks or months, based on fundamental analysis of an asset's value.
Index in trading is the measure of the performance of a group of stocks, which can include the assets and securities in it.
Forex trading, short for foreign exchange trading, is the practice of buying and selling currencies in the global foreign exchange market with the aim of profiting from fluctuations in exchange rates. Traders speculate on whether one currency will rise or fall in value relative to another currency and make trading decisions accordingly. However, beware that trading carries risks, and you can lose your whole capital.
Day trading involves buying and selling financial assets within the same trading day, with the goal of profiting from short-term price fluctuations, and positions are typically not held overnight.
CFD is a contract between an investor/trader and seller that demonstrates that the trader will need to pay the price difference between the current value of the asset and its value at the time of contract to the seller.

-
 Afghanistan
-
 Albania
-
 Algeria
-
 Angola
-
 Argentina
-
 Armenia
-
 Australia
-
 Austria
-
 Azerbaijan
-
 Bahamas
-
 Bahrain
-
 Bangladesh
-
 Belarus
-
 Belgium
-
 Bolivia
-
 Botswana
-
 Brazil
-
 Brunei
-
 Bulgaria
-
 Cambodia
-
 Cameroon
-
 Canada
-
 Chile
Chile
-
 China
China
-
 Colombia
-
 Congo
Congo
-
 Costa Rica
-
 Cote d'Ivoire
-
 Croatia
-
 Cuba
Cuba
-
 Cyprus
-
 Czechia
-
 DR Congo
-
 Denmark
-
 Dominican Republic
-
 Ecuador
-
 Egypt
Egypt
-
 El Salvador
-
 Estonia
-
 Eswatini
-
 Ethiopia
-
 Finland
-
 France
-
 Georgia
-
 Germany
-
 Ghana
Ghana
-
 Greece
-
 Haiti
Haiti
-
 Hong Kong
-
 Hungary
-
 India
India
-
 Indonesia
-
 Iran, Islamic republic
-
 Iraq
Iraq
-
 Ireland
-
 Israel
-
 Italy
Italy
-
 Jamaica
-
 Japan
Japan
-
 Jordan
-
 Kazakhstan
-
 Kenya
Kenya
-
 Korea
Korea
-
 Kuwait
-
 Kyrgyzstan
-
 Laos
Laos
-
 Latvia
-
 Lebanon
-
 Lesotho
-
 Libya
Libya
-
 Lithuania
-
 Luxembourg
-
 Madagascar
-
 Malaysia
-
 Malta
Malta
-
 Mauritius
-
 Mexico
-
 Moldova
-
 Mongolia
-
 Montenegro
-
 Morocco
-
 Mozambique
-
 Myanmar
-
 Namibia
-
 Nepal
Nepal
-
 Netherlands
-
 New Zealand
-
 Nigeria
-
 North Macedonia
-
 Norway
-
 Oman
Oman
-
 Pakistan
-
 Palestine
-
 Panama
-
 Papua New Guinea
-
 Paraguay
-
 Peru
Peru
-
 Philippines
-
 Poland
-
 Portugal
-
 Puerto Rico
-
 Qatar
Qatar
-
 Reunion
-
 Romania
-
 Rwanda
-
 Saudi Arabia
-
 Serbia
-
 Singapore
-
 Slovakia
-
 Slovenia
-
 Somalia
-
 South Africa
-
 Spain
Spain
-
 Sri Lanka
-
 Sweden
-
 Switzerland
-
 Syria
Syria
-
 Taiwan
-
 Tajikistan
-
 Tanzania
-
 Thailand
-
 Trinidad and Tobago
-
 Tunisia
-
 Turkey
-
 UAE
UAE
-
 Uganda
-
 Ukraine
-
 United Kingdom
-
United States
-
 Uruguay
-
 Uzbekistan
-
 Venezuela
-
 Vietnam
-
 Yemen
Yemen
-
 Zambia
-
 Zimbabwe
- Forex
- Crypto
