Parabolic SAR. A Comprehensive Guide For Traders


Editorial Note: While we adhere to strict Editorial Integrity, this post may contain references to products from our partners. Here's an explanation for How We Make Money. None of the data and information on this webpage constitutes investment advice according to our Disclaimer.
Parabolic SAR is a trend-following indicator that adjusts dynamically based on market momentum, plotting dots above or below price to show potential trend shifts. When tuned correctly to match asset volatility, it becomes more than just a trailing stop — it helps traders exit strong moves before momentum fades.
Most traders look at Parabolic SAR as just a basic trend indicator that switches sides when price turns. But what actually makes it useful is how it adjusts to how fast the market is moving. It uses a built-in speed that tightens or eases up depending on momentum. Where most traders go wrong is using the default setting without thinking about how fast or slow the asset really moves.
If you learn to dial in that setting based on how volatile the asset is, SAR turns into more than a trailing stop. It helps you stay in sync with how the market is moving in real time. In this article, we will take a detailed look into using the Parabolic SAR indicator for trading, along with its key advantages, disadvantages, and most popular strategies.
Introduction to Parabolic SAR
Parabolic SAR is a trend-following indicator designed to help traders identify potential reversal points and manage trade exits. The name SAR stands for stop and reverse, which reflects the indicator’s main function — suggesting when a trend may be ending and it’s time to either close a position or switch directions.
How it works
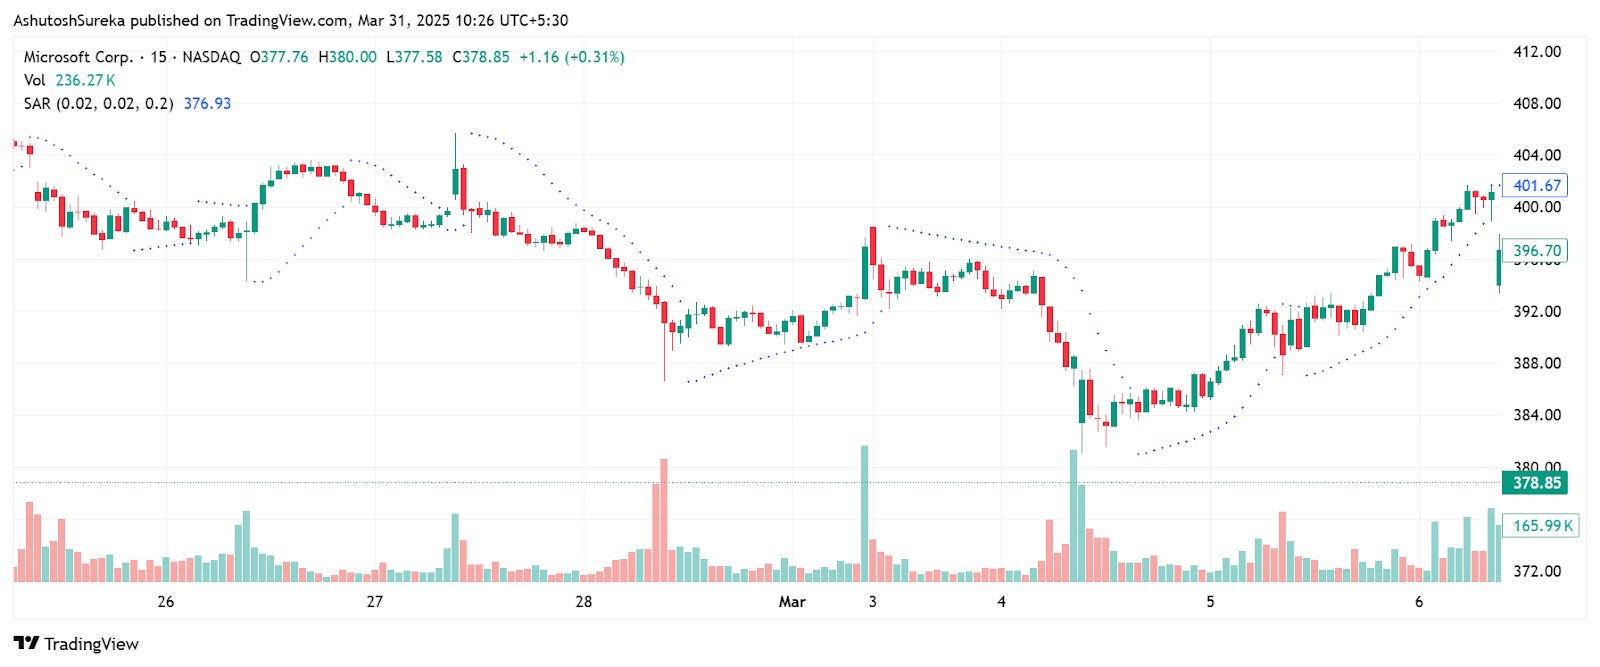
The indicator plots dots above the price during a downtrend and below the price in an uptrend.
When the dots flip from one side of the price to the other, it signals a possible change in trend.
It helps traders stay with the trend while also pointing to potential exit or stop-loss points.
What makes it unique
Designed as a dynamic trailing stop — it tightens as the trend continues, helping to lock in profits.
Works best in strong trending conditions.
Not just for entries or exits — many traders use it for trade management during an open position.
Parabolic SAR is easy to read and visually clear, making it especially helpful for traders who prefer rule-based systems with minimal interpretation.
Origin and development of Parabolic SAR
Parabolic SAR was developed by J. Welles Wilder, a well-known name in technical analysis. He introduced it in the late 1970s as part of his effort to create objective tools that reduce emotional decision-making in trading.
Who created it
J. Welles Wilder The same creator behind RSI, ATR, and DMI. He focused on building tools that gave clear, mechanical trading signals.
Published in 1978 Introduced in his book “New Concepts in Technical Trading Systems”.
Understanding the Parabolic SAR indicator
While the Parabolic SAR may look like just a series of dots above or below the price, the logic behind it is based on price movement and momentum. To use it effectively, it helps to understand what drives those dots — and how they adjust over time.
Key components of Parabolic SAR
There are a few moving parts behind the scenes that shape how the Parabolic SAR works on your chart. These parts are what cause the indicator to tighten or reverse during a trend.
The SAR value
This is the actual point plotted on the chart.
It moves up in an uptrend or down in a downtrend, trailing the price.
When price touches or crosses the SAR value, the trend is considered to be reversing.
The acceleration factor
Often written as AF, this value controls how quickly the SAR catches up to price.
It starts at a default of 0.02 and increases by 0.02 each time a new high or low is made.
It can rise up to a maximum value of 0.20, depending on the strength of the trend.
This causes the SAR to speed up as a trend gains momentum.
The extreme point
This refers to the highest price reached during an uptrend or the lowest price during a downtrend.
The SAR adjusts closer to price using this extreme value as a reference.
This helps the indicator lock in more of the trend as price pushes further in one direction.
Calculations of Parabolic SAR
The calculation behind Parabolic SAR is simple in structure but dynamic in behavior. Once you understand how the indicator updates with each new bar, you’ll get a better sense of how it trails price and signals reversals.
The formula
For an uptrend - SARnext = SARcurrent + AF × (EP − SARcurrent)
For a downtrend - SARnext = SARcurrent − AF × (SARcurrent − EP)
Where
SAR is the current stop and reverse value.
AF is the acceleration factor (starting at 0.02 and increasing up to 0.20).
EP is the extreme price point (highest high in an uptrend, lowest low in a downtrend).
What makes it dynamic
As the price makes new highs or lows, the EP updates, and the AF increases.
This causes the SAR to move closer to price over time, locking in gains.
When price crosses the SAR, a reversal is signaled and the trend direction flips.
How to set up Parabolic SAR
Parabolic SAR is easy to apply and doesn't require multiple inputs or complex setups. It is available on almost every charting platform and is especially useful for traders who want a clean, visual way to track trends and manage exits. Once added to your chart, it automatically plots a series of dots based on current trend conditions.
Access the indicator
Getting started with Parabolic SAR takes just a few clicks.
Where to find it
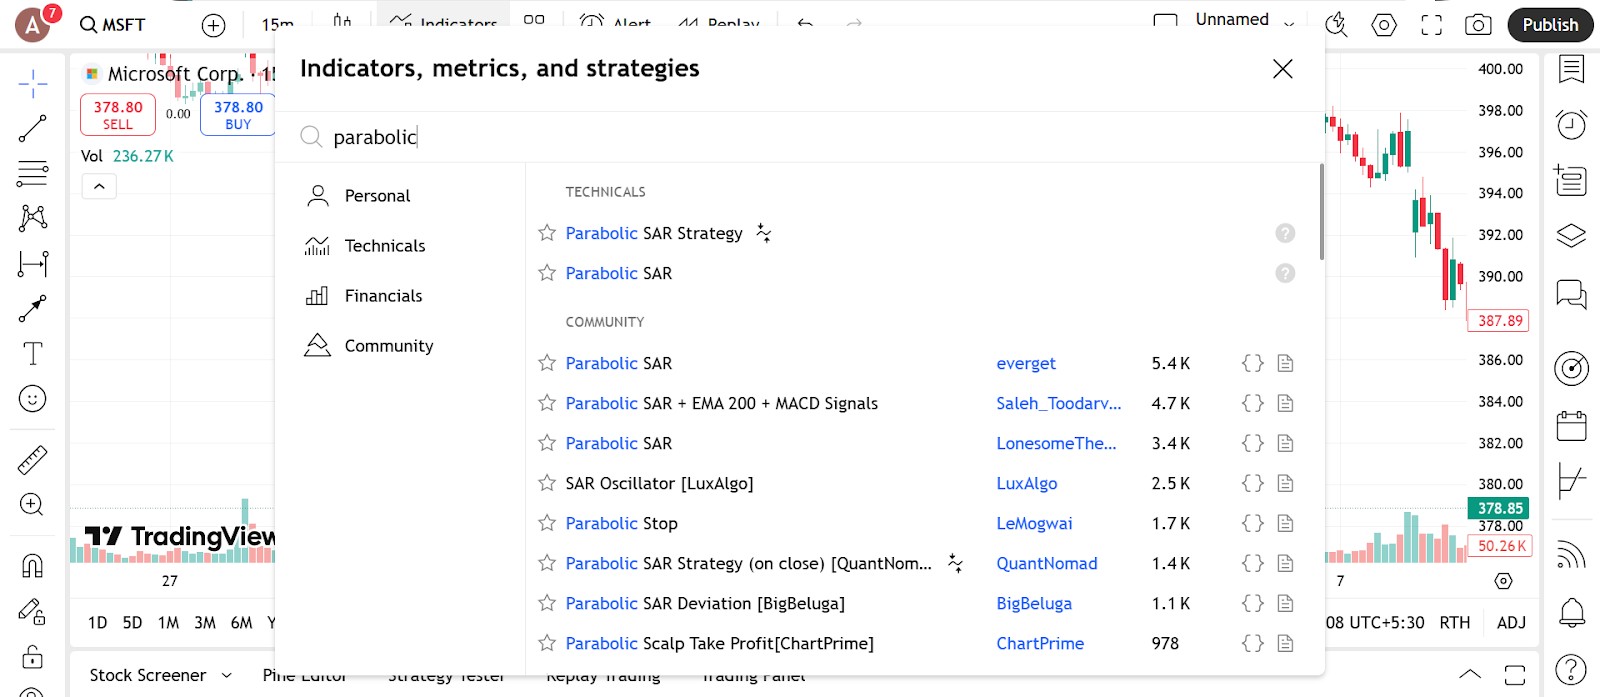
Open your platform’s indicator list.
Type in Parabolic SAR or SAR in the search bar.
Click on it to apply the indicator to your chart.
Compatible platforms
Available by default on TradingView, MetaTrader, ThinkorSwim, NinjaTrader, and most other major platforms.
It appears as a series of dots — above price in a downtrend and below price in an uptrend.
Setup tips
Use it on trending assets where price moves cleanly in one direction.
Combine with other trend indicators like moving averages or ADX for stronger setups.
Configure the parameters
Parabolic SAR uses only two key settings — making it easy to adjust without overcomplicating things.
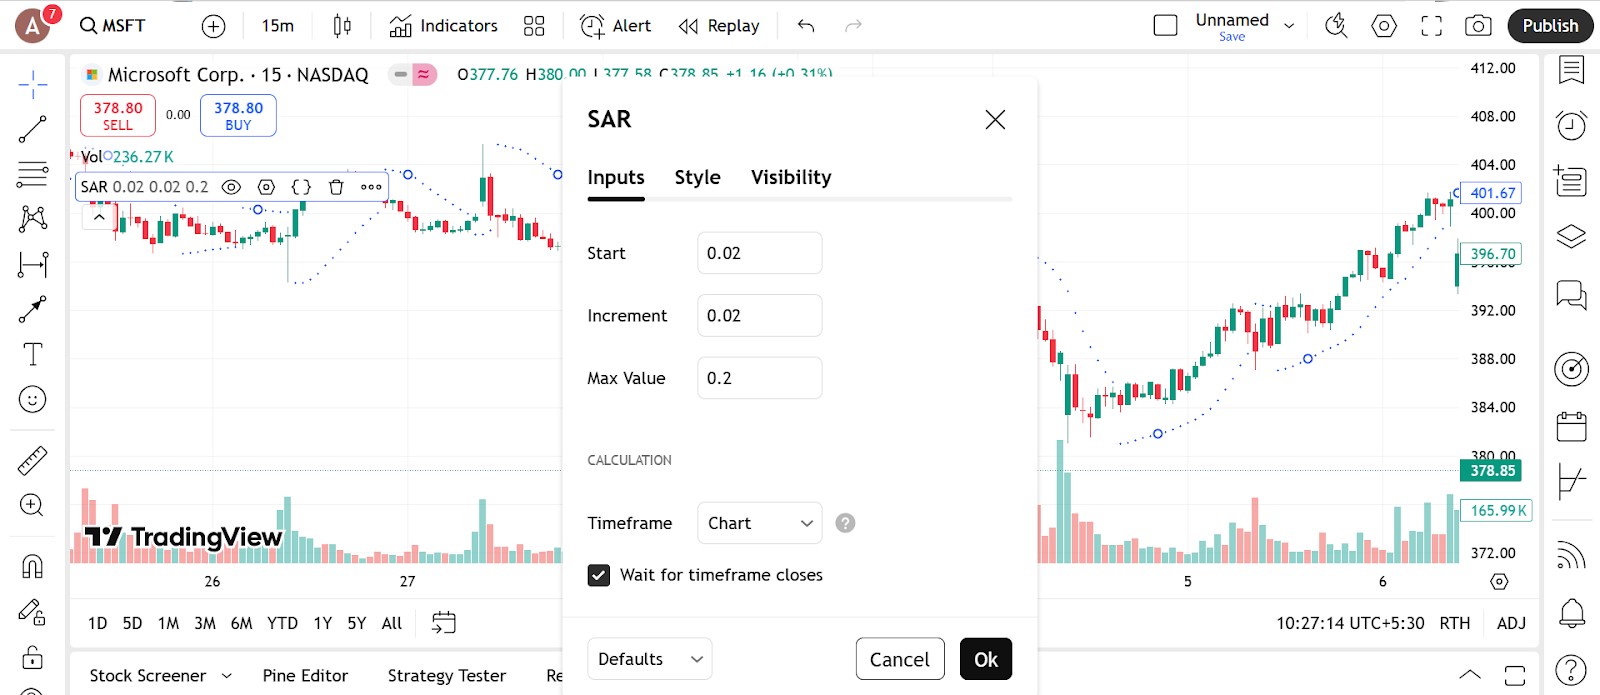
Acceleration factor
Default value is 0.02
This controls how fast the dots move with the price.Increases with each new high or low
The default setting increases by 0.02 each time price extends in the trend direction.Can go up to 0.20 by default
This maximum value keeps the stop from getting too close during fast trends.
Step and maximum values
You can manually change both the step (starting acceleration) and maximum (limit for acceleration).
For more sensitive stops, use a higher step like 0.03 or 0.04.
For slower-moving stops, use a lower step like 0.01.
Keep the maximum value balanced — higher means quicker trailing, but also more chance of early stopouts.
Visual adjustments
Change the dot size or color so they’re clearly visible on your chart.
Use a contrasting color for the dots against your background for better visibility.
Some platforms let you thicken the dots or add alerts when price crosses them.
Trading strategies using Parabolic SAR
Parabolic SAR works best when the market is trending — either clearly up or clearly down. Its main strength is helping you know when to stay in a trade and when to consider getting out. While it is not a standalone entry signal for every market condition, it becomes a powerful tool when combined with other indicators or price patterns.
Ride the trend with SAR signals
One of the most straightforward ways to use Parabolic SAR is to follow the trend and exit when the dots flip.
How it works
When the dots are below the price, the trend is considered up.
When the dots flip above the price, it suggests a downtrend may be starting.
You stay in the trade as long as the dots stay on the same side of the price.
Entry and exit
Enter a long position when the dots move below the price after a downtrend.
Close the position or reverse when the dots flip to the opposite side.
Works best when price is clearly trending, not ranging.
Helpful tips
Use on timeframes where trends are smoother — like the one hour or four hour chart.
Combine with a moving average to confirm the direction of the trend.
Combine with moving averages
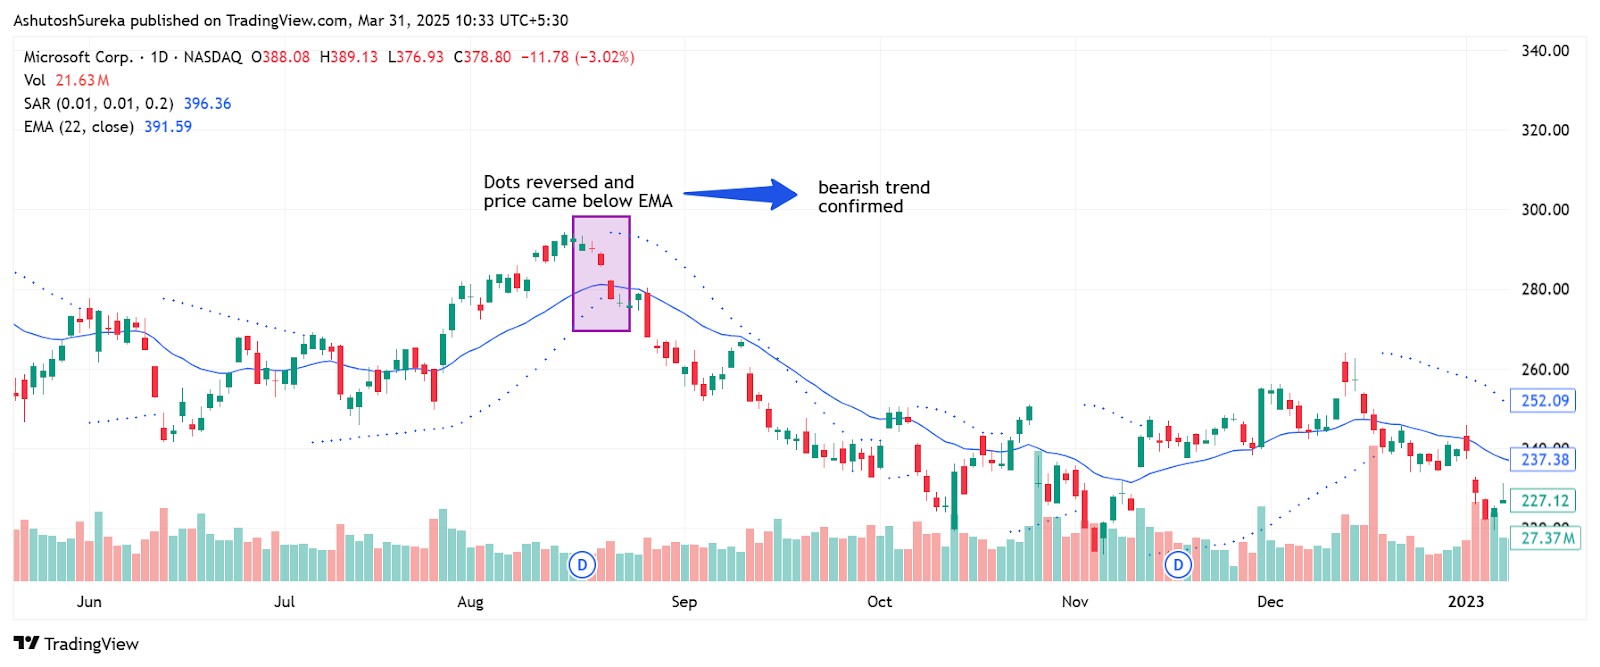
Parabolic SAR can be paired with a simple moving average (SMA) or exponential moving average (EMA) to filter out false signals and improve accuracy.
Strategy setup
Use a 20 period EMA as your trend filter.
Only take buy signals when price is above the EMA and SAR dots appear below price.
Only take sell signals when price is below the EMA and SAR dots appear above price.
Trade management
Exit when the SAR dots flip to the opposite side.
You can also move your stop just under or over the most recent SAR dot to lock in profits.
Use SAR for trailing stop placement
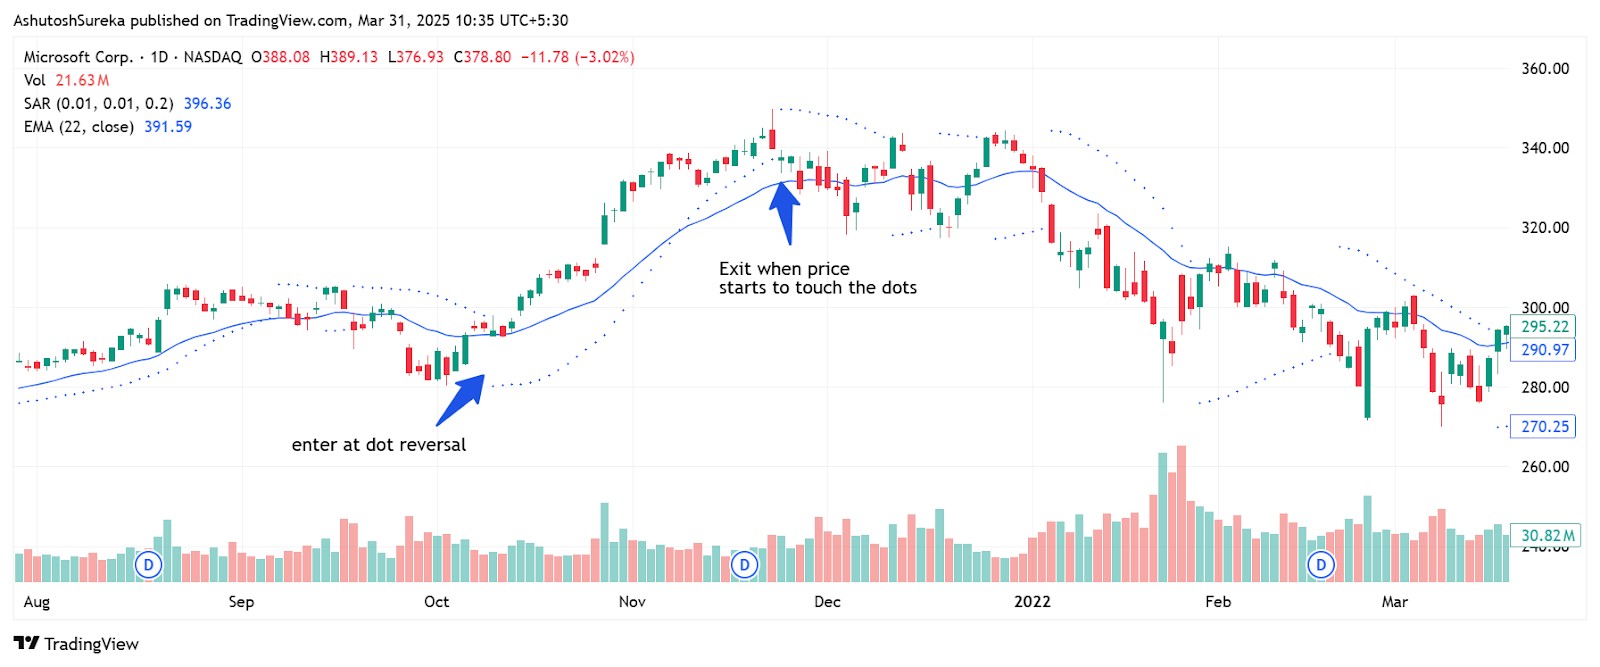
Many traders use Parabolic SAR not for entry, but as a trailing stop to manage active positions.
How to apply it
After entering a trade using another method, apply Parabolic SAR.
Use the dots as your dynamic stop-loss level.
If price touches a SAR dot, exit the trade or close a portion.
Why this works
It tightens the stop as the trend gains momentum.
It gives trades room to move early on but closes the gap as price moves in your favor.
This helps protect profits without needing to adjust your stop manually.
If your trading strategy requires the use of many technical indicators, using a broker that supports TradingView, MT5, or cTrader can make your life easier. These tools provide access to a wide range of technical tools, covering almost all the strategies you can think of. In the table below, we have presented the top brokers with access to the abovementioned platforms. You can compare them and choose the best one for yourself:
| Currency pairs | Crypto | Stocks | Min. deposit, $ | Max. leverage | TradingView | MT5 | cTrader | Regulation | TU overall score | Open an account | |
|---|---|---|---|---|---|---|---|---|---|---|---|
| 60 | Yes | Yes | 100 | 1:300 | Yes | No | No | FCA, CySEC, MAS, ASIC, FMA, FSA (Seychelles) | 6.83 | Open an account Your capital is at risk. |
|
| 90 | Yes | Yes | No | 1:500 | Yes | Yes | Yes | ASIC, FCA, DFSA, BaFin, CMA, SCB, CySec | 7.17 | Open an account Your capital is at risk.
|
|
| 68 | Yes | Yes | No | 1:200 | Yes | Yes | No | FSC (BVI), ASIC, IIROC, FCA, CFTC, NFA | 6.8 | Open an account Your capital is at risk. |
|
| 80 | Yes | Yes | 100 | 1:50 | Yes | Yes | No | CIMA, FCA, FSA (Japan), NFA, IIROC, ASIC, CFTC | 6.95 | Study review | |
| 100 | Yes | Yes | No | 1:30 | Yes | No | No | SEC, FINRA, SIPC, FCA, NSE, BSE, SEBI, SEHK, HKFE, IIROC, ASIC, CFTC, NFA | 6.9 | Open an account Your capital is at risk. |
Why trust us
We at Traders Union have analyzed financial markets for over 14 years, evaluating brokers based on 250+ transparent criteria, including security, regulation, and trading conditions. Our expert team of over 50 professionals regularly updates a Watch List of 500+ brokers to provide users with data-driven insights. While our research is based on objective data, we encourage users to perform independent due diligence and consult official regulatory sources before making any financial decisions.
Learn more about our methodology and editorial policies.
Advantages and limitations of Parabolic SAR
Parabolic SAR is one of the simplest trend-following tools you can use, especially if you like a visual, rule-based system. It clearly shows when to stay in a trade and when a trend might be reversing. Still, it has its drawbacks — particularly in sideways or choppy markets where its signals can become unreliable. Here's where it performs well and where you should be cautious.
Advantages of Parabolic SAR
Parabolic SAR is valued for its clarity, simplicity, and automatic trade management.
Easy to understand and apply
Plots directly on price with no complicated settings.
Dots flip sides to show possible trend reversals.
No extra indicators needed for basic trade decisions.
Helps manage trades automatically
Can act as a dynamic stop-loss that trails price.
Adjusts as price moves, helping lock in profits without needing constant manual updates.
Works well as a trade management tool in trending markets.
Provides quick visual signals
When the dots flip, it gives a clear exit or entry point.
Allows traders to stick to rules without second guessing.
Keeps chart clutter to a minimum.
Works well in strong trends
In markets with clear direction, SAR keeps traders on the right side of the move.
Reacts faster than many lagging indicators.
Helps capture the bulk of a trend without needing constant analysis.
Limitations of Parabolic SAR
Despite its strengths, Parabolic SAR has several limitations that traders should be aware of.
Struggles in sideways markets
In ranging or choppy conditions, SAR tends to flip back and forth frequently.
This creates false signals and unnecessary stop-outs.
Best used only when a clear trend is present.
Not ideal as a standalone tool
Does not confirm trend strength or filter out weak setups.
Needs to be combined with another indicator like a moving average, RSI, or ADX for better results.
Entry signals can be unreliable without confirmation.
Trailing stop may tighten too quickly
The acceleration factor can cause the dots to catch up to price too fast in volatile moves.
This can lead to early exits from trades that still have potential.
May require custom adjustment to suit your strategy.
Lags behind sharp reversals
Because it is trend-following, SAR can be slow to recognize sudden reversals.
It may flip too late in fast markets, costing valuable entry or exit opportunities.
Not suited for news-driven or highly reactive price moves.
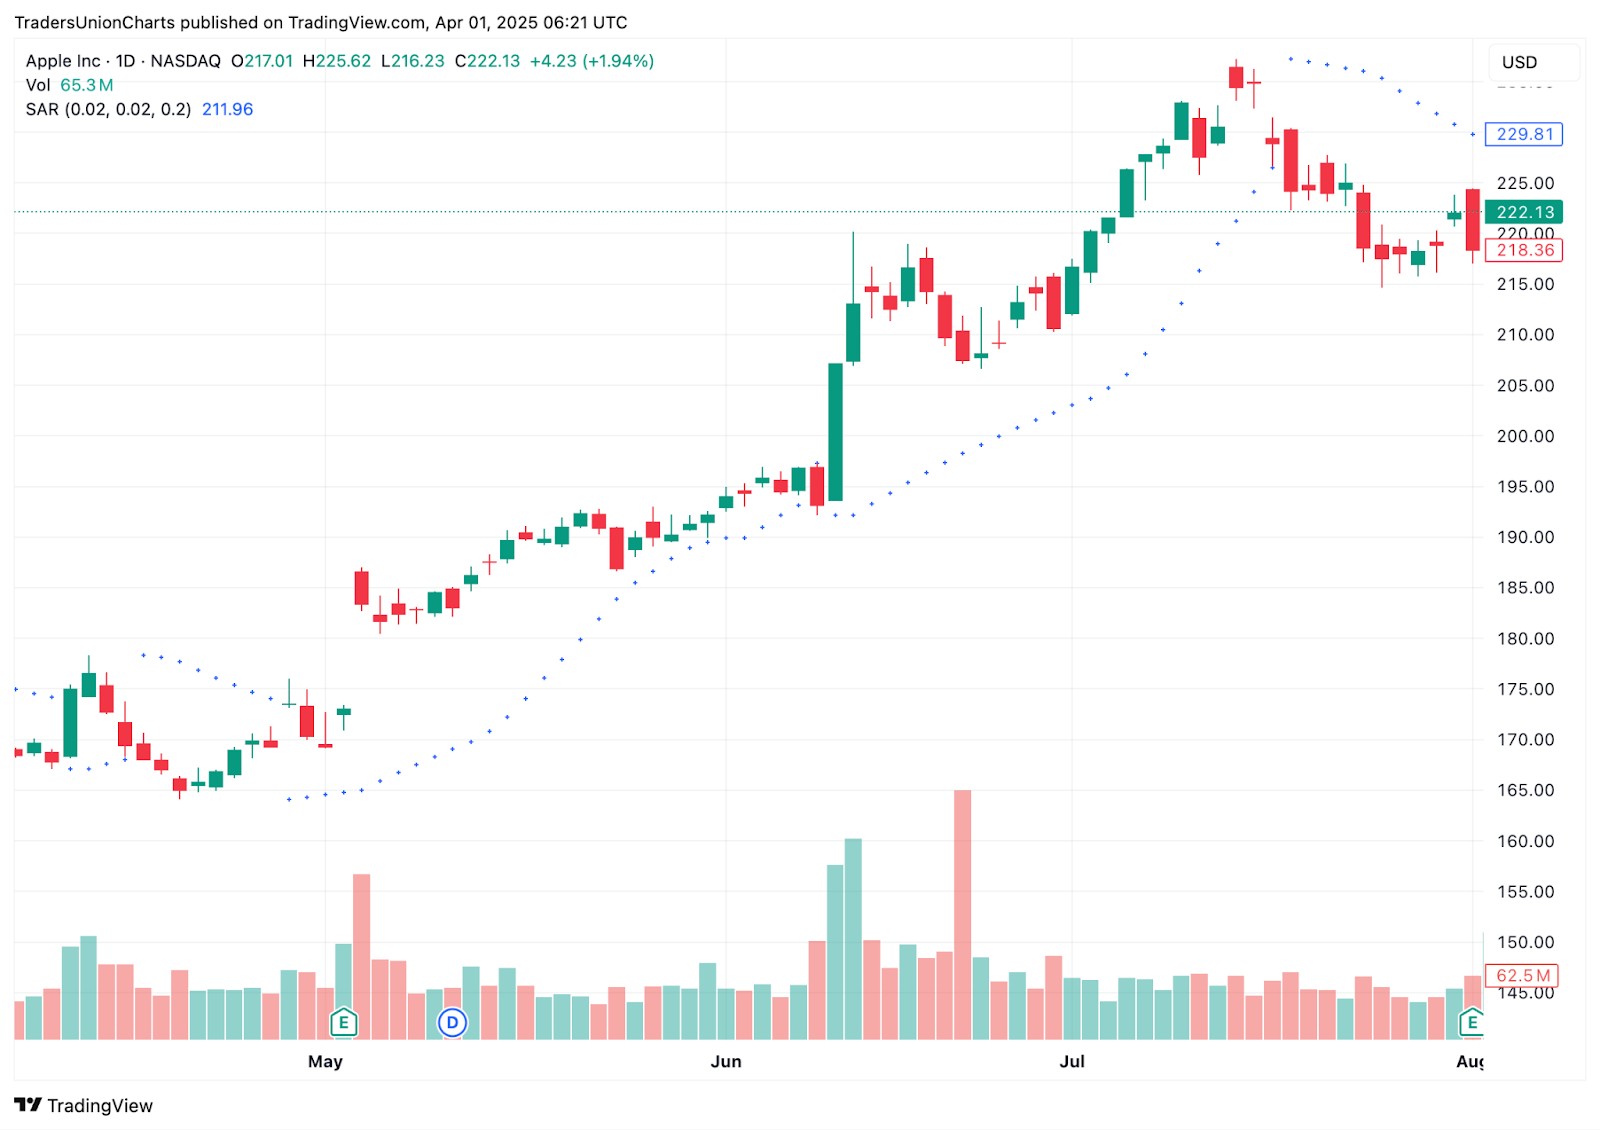
Start planning your exit when the indicator starts squeezing the price

Parabolic SAR is known as a trend tracker but that is just the surface. The real strength is how it reacts to how the move is heating up. Most traders leave the default setting and then wonder why the signals come too early or too late. Here is how to fix it. Use a slower setting for messy sideways charts and speed it up for clean strong moves. It is like driving. On a bumpy road you ease into it. On a smooth one you push a little harder. SAR is the same. You just have to match the setting to the feel of the trade.
You can also catch signs the move is slowing down before it actually turns. If price keeps rising but the SAR dots start getting closer instead of spreading out that is a red flag. Most people wait for the dots to flip. But if you watch how quickly the dots are catching up that is your clue the energy behind the move is wearing off. You do not need to wait for a reversal. Start planning your exit when the indicator stops giving price room to breathe. That is when the momentum is already cooling down.
Conclusion
Parabolic SAR is not just dots following the candles. It helps you read the tempo of the trade and shows you when a move is strong or just coasting. If you only use it to trail a stop you are not seeing what it is really trying to say. The way those dots spread out or tighten up tells you how much push is left in the move. Once you start matching the setting to how price behaves you will find it helps you know when to hold and when to step out. Not after the move ends but right before it starts to fade.
FAQs
Is Parabolic SAR leading or lagging?
Parabolic SAR is a lagging indicator because it relies on past price data to generate signals. It follows trends and helps identify potential reversal points rather than predicting them in advance.
What is the difference between Parabolic SAR and RSI?
Parabolic SAR is a trend-following indicator that provides entry and exit points based on price direction. RSI is a momentum indicator that measures the strength of price movements and identifies overbought or oversold conditions.
Can Parabolic SAR be used for all types of financial instruments?
Yes, Parabolic SAR can be used on stocks, Forex, commodities, and cryptocurrencies. It is especially effective in trending markets across various timeframes.
How accurate is Parabolic SAR?
Parabolic SAR can be accurate during strong trends but tends to give false signals in sideways or choppy markets. It works best when combined with other indicators for confirmation.
Related Articles
Team that worked on the article
Mikhail Vnuchkov joined Traders Union as an author in 2020. He began his professional career as a journalist-observer at a small online financial publication, where he covered global economic events and discussed their impact on the segment of financial investment, including investor income. With five years of experience in finance, Mikhail joined Traders Union team, where he is in charge of forming the pool of latest news for traders, who trade stocks, cryptocurrencies, Forex instruments and fixed income.
Chinmay Soni is a financial analyst with more than 5 years of experience in working with stocks, Forex, derivatives, and other assets. As a founder of a boutique research firm and an active researcher, he covers various industries and fields, providing insights backed by statistical data. He is also an educator in the field of finance and technology.
As an author for Traders Union, he contributes his deep analytical insights on various topics, taking into account various aspects.
Mirjan Hipolito is a journalist and news editor at Traders Union. She is an expert crypto writer with five years of experience in the financial markets. Her specialties are daily market news, price predictions, and Initial Coin Offerings (ICO).
A trading system is a set of rules and algorithms that a trader uses to make trading decisions. It can be based on fundamental analysis, technical analysis, or a combination of both.
Scalping in trading is a strategy where traders aim to make quick, small profits by executing numerous short-term trades within seconds or minutes, capitalizing on minor price fluctuations.
An investor is an individual, who invests money in an asset with the expectation that its value would appreciate in the future. The asset can be anything, including a bond, debenture, mutual fund, equity, gold, silver, exchange-traded funds (ETFs), and real-estate property.
ATR (Average True Range) is a volatility indicator that helps traders assess the potential price range or volatility of a financial instrument. It calculates the average of true price ranges over a specified period, providing insight into the level of price fluctuations within that timeframe.
Day trading involves buying and selling financial assets within the same trading day, with the goal of profiting from short-term price fluctuations, and positions are typically not held overnight.


-
 Afghanistan
-
 Albania
-
 Algeria
-
 Argentina
-
 Armenia
-
 Australia
-
 Austria
-
 Azerbaijan
-
 Bahamas
-
 Bahrain
-
 Bangladesh
-
 Belgium
-
 Botswana
-
 Brazil
-
 Brunei
-
 Bulgaria
-
 Burma
Burma
-
 Cambodia
-
 Cameroon
-
 Canada
-
 Chile
Chile
-
 China
China
-
 Colombia
-
 Costa Rica
-
 Cote d'Ivoire
-
 Croatia
-
 Cyprus
-
 Czech Republic
-
 Denmark
-
 Dominican Republic
-
 Ecuador
-
 Egypt
Egypt
-
 Estonia
-
 Eswatini
-
 Ethiopia
-
 Finland
-
 France
-
 Georgia
-
 Germany
-
 Ghana
Ghana
-
 Greece
-
 Haiti
Haiti
-
 Hong Kong
-
 Hungary
-
 India
India
-
 Indonesia
-
 Iran, Islamic republic
-
 Iraq
Iraq
-
 Ireland
-
 Israel
-
 Italy
Italy
-
 Jamaica
-
 Japan
Japan
-
 Jordan
-
 Kazakhstan
-
 Kenya
Kenya
-
 Korea
Korea
-
 Kuwait
-
 Kyrgyzstan
-
 Laos
Laos
-
 Latvia
-
 Lebanon
-
 Libyan Arab Jamahiriya
-
 Lithuania
-
 Luxembourg
-
 Macedonia
-
 Madagascar
-
 Malaysia
-
 Malta
Malta
-
 Mauritius
-
 Mexico
-
 Moldova
-
 Mongolia
-
 Montenegro
-
 Morocco
-
 Mozambique
-
 Namibia
-
 Nepal
Nepal
-
 Netherlands
-
 Nigeria
-
 Norway
-
 Oman
Oman
-
 Pakistan
-
 Palestine
-
 Papua New Guinea
-
 Peru
Peru
-
 Philippines
-
 Poland
-
 Portugal
-
 Puerto Rico
-
 Qatar
Qatar
-
 Romania
-
 Rwanda
-
 Saudi Arabia
-
 Serbia
-
 Singapore
-
 Slovakia
-
 Slovenia
-
 Somalia
-
 South Africa
-
 Spain
Spain
-
 Sri Lanka
-
 Sweden
-
 Switzerland
-
 Syrian Arab Republic
-
 Taiwan
-
 Tajikistan
-
 Tanzania, United Republic Of
-
 Thailand
-
 Trinidad and Tobago
-
 Tunisia
-
 Turkey
-
 UAE
UAE
-
 Uganda
-
 Ukraine
-
 United Kingdom
-
United States
-
 Uzbekistan
-
 Venezuela
-
 Vietnam
-
 Yemen
Yemen
-
 Zambia
-
 Zimbabwe
- Forex
- Crypto
