Double Exponential Moving Average (DEMA) – A Complete Guide


Editorial Note: While we adhere to strict Editorial Integrity, this post may contain references to products from our partners. Here's an explanation for How We Make Money. None of the data and information on this webpage constitutes investment advice according to our Disclaimer.
The Double Exponential Moving Average (DEMA) is a technical indicator that reacts faster to price changes than a standard moving average:
Formula calculation. Uses two EMAs for speed.
Trend identification. Helps spot trends early.
Lag reduction. Minimizes delays in signals.
Trading signals. Confirms buy and sell points.
Best use cases. Works well in fast markets.
Limitations. Can give false signals.
Moving averages help traders make sense of price movements by smoothing out fluctuations. While popular options like the Simple Moving Average (SMA) and Exponential Moving Average (EMA) are common, they often react slowly to price changes.
The Double Exponential Moving Average (DEMA) was created to fix this by reducing lag and making trends clearer. It does this by applying extra smoothing, helping traders react faster. This guide breaks down what DEMA is, how it works, and how to use it in real trades.
What is DEMA?

The Double Exponential Moving Average (DEMA) is more than just a smoother version of traditional moving averages — it’s designed to react faster without getting too jumpy. Standard moving averages, like SMA and EMA, often lag behind price changes, which can cause delays in spotting trends. DEMA fixes this by adding an extra layer of calculation, making it more responsive while still keeping the trend clear. This helps traders catch reversals and momentum shifts early, especially in fast-moving markets.
One of DEMA’s biggest strengths is how it keeps up with price action while filtering out unnecessary noise. Regular EMAs can sometimes be slow, leading to missed opportunities or late entries. DEMA moves quicker, making it great for traders who rely on precise timing, like those in crypto or high-frequency trading. It also helps avoid false breakouts that trick traders into bad trades, giving a clearer picture of where the market is headed.
But DEMA isn’t foolproof. Because it moves faster, it can sometimes give signals that are too early, especially when the market is choppy. That’s why many traders use it alongside tools like the RSI or MACD to confirm signals before making a move. When used the right way, DEMA can help traders react faster without being misled by short-term price swings.
DEMA formula & calculation
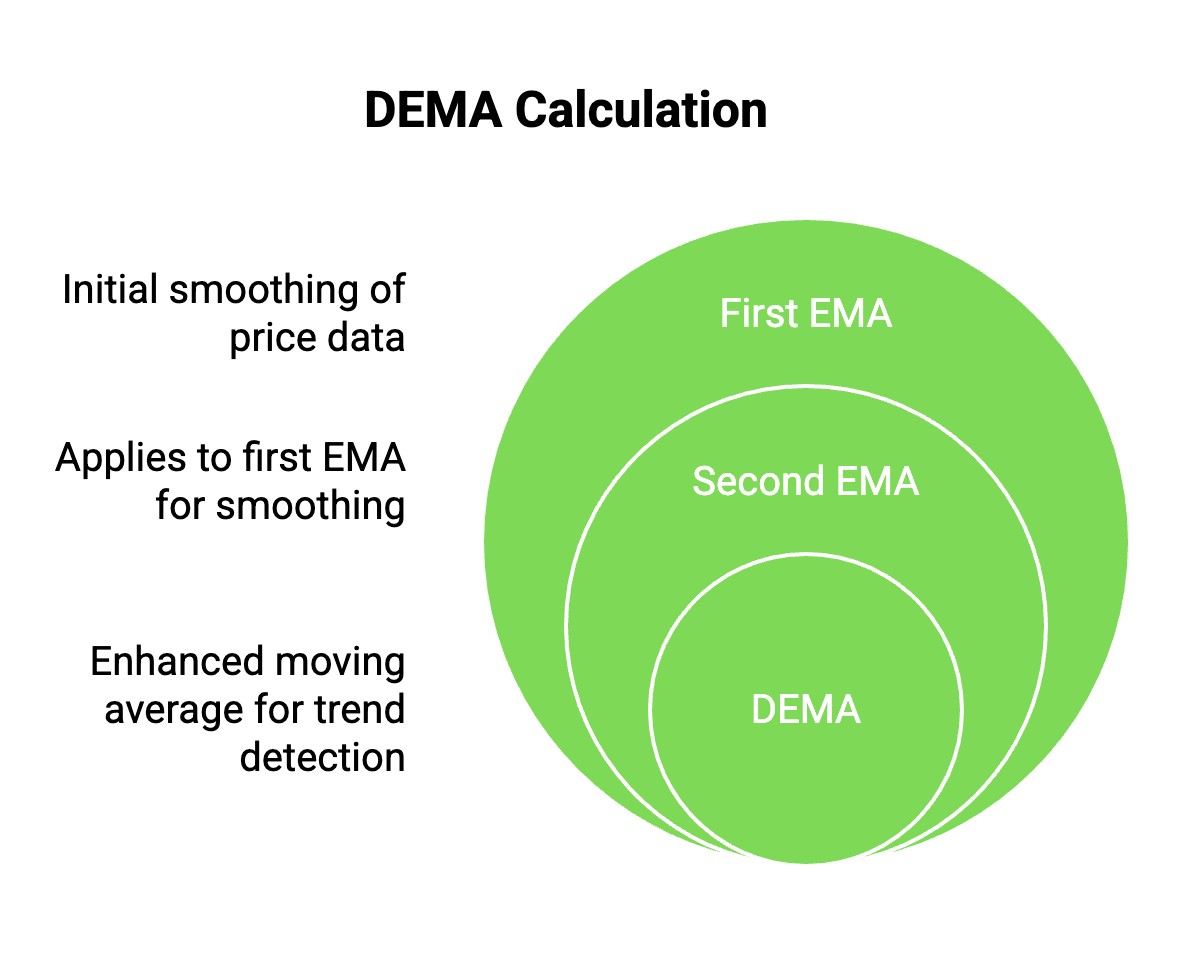
The Double Exponential Moving Average (DEMA) is calculated using a two-step smoothing process that makes it more responsive than traditional EMAs. First, you calculate the standard Exponential Moving Average (EMA) for a chosen period, such as 10 or 20 days. Then, instead of stopping there, you apply another EMA to the previously calculated EMA. This extra layer of smoothing helps reduce lag, allowing traders to see trend shifts earlier than they would with a regular EMA.
DEMA achieves this by weighting recent prices more heavily while still maintaining trend stability. Unlike a simple EMA, which applies a single smoothing factor, DEMA effectively speeds up signal detection by doubling the emphasis on price movements. This makes it particularly useful for fast-paced trading environments where quick decision-making is crucial.
To calculate DEMA, follow these steps:
Compute the EMA for your selected period.
Apply another EMA to the first EMA.
Use the final value to plot DEMA on your chart.
By doing this, traders get a moving average that adapts faster to price shifts while filtering out minor fluctuations.
How does DEMA work?
Unlike standard moving averages that smooth price movements over a fixed period, the Double Exponential Moving Average (DEMA) takes an advanced approach by using two layers of exponential smoothing. First, it calculates an Exponential Moving Average (EMA). Then, instead of just applying another EMA to the price, DEMA goes a step further by using the EMA of the first EMA. This method reduces lag significantly, making the indicator more reactive to price changes while still filtering out unnecessary noise.
What makes DEMA unique is its ability to maintain accuracy without excessive delay. Traditional moving averages tend to react late to price shifts, leading traders to enter or exit trades too slowly. DEMA speeds up this process, offering a more real-time representation of market trends. This is especially valuable in fast-moving assets like cryptocurrencies, where price swings can happen within seconds. A well-tuned DEMA can help traders avoid getting caught in outdated signals by reflecting price momentum more quickly than a standard EMA.
However, DEMA isn’t just a faster version of the EMA — it behaves differently based on market conditions. During strong trends, DEMA keeps traders in positions longer by maintaining its direction better than other moving averages. But in sideways or choppy markets, its sensitivity can become a double-edged sword, generating false signals. Understanding when to use DEMA is just as important as knowing how it works, and traders should always pair it with volume analysis or momentum indicators to confirm signals.
Best settings for DEMA

DEMA (Double Exponential Moving Average) is a powerful tool for traders, but the right settings depend on market conditions and strategy. Here are some settings that can give you an edge.
8-period for aggressive scalping. Works best in high-volatility assets, reacting faster than standard EMAs. Ideal for momentum-based scalping in crypto or Forex.
21-period for trend confirmation. Helps filter out noise and confirms whether a breakout has real strength before entering a trade.
34/55 cross for swing trades. Combining a 34-period and 55-period DEMA creates a smooth crossover system, useful for capturing medium-term trends.
100-period for strong reversals. On higher timeframes, this setting acts as a dynamic support/resistance level, signaling major reversals.
DEMA + ATR for volatility filters. Using an ATR-based filter with DEMA prevents false signals by ensuring trades only trigger when volatility is high.
These settings can be adjusted based on market conditions and personal preferences.
How to use the DEMA indicator in trading
Here’s how to use the DEMA indicator:
Filter out weak trend signals. DEMA moves faster than a simple or exponential moving average, so if price crosses it but lacks strong momentum, it’s often a false breakout. Wait for confirmation before acting.
Use DEMA slopes for trade timing. Instead of just watching crossovers, pay attention to the angle of the DEMA. A steeper slope means stronger momentum, helping you time entries better.
Combine with volume spikes. When a sharp DEMA move aligns with increased volume, it confirms a strong trend shift. Low volume during a DEMA crossover signals a weaker move.
Avoid whipsaws with a secondary MA. DEMA can react too quickly in choppy markets. Adding a slower-moving average, like the 50 EMA, helps filter out noise and avoid false trades.
Apply it to mean reversion setups. Many traders use DEMA for trend-following, but it also works for counter-trend strategies. When price strays too far from DEMA, a reversion trade can offer solid risk-reward.
DEMA vs. other moving averages
Here’s a comparison between DEMA and other moving averages:
DEMA vs. SMA
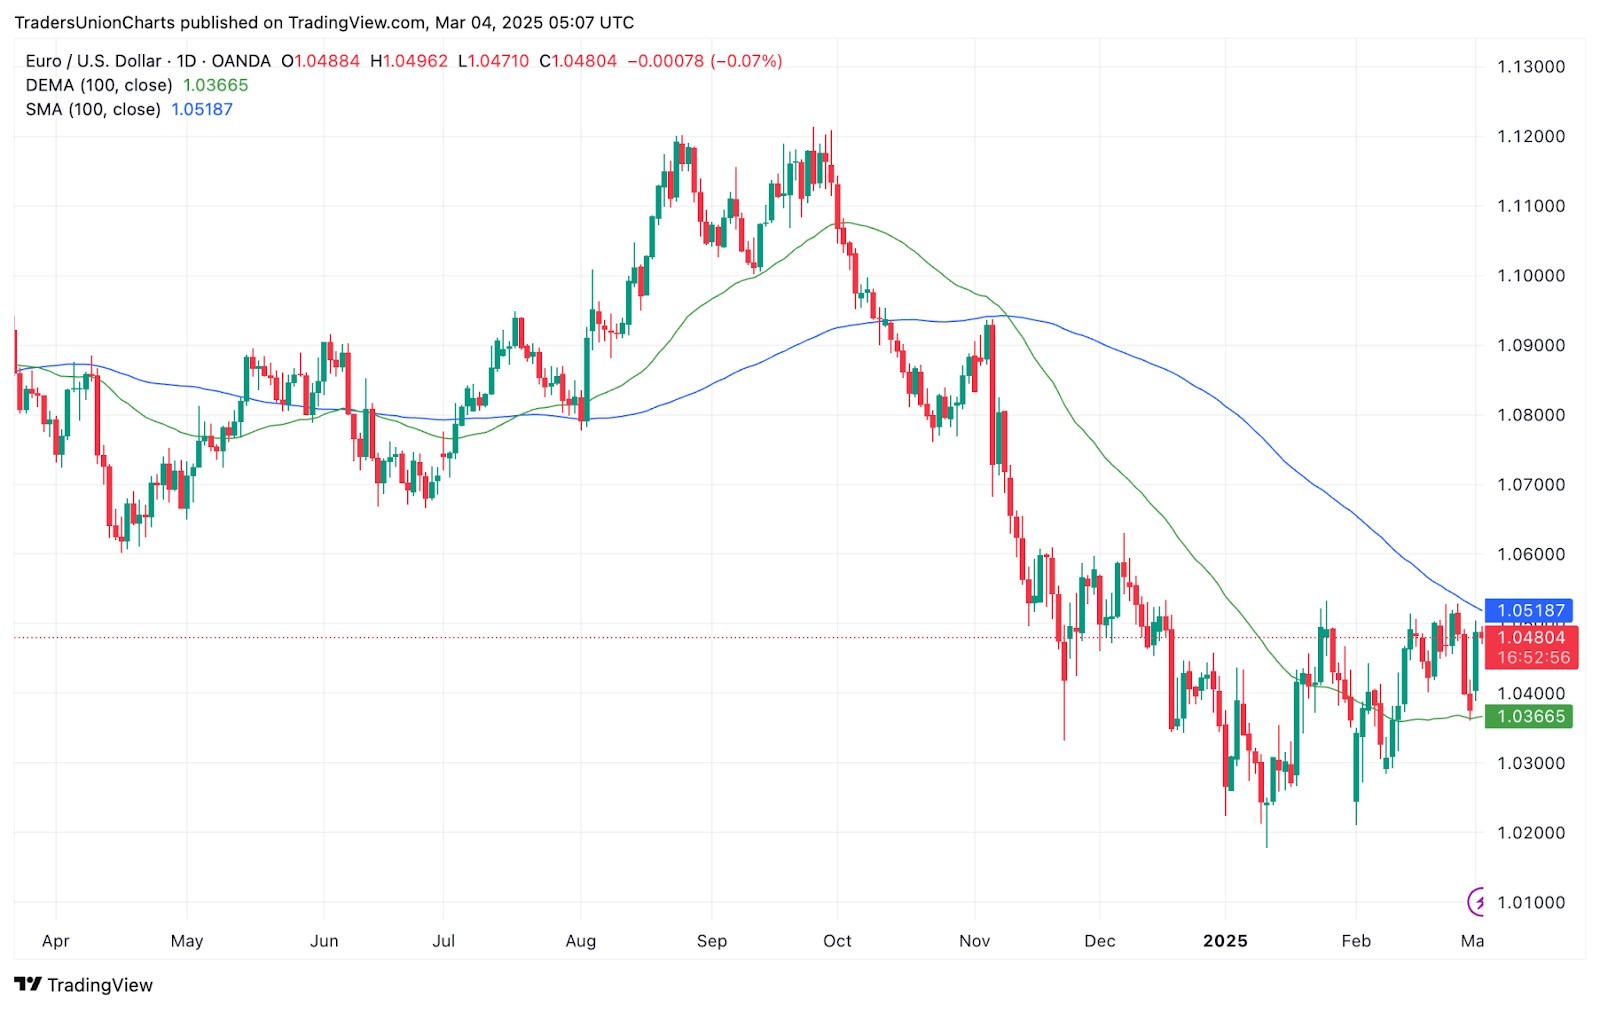
The simple moving average (SMA) tracks the average price over time, but it takes longer to reflect price moves. This delay makes it not ideal for traders who rely on fast signals.
In contrast, the double exponential moving average (DEMA) cuts down on delays by smoothing out price changes. So, DEMA reacts faster to price shifts, which makes it more useful for short-term traders.
DEMA vs. EMA
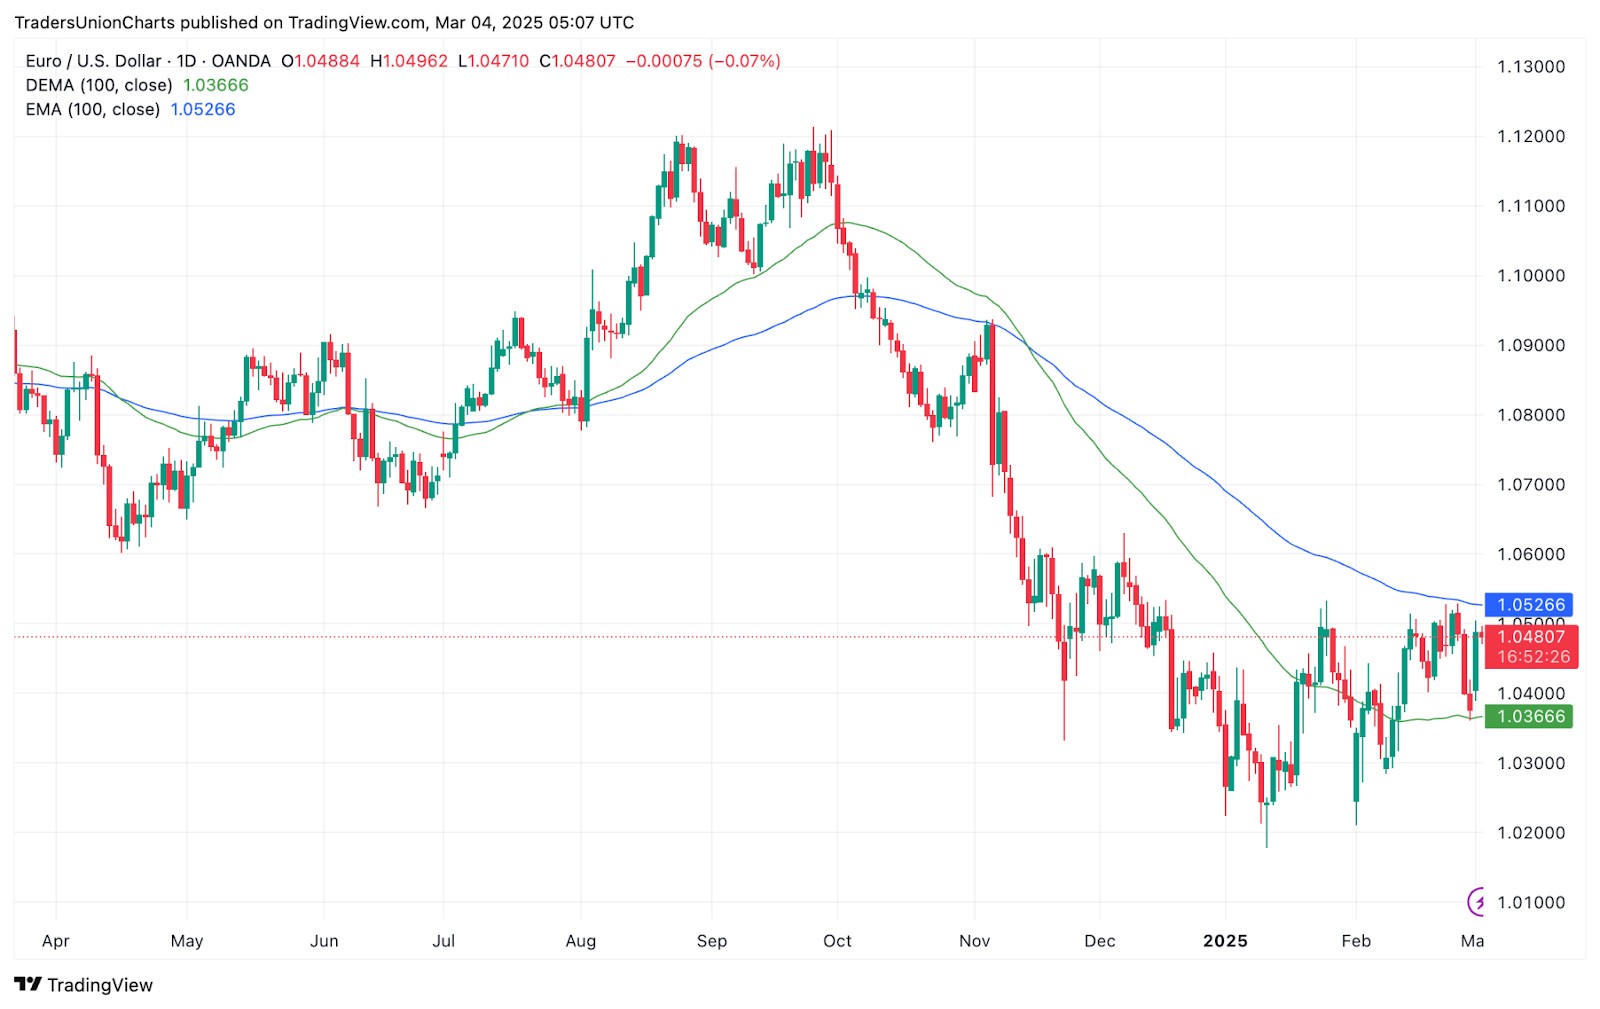
The exponential moving average (EMA) works better than SMA by focusing on recent prices, reacting quicker to price changes. While it cuts down on delays, it still struggles to keep up with fast-moving markets.
DEMA tweaks the formula to respond even faster, making it great for traders who need quick signals. It gives earlier trend signals and trade opportunities, helping traders act with more confidence.
DEMA vs. TEMA
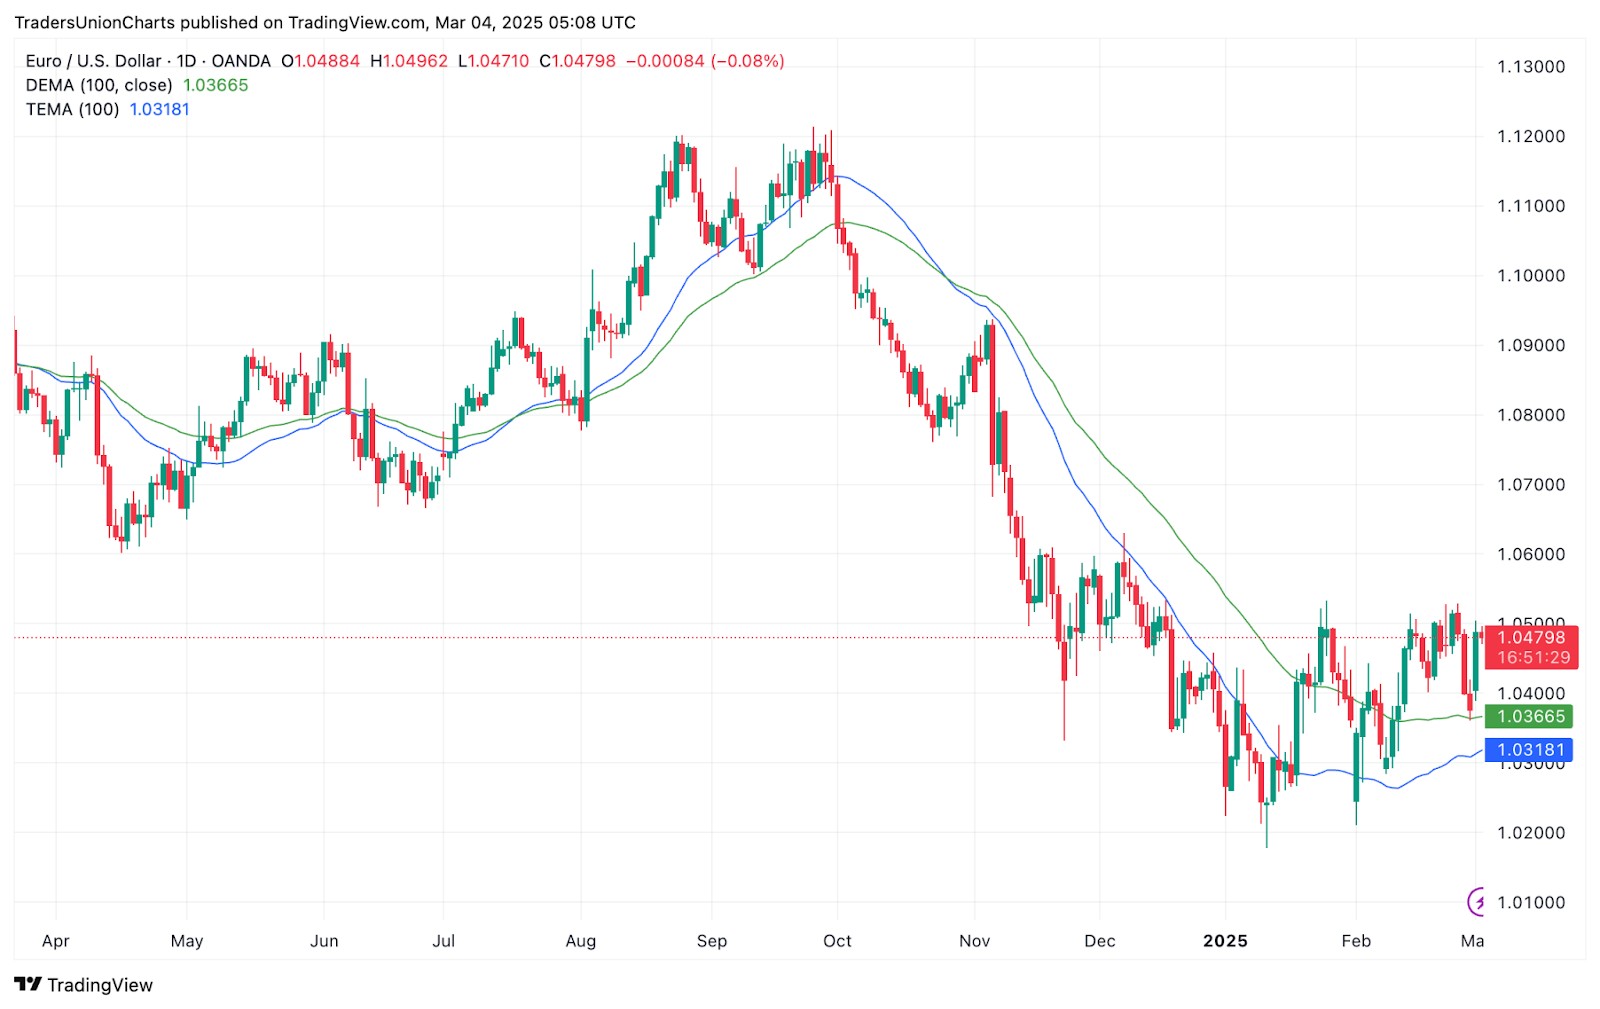
The triple exponential moving average (TEMA) expands on DEMA by smoothing price movements even more. It helps price react faster to trends with less delay. However, its speed can sometimes cause misleading signals in choppy markets. Most traders pair TEMA with other tools to avoid getting caught by fake moves.
DEMA example
The Double Exponential Moving Average (DEMA) is a powerful tool that reacts faster than traditional moving averages, making it useful for traders looking for quick signals. Here are some advanced ways to use it.
Catching fake breakouts early. DEMA responds faster than the standard EMA, helping traders spot false breakouts before price reverses. If a stock’s price crosses above DEMA but lacks volume support, it’s often a trap.
Pairing with RSI for sniper entries. Using DEMA with the Relative Strength Index (RSI) can pinpoint strong trade entries. When RSI is oversold and DEMA starts to slope upward, it’s an early buy signal before the trend gains momentum.
Fine-tuning stop-loss placement. Instead of placing stop-losses below swing lows, use the DEMA as a dynamic trailing stop. In volatile markets, this helps avoid premature stop-outs while still protecting capital.
Detecting trend exhaustion before reversals. If price moves too far above DEMA without a healthy retracement, it signals exhaustion. A sudden drop below DEMA after an extended uptrend often confirms a reversal is near.
Optimizing for different timeframes. Short-term traders use a 9-period DEMA for scalping, while swing traders prefer a 21-period DEMA for trend confirmation. Choosing the right setting based on market conditions improves accuracy.
Common mistakes when using DEMA
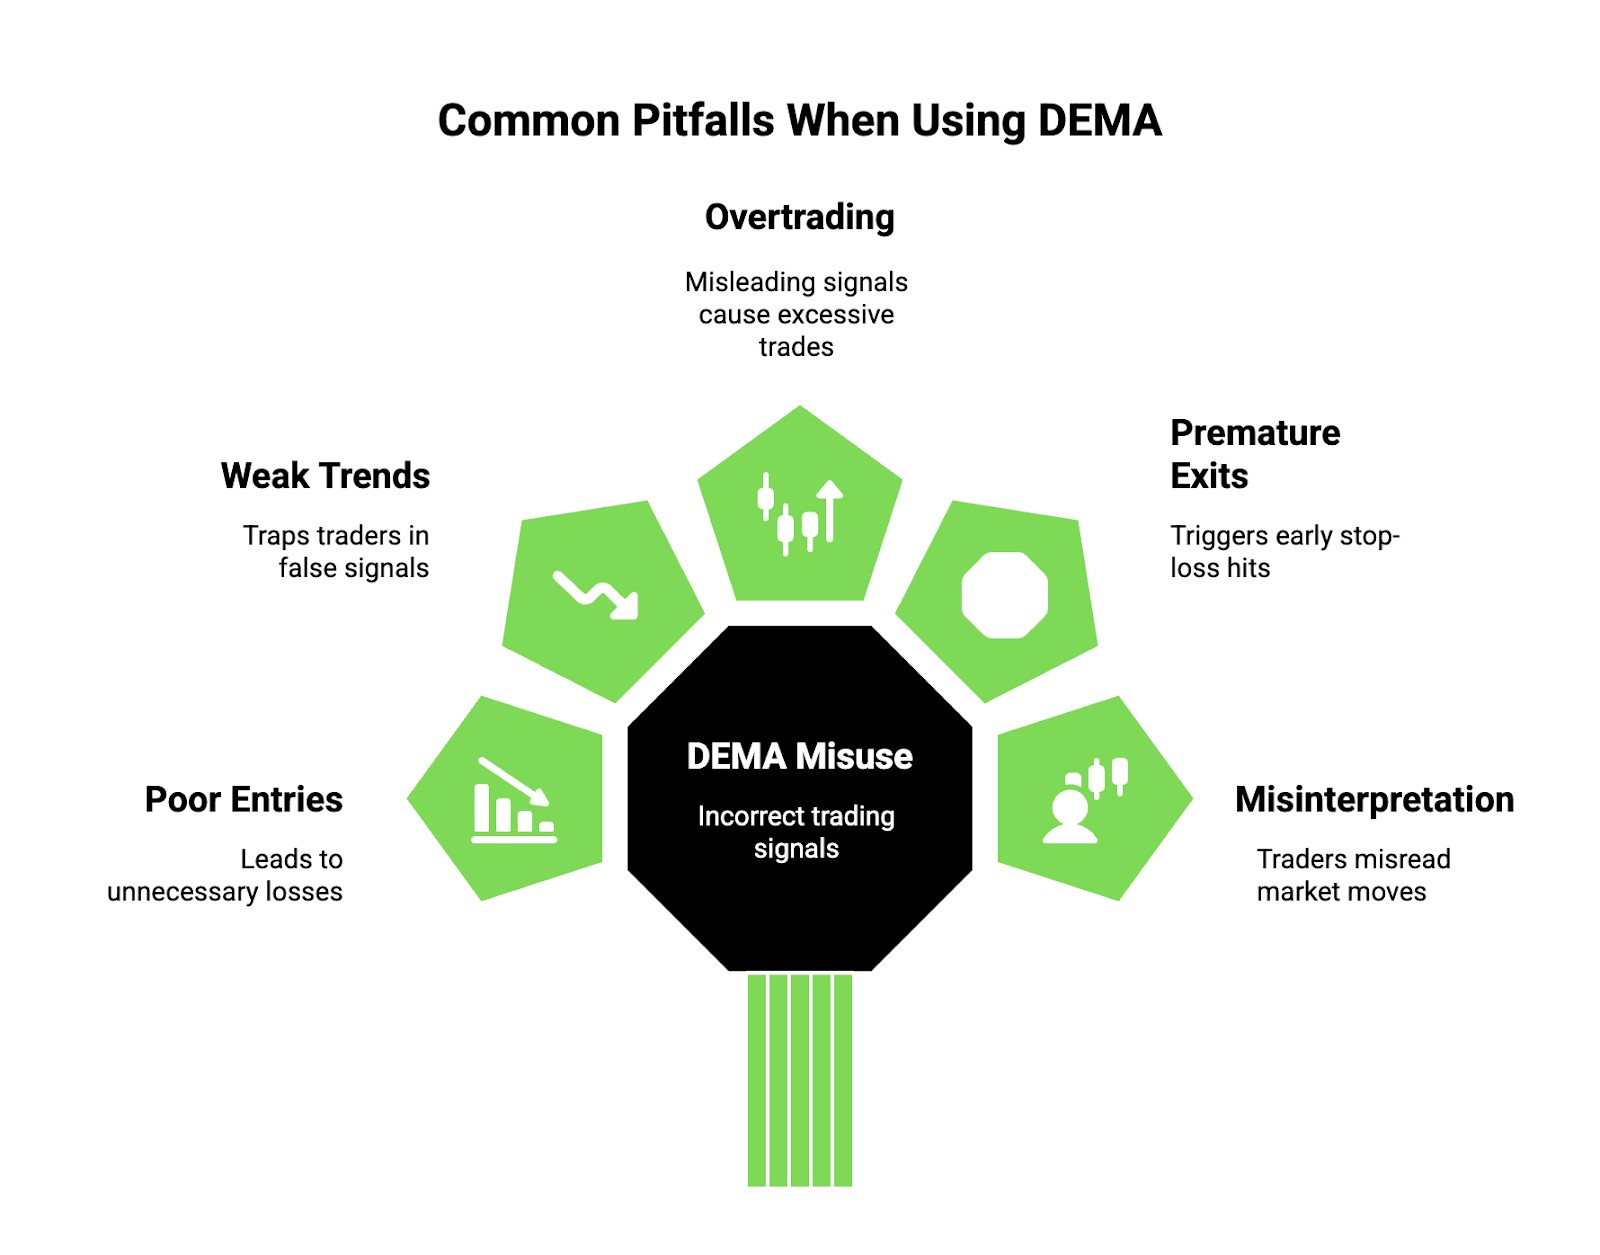
Many traders use the Double Exponential Moving Average (DEMA) incorrectly, leading to poor trade entries and exits. Here are some mistakes that can hurt your strategy.
Ignoring market conditions. DEMA reacts faster than standard moving averages, but that doesn't mean it works in all conditions. It's great for trending markets but generates too many false signals in choppy or sideways markets. If you're trading in a ranging market, relying on DEMA alone can lead to unnecessary losses.
Overlooking confirmation signals. Many beginners trust DEMA crossovers blindly, assuming every crossover is a trend shift. However, using it without confirmation from RSI, MACD, or price action can lead to entering weak trends. A bullish DEMA crossover without rising volume or a breakout candle is often a trap.
Using the wrong timeframe. DEMA works differently across timeframes, and using it on the wrong one can lead to misleading signals. On lower timeframes like 1-minute or 5-minute charts, it reacts too quickly, making traders overtrade. On higher timeframes like the daily chart, it may lag more than expected. Understanding the best timeframe for your strategy is key.
Forgetting stop-loss placement. Since DEMA reacts faster, it often triggers premature stop-loss hits when placed too close. Traders using tight stops without considering the average volatility of the asset get stopped out too soon, missing the real move. Always factor in ATR (Average True Range) before setting stops.
Misinterpreting strong moves. A sharp price move can push DEMA aggressively in one direction, making traders think it's the start of a new trend. But sometimes, these moves are just liquidity grabs or news-based spikes that reverse quickly. Always check if the price holds beyond key support or resistance before trusting DEMA signals.
Is DEMA a good indicator for trading?
Yes, DEMA works well for traders who want a fast-moving average because it cuts down on lag. It spots trends faster than standard moving averages, making it easier to catch early buy and sell signals.
However, because it's so sensitive, it can give false signals, especially in volatile or sideways markets. It doesn’t always work well on its own since it moves too fast sometimes, reacting to minor price changes that don’t matter.
To get better results, traders often mix DEMA with RSI or MACD. This helps avoid bad signals and confirm real trends, making it a smarter tool for trading.
We also recommend you to choose a broker that offers support for tools like DEMA. Here are some of the best brokers where you can use DEMA indicator for trading:
| Demo | Min. deposit, $ | TradingView | Standard EUR/USD spread, avg pips | Deposit fee, % | Withdrawal fee, % | Regulation level | TU overall score | Open an account | |
|---|---|---|---|---|---|---|---|---|---|
| Yes | $100 | Yes | 0,7 | No | No | Yes | 6.83 | Open an account Your capital is at risk. |
|
| Yes | $0 | Yes | 0,6 | No | No | Yes | 7.17 | Open an account Your capital is at risk.
|
|
| Yes | No | Yes | 0,3 | No | No | Yes | 6.8 | Open an account Your capital is at risk. |
|
| Yes | $1000 | Yes | 1,0 | No | No | Yes | 6.95 | Study review | |
| Yes | No | Yes | 0,5 | No | Yes | Yes | 6.9 | Open an account Your capital is at risk. |
Why trust us
We at Traders Union have analyzed financial markets for over 14 years, evaluating brokers based on 250+ transparent criteria, including security, regulation, and trading conditions. Our expert team of over 50 professionals regularly updates a Watch List of 500+ brokers to provide users with data-driven insights. While our research is based on objective data, we encourage users to perform independent due diligence and consult official regulatory sources before making any financial decisions.
Learn more about our methodology and editorial policies.
DEMA retests and change volatility-based settings improve trade entries

Many traders use DEMA to confirm trends but forget to look at the bigger picture. During strong trends, price often touches DEMA before continuing. Skilled traders wait for a bounce or rejection off DEMA before deciding their next move. Missing these small retests can mean skipping great trade setups, while letting emotions take over can lead to bad exits.
Many traders keep tweaking DEMA settings, hoping to find the perfect setup. But markets change all the time, so there’s no magic setting. A smarter way is to adjust DEMA based on how volatile the market is. A 14-period DEMA might work for Bitcoin when it’s moving fast, but a 28-period could be better when it slows down. Instead of sticking to one setting, tweak DEMA as the market shifts.
Conclusion
DEMA is a powerful tool that improves on traditional moving averages by reducing lag and increasing responsiveness. Whether used alone or in combination with other indicators, it can help traders make informed decisions. Understanding its strengths and limitations is key to using it effectively.
FAQs
Can DEMA be used for all time frames?
Yes, DEMA works across all time frames, from intraday to long-term charts. However, traders should adjust the period settings based on their strategy. Shorter settings suit scalping, while longer ones fit swing trading.
Does DEMA work best alone or with other indicators?
DEMA performs best when combined with indicators like RSI, MACD, or Bollinger Bands. These help confirm signals and filter out market noise. Relying solely on DEMA may lead to false signals in choppy conditions.
What is the best DEMA setting for day trading?
A 10-period DEMA is commonly used for day trading due to its quick response. It helps traders catch short-term trends and momentum shifts. However, settings can vary based on volatility and asset type.
Can DEMA help in avoiding false signals?
While DEMA reduces lag, it can still generate false signals in volatile markets. Using additional indicators like volume or trend confirmation tools helps improve accuracy. Proper risk management is also essential.
Related Articles
Team that worked on the article
Alamin Morshed is a contributor at Traders Union. He specializes in writing articles for businesses that want to improve their Google search rankings to compete with their competition. With expertise in search engine optimization (SEO) and content marketing, he ensures his work is both informative and impactful.
Chinmay Soni is a financial analyst with more than 5 years of experience in working with stocks, Forex, derivatives, and other assets. As a founder of a boutique research firm and an active researcher, he covers various industries and fields, providing insights backed by statistical data. He is also an educator in the field of finance and technology.
As an author for Traders Union, he contributes his deep analytical insights on various topics, taking into account various aspects.
Mirjan Hipolito is a journalist and news editor at Traders Union. She is an expert crypto writer with five years of experience in the financial markets. Her specialties are daily market news, price predictions, and Initial Coin Offerings (ICO).
A Trailing Stop Order is a type of order that automatically adjusts the stop-loss level as the market price moves in a favorable direction, helping to protect profits.
Swing trading is a trading strategy that involves holding positions in financial assets, such as stocks or forex, for several days to weeks, aiming to profit from short- to medium-term price swings or "swings" in the market. Swing traders typically use technical and fundamental analysis to identify potential entry and exit points.
Cryptocurrency is a type of digital or virtual currency that relies on cryptography for security. Unlike traditional currencies issued by governments (fiat currencies), cryptocurrencies operate on decentralized networks, typically based on blockchain technology.
Scalping in trading is a strategy where traders aim to make quick, small profits by executing numerous short-term trades within seconds or minutes, capitalizing on minor price fluctuations.
Price action trading is a trading strategy that relies primarily on the analysis of historical price movements and patterns in financial markets, such as stocks, currencies, or commodities. Traders who use this approach focus on studying price charts, candlestick patterns, support and resistance levels, and other price-related data to make trading decisions.


-
 Afghanistan
-
 Albania
-
 Algeria
-
 Argentina
-
 Armenia
-
 Australia
-
 Austria
-
 Azerbaijan
-
 Bahamas
-
 Bahrain
-
 Bangladesh
-
 Belgium
-
 Botswana
-
 Brazil
-
 Brunei
-
 Bulgaria
-
 Burma
Burma
-
 Cambodia
-
 Cameroon
-
 Canada
-
 Chile
Chile
-
 China
China
-
 Colombia
-
 Costa Rica
-
 Cote d'Ivoire
-
 Croatia
-
 Cyprus
-
 Czech Republic
-
 Denmark
-
 Dominican Republic
-
 Ecuador
-
 Egypt
Egypt
-
 Estonia
-
 Eswatini
-
 Ethiopia
-
 Finland
-
 France
-
 Georgia
-
 Germany
-
 Ghana
Ghana
-
 Greece
-
 Haiti
Haiti
-
 Hong Kong
-
 Hungary
-
 India
India
-
 Indonesia
-
 Iran, Islamic republic
-
 Iraq
Iraq
-
 Ireland
-
 Israel
-
 Italy
Italy
-
 Jamaica
-
 Japan
Japan
-
 Jordan
-
 Kazakhstan
-
 Kenya
Kenya
-
 Korea
Korea
-
 Kuwait
-
 Kyrgyzstan
-
 Laos
Laos
-
 Latvia
-
 Lebanon
-
 Libyan Arab Jamahiriya
-
 Lithuania
-
 Luxembourg
-
 Macedonia
-
 Madagascar
-
 Malaysia
-
 Malta
Malta
-
 Mauritius
-
 Mexico
-
 Moldova
-
 Mongolia
-
 Montenegro
-
 Morocco
-
 Mozambique
-
 Namibia
-
 Nepal
Nepal
-
 Netherlands
-
 Nigeria
-
 Norway
-
 Oman
Oman
-
 Pakistan
-
 Palestine
-
 Papua New Guinea
-
 Peru
Peru
-
 Philippines
-
 Poland
-
 Portugal
-
 Puerto Rico
-
 Qatar
Qatar
-
 Romania
-
 Rwanda
-
 Saudi Arabia
-
 Serbia
-
 Singapore
-
 Slovakia
-
 Slovenia
-
 Somalia
-
 South Africa
-
 Spain
Spain
-
 Sri Lanka
-
 Sweden
-
 Switzerland
-
 Syrian Arab Republic
-
 Taiwan
-
 Tajikistan
-
 Tanzania, United Republic Of
-
 Thailand
-
 Trinidad and Tobago
-
 Tunisia
-
 Turkey
-
 UAE
UAE
-
 Uganda
-
 Ukraine
-
 United Kingdom
-
United States
-
 Uzbekistan
-
 Venezuela
-
 Vietnam
-
 Yemen
Yemen
-
 Zambia
-
 Zimbabwe
- Forex
- Crypto
