How To Use Hull Moving Average


Editorial Note: While we adhere to strict Editorial Integrity, this post may contain references to products from our partners. Here's an explanation for How We Make Money. None of the data and information on this webpage constitutes investment advice according to our Disclaimer.
The Hull Moving Average (HMA) is a fast-reacting, smooth indicator that helps traders time entries and exits by tracking momentum shifts — not just trend direction. Unlike traditional moving averages, it reduces lag while avoiding choppy signals, making it ideal for identifying when a trend is gaining or losing speed across all timeframes.
Many traders rely on moving averages to spot trends, but common indicators like the SMA or EMA often react slowly to price changes. The Hull Moving Average (HMA) was developed to reduce this lag while keeping the line smooth and easy to read. It’s useful for identifying trend direction more quickly and can be applied to various trading styles. In this article, you’ll find a simple explanation of how the HMA works and how to start using it in your own strategy.
What is Hull Moving Average
The Hull Moving Average is a weighted moving average (WMA) that enhances the responsiveness of traditional MAs by using a mathematical approach to smooth out price fluctuations without introducing significant lag. Unlike simple moving averages (SMA) or exponential moving averages (EMA), the HMA reacts more quickly to price changes, allowing traders to identify trend shifts earlier.
Most traders throw on moving averages out of habit, but the Hull Moving Average (HMA) deserves more attention. It’s designed to respond quickly to price changes without the usual noise that comes with traditional MAs. When the market moves sharply, HMA adjusts fast — making it one of the few indicators that can keep pace with momentum. But here’s the catch: most traders misuse it. They treat it like a basic trend line, when its real strength is in showing how quickly a trend is gaining or losing steam. If you use it like any other moving average, you’re missing the point.
Why traders prefer Hull moving average
Cuts down on lag
Unlike the Simple Moving Average (SMA) or Exponential Moving Average (EMA), the HMA reacts more quickly to price changes, helping traders stay more in sync with the market.Balances speed and clarity
While it responds fast, it doesn’t create the choppy or noisy signals that some fast indicators do, which helps traders focus on meaningful trends.Works across multiple timeframes
Whether you're watching the market minute by minute or reviewing daily charts, the HMA adapts well and stays relevant.
How it’s used in practice
Spotting market direction
The HMA line helps traders quickly understand if the market is trending up, down, or moving sideways.Timing trades
Some traders enter a position when the price crosses above or below the HMA, or when its slope clearly changes direction.Avoiding unclear setups
When used with other tools, the HMA helps filter out uncertain or sideways conditions that might lead to losses.
We’ve selected a list of brokers that offer the tools and flexibility to help traders make the most of Hull Moving Average strategies.
| eOption | Wealthsimple | Ally Bank | Revolut | Interactive Brokers | |
|---|---|---|---|---|---|
|
Foundation year |
2007 | 2014 | 1919 | 2015 | 1978 |
|
Account min. |
No | No | No | No | No |
|
Demo |
Yes | No | No | No | Yes |
|
Deposit Fee |
No | No | No | No | No |
|
Withdrawal fee |
$25 for wire transfers out | No charge | $25 | No charge up to a limit | No |
|
Inactivity fee |
$50 | No inactivity fees | No | Not specified | No |
|
Android |
Yes | Yes | Yes | Yes | Yes |
|
iOS |
Yes | Yes | Yes | Yes | Yes |
|
Regulation |
FINRA, SIPC | FCA, FSCS, OSC, BCSC, ASC, MSC, IIROC, CIPF. | FDIC, FINRA, SIPC, SEC, CFTC, NFA | FCA, SEC, FINRA | FCA, ASIC, MAS, CFTC, NFA, CIRO |
|
TU overall score |
7.63 | 7.39 | 6.61 | 7.69 | 7.45 |
|
Open an account |
Open an account Via eOption's secure website. |
Open an account Via Wealthsimple's secure website. |
Study review | Study review | Open an account Your capital is at risk. |
Why trust us
We at Traders Union have analyzed financial markets for over 14 years, evaluating brokers based on 250+ transparent criteria, including security, regulation, and trading conditions. Our expert team of over 50 professionals regularly updates a Watch List of 500+ brokers to provide users with data-driven insights. While our research is based on objective data, we encourage users to perform independent due diligence and consult official regulatory sources before making any financial decisions.
Learn more about our methodology and editorial policies.
Origin and development of Hull moving average
The Hull Moving Average was introduced by Alan Hull in 2005 as a way to improve on existing moving averages that were either too slow or too noisy. His idea was simple — build something fast and smooth that traders could actually use with confidence.
Meet the creator - Alan Hull
An Australian with a background in math and trading, Alan Hull focused on making technical analysis more practical. He has written books and shared his trading insights with others through talks and courses.
How the HMA became popular
Now widely available
After its release, the HMA was added to many trading platforms and quickly became a favorite among both beginners and experienced traders.No surprises after close
It’s trusted because it doesn’t repaint its values after a candle closes — what you see is what you get.Simple math behind it
Even though the formula uses weighted and squared components, it’s easy enough to understand and doesn’t overwhelm traders.
Understanding the Hull moving average formula
You don’t have to be a math expert to make sense of how the Hull Moving Average works. But understanding the formula behind it can help you use it more effectively and recognize why it behaves differently from other moving averages.
Components of the formula
The HMA is built on a few simple concepts that work together to reduce lag and smooth out the line.
Weighted moving average (WMA)
Focuses on recent prices
WMAs give more weight to the latest data points, which helps the line react faster to price changes.Used multiple times
The HMA uses the WMA in three places, each with different settings to balance speed and stability.
Period input (n)
Chosen by the trader
You can set this based on your trading style. A smaller number makes the HMA more responsive, while a larger one smooths it out more.Used in three ways
The HMA calculation uses n, n/2, and √n — each playing a different role in the process.
What the formula looks like
Actual formula
HMA = WMA[2 × WMA(n/2) − WMA(n)], √n
Why it matters
This formula reduces the delay seen in most moving averages while keeping the final line smooth and easy to read.
Step-by-step calculation process
The Hull formula might seem a bit tricky at first glance, but the actual steps are quite manageable once broken down.
Step 1. Start with half-period WMA
WMA of n/2
Calculate the WMA using half your chosen period. This reacts faster to recent prices.
Step 2. Add in the full-period WMA
WMA of n
Do another WMA calculation using the full period. This gives you a slower-moving trend baseline.
Step 3. Find the difference
Twice the fast WMA minus the slow one
Multiply the half-period WMA by two and subtract the full-period WMA from it. This highlights recent price changes more strongly.
Step 4. Smooth the result
Use √n WMA
Apply a final WMA using the square root of n. This smooths out the sharp changes from step 3 and gives you the final HMA line.
How to set up Hull moving average
Getting the Hull Moving Average (HMA) on your chart is quick and easy. Most trading platforms already include it, and you can have it up and running in just a few clicks. Here’s how to do it without overcomplicating anything.
Access the indicator
You’ll usually find the HMA in your platform’s list of built-in indicators.
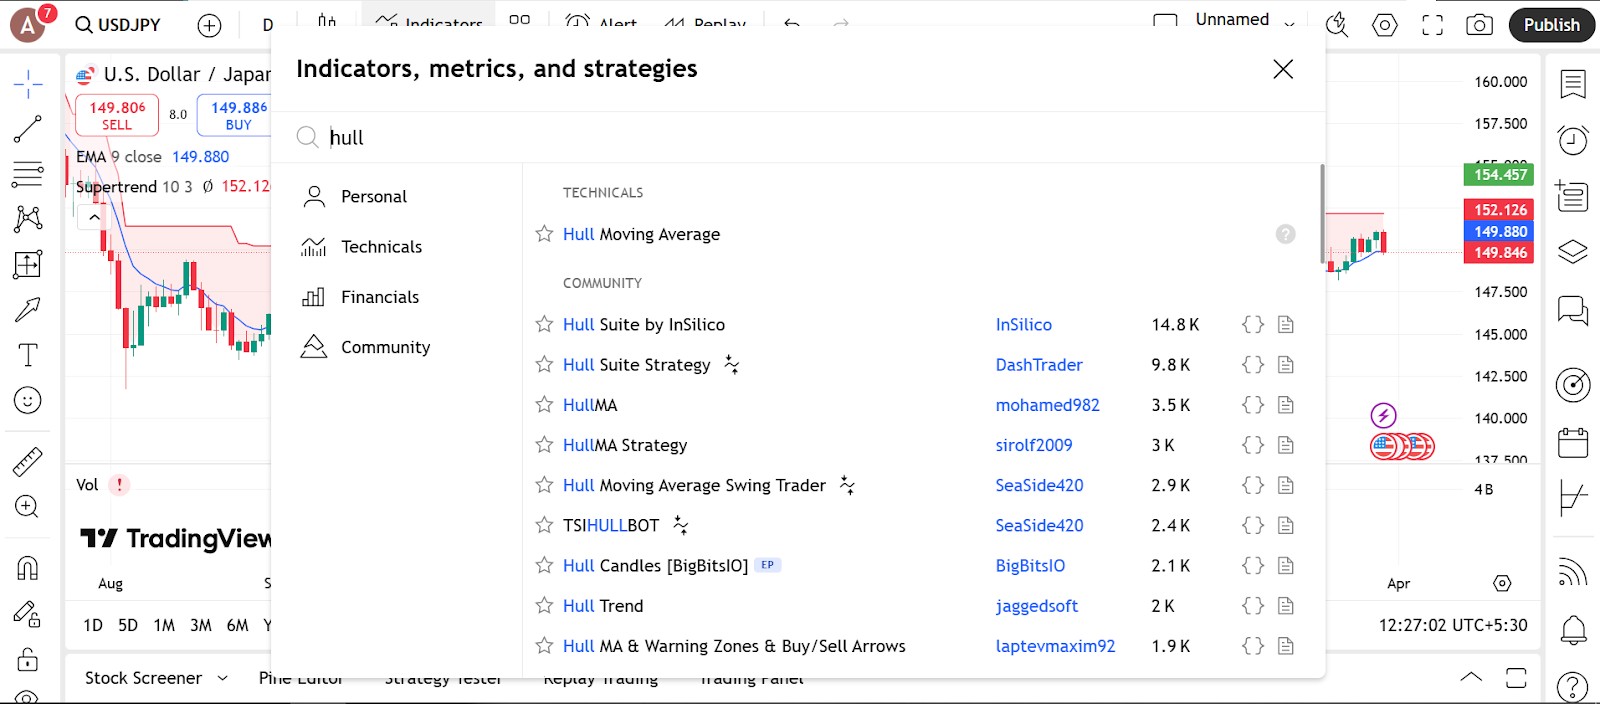
How to locate it
Search for HMA or Hull MA
Go to your indicator list and type in “Hull.” Look for “Hull Moving Average” or “HMA” and click to add it to your chart.Works on major platforms
Platforms like TradingView, MetaTrader, and ThinkorSwim all support it, so you don’t need to install anything extra.Pin it for faster access
If you use it often, mark it as a favorite so it’s easier to find next time.
Configure the parameters
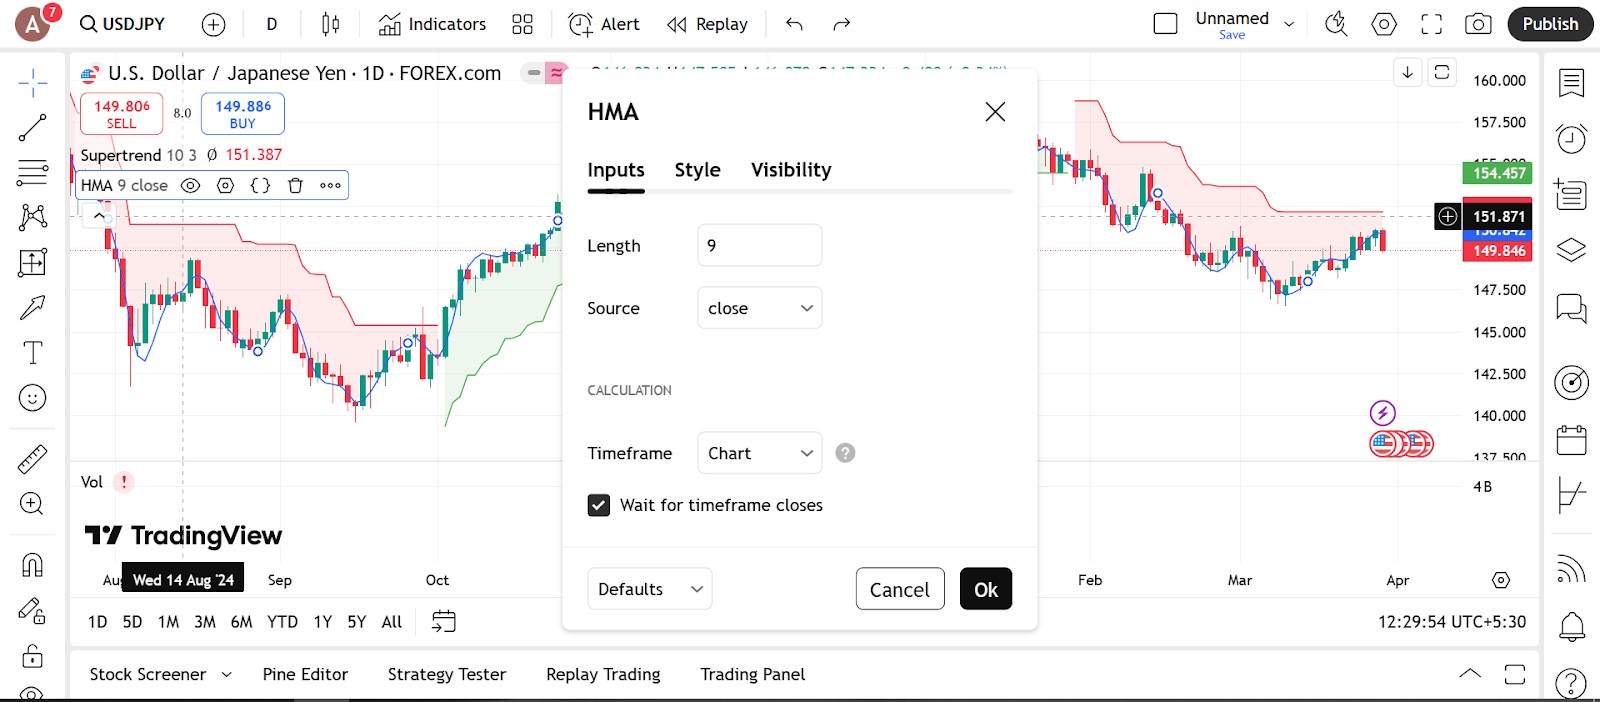
Once it’s on your chart, you can adjust a few settings to make it work better for your setup.
Pick a period length
Start simple
Try using 9, 14, or 21 as your period. Smaller numbers make it respond faster; larger numbers smooth things out more.Match your timeframe
If you’re trading short-term charts like 5-minute or 15-minute, go with shorter periods. For daily or weekly charts, longer periods might give you better clarity.
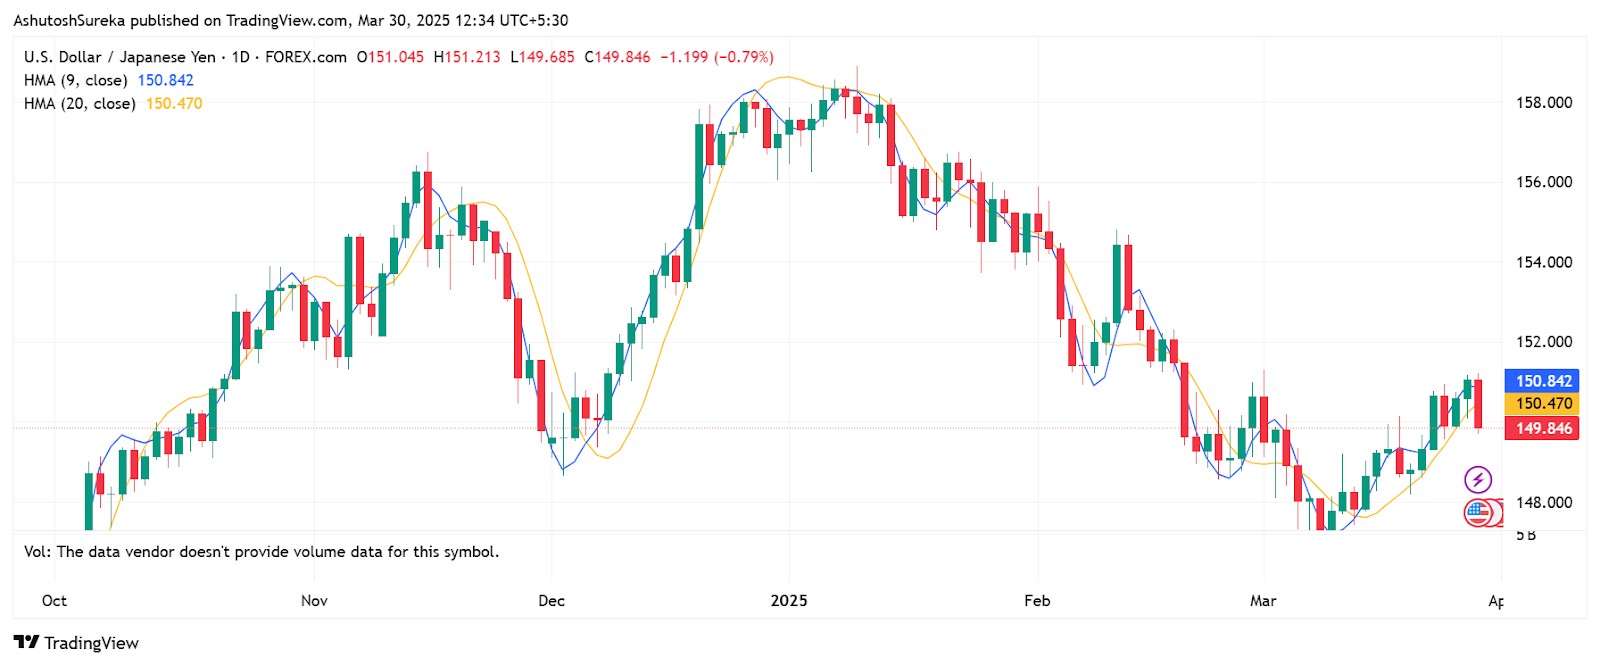
Customize how it looks
Make it easy to see
Choose a bold color and line style that stands out from your price candles. You want it to be easy to spot without straining your eyes.Try more than one HMA Some traders like using two HMAs — one fast, one slow — to catch crossovers or confirm the trend direction.
Use it as part of your entry and exit plan
Price crossing the HMA
When the price moves above or below the HMA, it might be a signal to get in or out of a trade.Look for confirmation
Don’t rely on the HMA alone — combine it with something like RSI or MACD to get a stronger signal.
Trading strategies using Hull moving average
The Hull Moving Average isn’t just for visual appeal — it can actually guide your trades. With its fast response and smooth line, the HMA helps you spot trends, time entries, and avoid getting caught in noisy market moves.
Following the trend
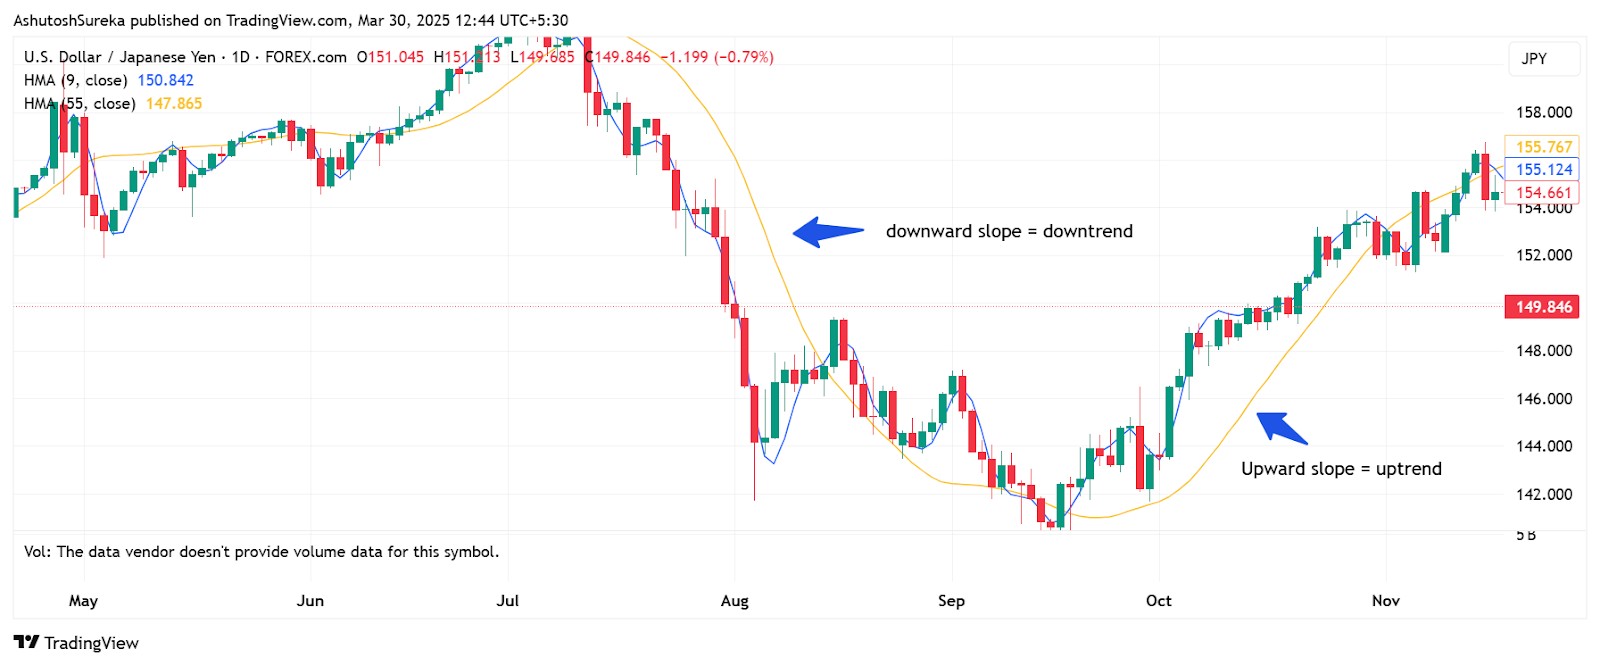
One of the most common ways to use the HMA is to trade in the direction of the market’s momentum.
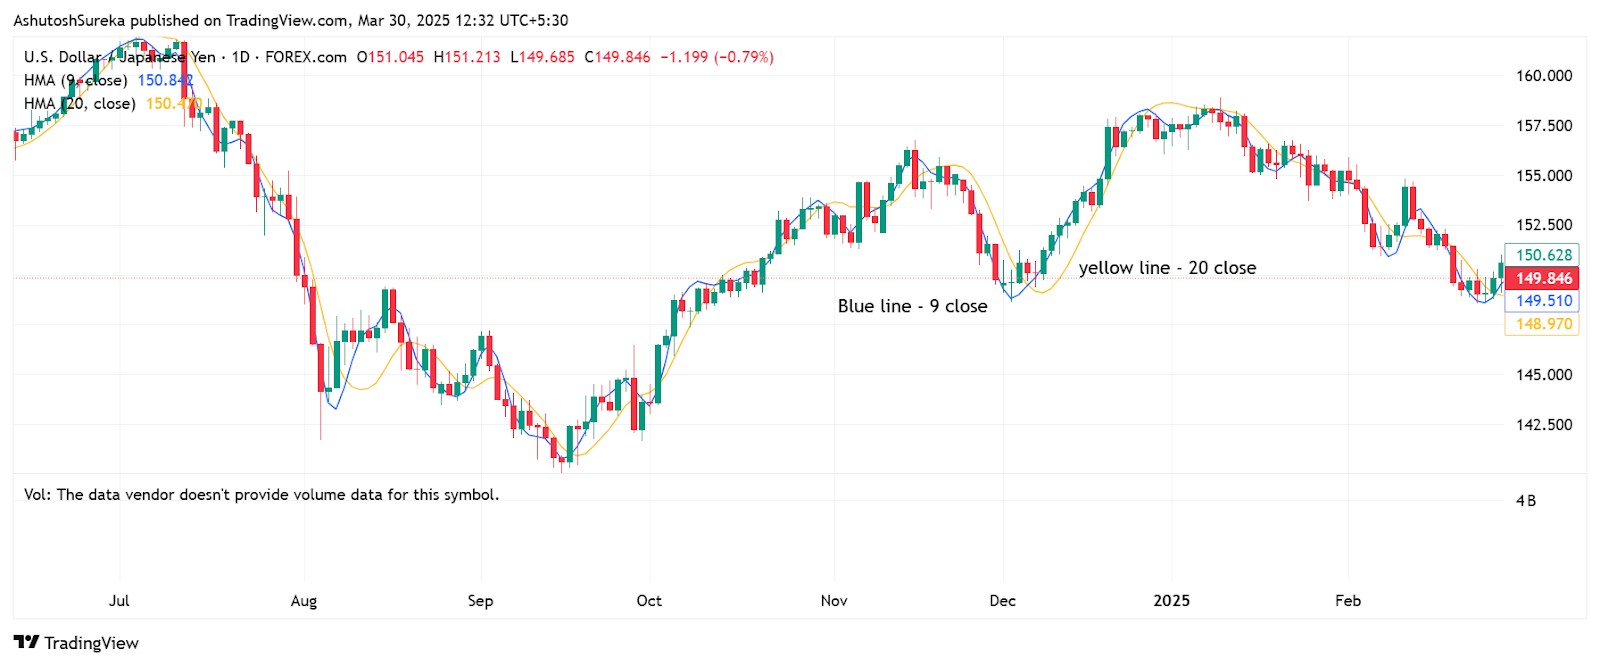
What to look for
Upward slope = uptrend
When the HMA curves upward, it usually signals that prices are climbing.Downward slope = downtrend
If it starts turning lower, that often points to a falling market.
When to trade
Buy in an uptrend
Wait for a short-term dip, then enter as the price moves back above the HMA.Sell in a downtrend
Look for small rallies against a falling HMA, then enter when it rolls over again.
Make it stronger
Add confirmation tools
Use RSI or MACD to double-check momentum before entering a trade.
Crossover setup
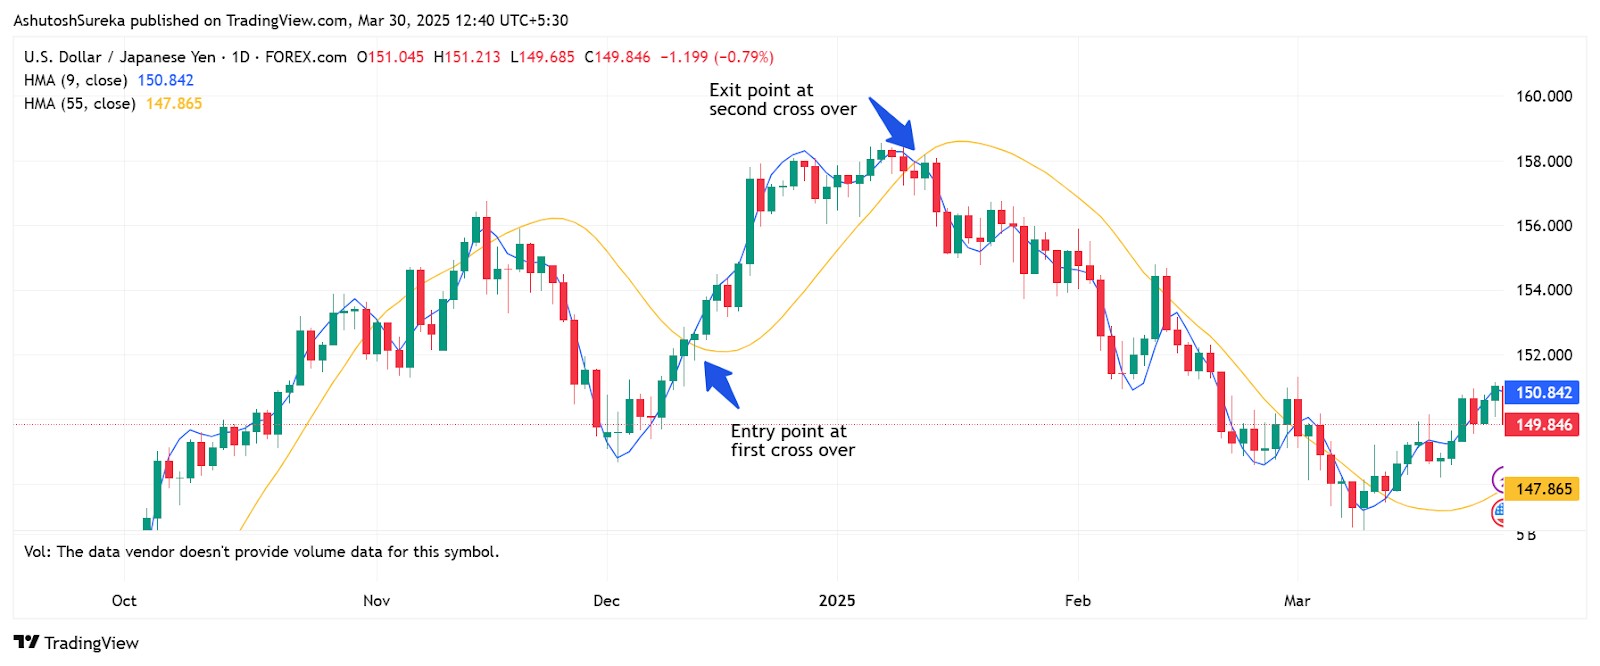
This strategy uses two different HMAs to spot changes in trend direction.
How to set it up
Use one fast and one slow HMA
Try something like 9 for the fast line and 55 for the slower one.Watch for crossover signals
If the fast HMA goes above the slow one, that’s usually a buy signal.
If the fast one drops below the slow, it might be time to sell or short.
Strengthen your signals
Look for high volume
If volume picks up around the crossover, it may signal stronger conviction.Check key price levels
Make sure the crossover isn’t happening right into a major support or resistance zone.
Scalping with Hull
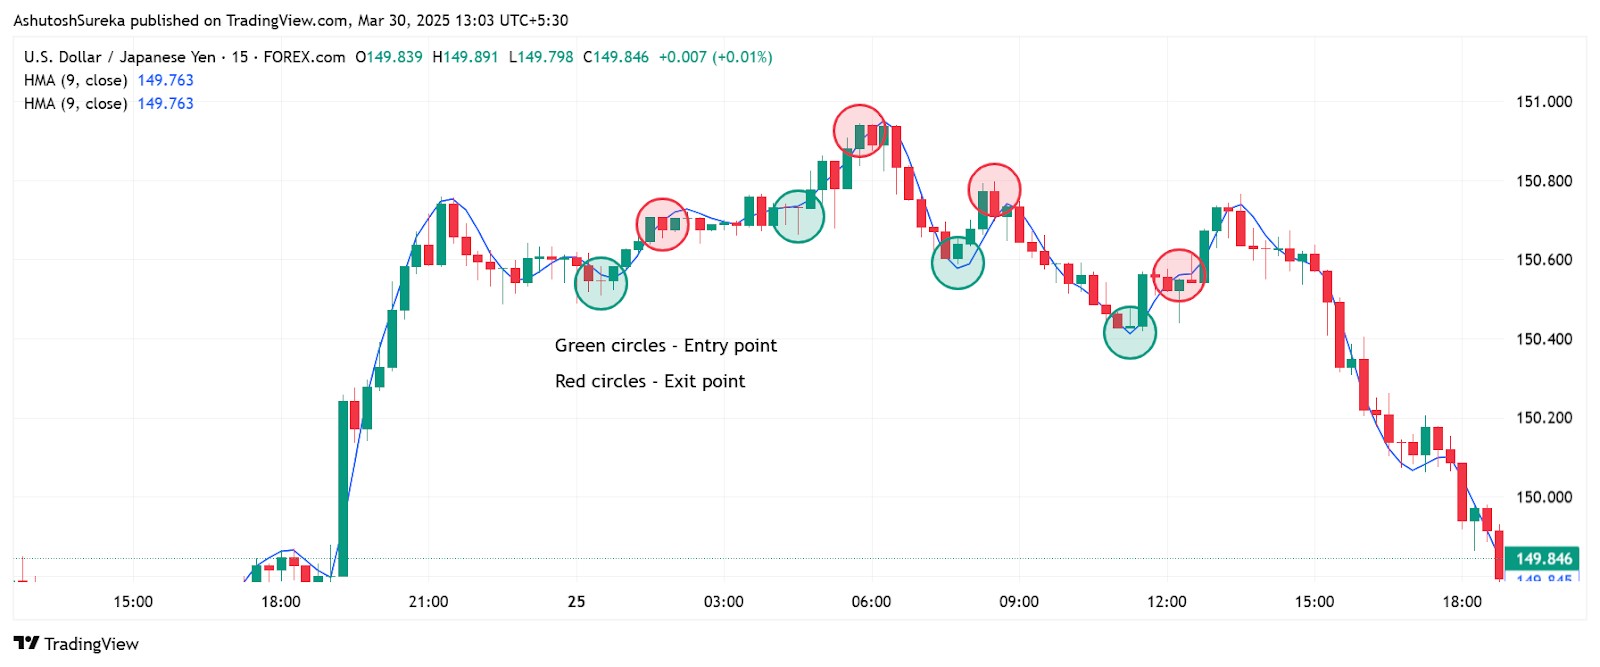
For fast-paced traders, the HMA can be a handy tool to time quick in-and-out trades.
What works best
Use short settings like 9 or 14
This gives you a fast-moving line that can keep up with quick shifts in price.Trade slope changes or crossovers
Even a small change in the HMA direction can be a sign to enter or exit.Keep things tight
Use small stop-losses and quick take-profits to manage your trades efficiently.
Pros and cons of Hull moving averages
- Pros
- Cons
- Fast but smooth. The HMA reacts quickly to changes in price, so you’re not waiting too long to catch a trend. But unlike some fast indicators, it doesn’t jump all over the place.
- Cleaner signals. You get fewer false alarms during normal market conditions, making it easier to stick to your strategy.
- Works across timeframes. Whether you’re looking at five-minute charts or daily setups, the HMA adjusts nicely.
- Combines well with other tools. It’s great alongside momentum or volume indicators to confirm what the market’s really doing.
- Useful in both directions. You can use the HMA for uptrends, downtrends, or even pullbacks. It helps you stick with the move instead of getting shaken out.
- Too many flip-flops. When the market moves sideways, the HMA might change direction often, giving you bad entries.
- No insight into volume. Since it only looks at price, the HMA doesn’t tell you if there’s real strength behind a move.
- Misses the bigger picture. If you’re only using the HMA, you might miss key price levels or get caught off guard by news events.
- Needs confirmation. It's a solid trend tool, but pairing it with something like RSI, MACD, or volume helps avoid false setups.
- Needs adjustment. There’s no perfect number for the period length. What works on one chart might not work on another.
- Can be too sensitive or too dull. If your settings are off, the HMA might react too soon — or not soon enough — making you miss out on good trades.
HMA is a timing tool, not a trend line

If you’re using the Hull Moving Average just to tell you which way the trend’s going, you’re missing what it’s actually good at. What makes HMA stand out is how it shows you when momentum is speeding up or slowing down. Try plugging in smaller values — like 9 or 13 — and watch how fast it reacts when things shift. You’ll start seeing those early curve bends right before price stalls or flips. It works surprisingly well on fast names like Nasdaq micros or leveraged ETFs, where speed actually matters more than trend direction.
Here’s something you probably haven’t tried: match HMA signals with volume context. If the HMA starts curling up while volume breaks out above its 10-day average, that’s not random — that’s a launch building up. When you pair that kind of price speed with volume pressure, you’re not reacting late — you’re early. HMA isn’t just a smoother line. Used right, it turns your setup into a trigger. And if you understand how to read it, HMA gives you a heads-up — not a delay.
Conclusion
The Hull Moving Average isn’t a silver bullet — it’s a tool that helps you figure out timing in a more precise way. It’s not just about smoothing out your chart or getting rid of clutter. It’s about spotting when momentum is shifting before it shows up in the candles. But to get that value, you’ve got to stop treating it like just another trend line. Use it to watch how fast things are changing — not just where they are. All your indicators don’t speak the same language. HMA helps you read the rhythm behind the move — and that’s something you can actually trade off, not just stare at.
FAQs
How does Hull moving average reduce lag compared to other moving averages?
The Hull Moving Average reduces lag by using weighted moving averages and a smoothing process that responds more quickly to price changes. It offers a faster and more accurate reflection of market trends than traditional moving averages.
Can Hull moving average be used for all types of financial instruments?
Yes, the Hull Moving Average can be applied to stocks, forex, commodities, and cryptocurrencies. Its adaptability makes it useful across various timeframes and instruments, though results may vary based on market behavior.
What are the recommended settings for Hull moving average in short-term trading?
For short-term trading, common settings range between 9 and 21 periods. Traders often adjust these based on asset volatility and preferred chart timeframe to balance responsiveness and signal clarity.
Are there any limitations to using Hull moving average in volatile markets?
In highly volatile markets, the Hull Moving Average may still generate false signals despite its smoothing. It’s best used with confirmation tools like volume analysis or price patterns to improve decision-making.
Related Articles
Team that worked on the article
Rinat Gismatullin is an entrepreneur and a business expert with 9 years of experience in trading. He focuses on long-term investing, but also uses intraday trading. He is a private consultant on investing in digital assets and personal finance. Rinat holds two degrees in Economy and Linguistics.
Chinmay Soni is a financial analyst with more than 5 years of experience in working with stocks, Forex, derivatives, and other assets. As a founder of a boutique research firm and an active researcher, he covers various industries and fields, providing insights backed by statistical data. He is also an educator in the field of finance and technology.
As an author for Traders Union, he contributes his deep analytical insights on various topics, taking into account various aspects.
Mirjan Hipolito is a journalist and news editor at Traders Union. She is an expert crypto writer with five years of experience in the financial markets. Her specialties are daily market news, price predictions, and Initial Coin Offerings (ICO).
In the Forex market, a “trend” is the label used to describe the general direction that the prices of currency pairs are moving in, over a specific period of time. Trends are basically the pattern that a currency pair appears to be following and can help traders determine when to enter and exit a trade.
Cryptocurrency is a type of digital or virtual currency that relies on cryptography for security. Unlike traditional currencies issued by governments (fiat currencies), cryptocurrencies operate on decentralized networks, typically based on blockchain technology.
Day trading involves buying and selling financial assets within the same trading day, with the goal of profiting from short-term price fluctuations, and positions are typically not held overnight.
Volatility refers to the degree of variation or fluctuation in the price or value of a financial asset, such as stocks, bonds, or cryptocurrencies, over a period of time. Higher volatility indicates that an asset's price is experiencing more significant and rapid price swings, while lower volatility suggests relatively stable and gradual price movements.
Forex leverage is a tool enabling traders to control larger positions with a relatively small amount of capital, amplifying potential profits and losses based on the chosen leverage ratio.


-
 Afghanistan
-
 Albania
-
 Algeria
-
 Argentina
-
 Armenia
-
 Australia
-
 Austria
-
 Azerbaijan
-
 Bahamas
-
 Bahrain
-
 Bangladesh
-
 Belgium
-
 Botswana
-
 Brazil
-
 Brunei
-
 Bulgaria
-
 Burma
Burma
-
 Cambodia
-
 Cameroon
-
 Canada
-
 Chile
Chile
-
 China
China
-
 Colombia
-
 Costa Rica
-
 Cote d'Ivoire
-
 Croatia
-
 Cyprus
-
 Czech Republic
-
 Denmark
-
 Dominican Republic
-
 Ecuador
-
 Egypt
Egypt
-
 Estonia
-
 Eswatini
-
 Ethiopia
-
 Finland
-
 France
-
 Georgia
-
 Germany
-
 Ghana
Ghana
-
 Greece
-
 Haiti
Haiti
-
 Hong Kong
-
 Hungary
-
 India
India
-
 Indonesia
-
 Iran, Islamic republic
-
 Iraq
Iraq
-
 Ireland
-
 Israel
-
 Italy
Italy
-
 Jamaica
-
 Japan
Japan
-
 Jordan
-
 Kazakhstan
-
 Kenya
Kenya
-
 Korea
Korea
-
 Kuwait
-
 Kyrgyzstan
-
 Laos
Laos
-
 Latvia
-
 Lebanon
-
 Libyan Arab Jamahiriya
-
 Lithuania
-
 Luxembourg
-
 Macedonia
-
 Madagascar
-
 Malaysia
-
 Malta
Malta
-
 Mauritius
-
 Mexico
-
 Moldova
-
 Mongolia
-
 Montenegro
-
 Morocco
-
 Mozambique
-
 Namibia
-
 Nepal
Nepal
-
 Netherlands
-
 Nigeria
-
 Norway
-
 Oman
Oman
-
 Pakistan
-
 Palestine
-
 Papua New Guinea
-
 Peru
Peru
-
 Philippines
-
 Poland
-
 Portugal
-
 Puerto Rico
-
 Qatar
Qatar
-
 Romania
-
 Rwanda
-
 Saudi Arabia
-
 Serbia
-
 Singapore
-
 Slovakia
-
 Slovenia
-
 Somalia
-
 South Africa
-
 Spain
Spain
-
 Sri Lanka
-
 Sweden
-
 Switzerland
-
 Syrian Arab Republic
-
 Taiwan
-
 Tajikistan
-
 Tanzania, United Republic Of
-
 Thailand
-
 Trinidad and Tobago
-
 Tunisia
-
 Turkey
-
 UAE
UAE
-
 Uganda
-
 Ukraine
-
 United Kingdom
-
United States
-
 Uzbekistan
-
 Venezuela
-
 Vietnam
-
 Yemen
Yemen
-
 Zambia
-
 Zimbabwe
- Forex
- Crypto
