
What is the Best Trading Timeframe for Beginners?


Editorial Note: While we adhere to strict Editorial Integrity, this post may contain references to products from our partners. Here's an explanation for How We Make Money. None of the data and information on this webpage constitutes investment advice according to our Disclaimer.
There is no single best trading time frame for beginners, but 4-hour and daily charts can provide an easier learning environment because they show broader price movements with less short-term noise. A 1-hour chart may suit beginners who want a more active approach, while very short timeframes generally require faster decisions and more frequent monitoring.
Choosing a first trading timeframe is partly about finding a pace that makes learning manageable. Very short charts provide frequent price updates and potential setups, but they also leave less time to analyze each decision. This article explains which timeframes may be easier for beginners, how available trading time affects the choice and how to practice consistently with one chart interval.
What timeframe should beginners start with?
For many beginners, 1-hour, 4-hour and daily charts are more manageable starting points than very short minute charts. All three provide more time to study price movement and make decisions than a 1-minute or 5-minute chart, but they create quite different trading routines.
1-hour timeframe
The 1-hour chart can suit beginners who want a relatively active approach. New candles form frequently enough to provide regular opportunities to analyze price movement, while generally allowing more time for decisions than minute charts. The trade-off is that H1 still requires fairly regular monitoring and shows more short-term fluctuations than H4 or D1.
4-hour timeframe
The 4-hour chart offers a slower pace while still providing regular market activity. It can be a practical middle ground between the more active H1 chart and the slower daily chart, giving beginners more time to analyze setups while still seeing new candles form throughout the trading day.
Daily timeframe
The daily chart provides the slowest pace of the three. It can suit beginners with limited time for market monitoring and strategies focused on larger price movements. However, fewer candles also mean fewer opportunities to practice, so D1 may feel too slow for someone who wants more frequent trading decisions.
| Timeframe | Trading pace | Monitoring | May suit beginners who |
|---|---|---|---|
| 1 hour | Moderate | Regular | Prefer a more active approach |
| 4 hours | Slower | Periodic | Want more time to analyze setups |
| Daily | Slow | Limited | Prefer broader trends and less monitoring |
A longer timeframe is not automatically easier simply because price develops more slowly. Weekly or monthly charts, for example, may provide too few setups for someone who wants to practice trading regularly. A useful starting point provides enough opportunities to learn without making every decision feel rushed.
Why 4-hour and daily charts can be easier for beginners
One of the main advantages of 4-hour and daily charts is that they compress many smaller price fluctuations into each candle. This can make broader trends, support and resistance levels and larger price swings easier to distinguish from movements that may have little importance to the overall setup.
The slower pace also gives beginners more time to think. On a 5-minute chart, market conditions can change within a few candles while the trader is still evaluating the setup. On a 4-hour or daily chart, decisions generally develop over a longer period.
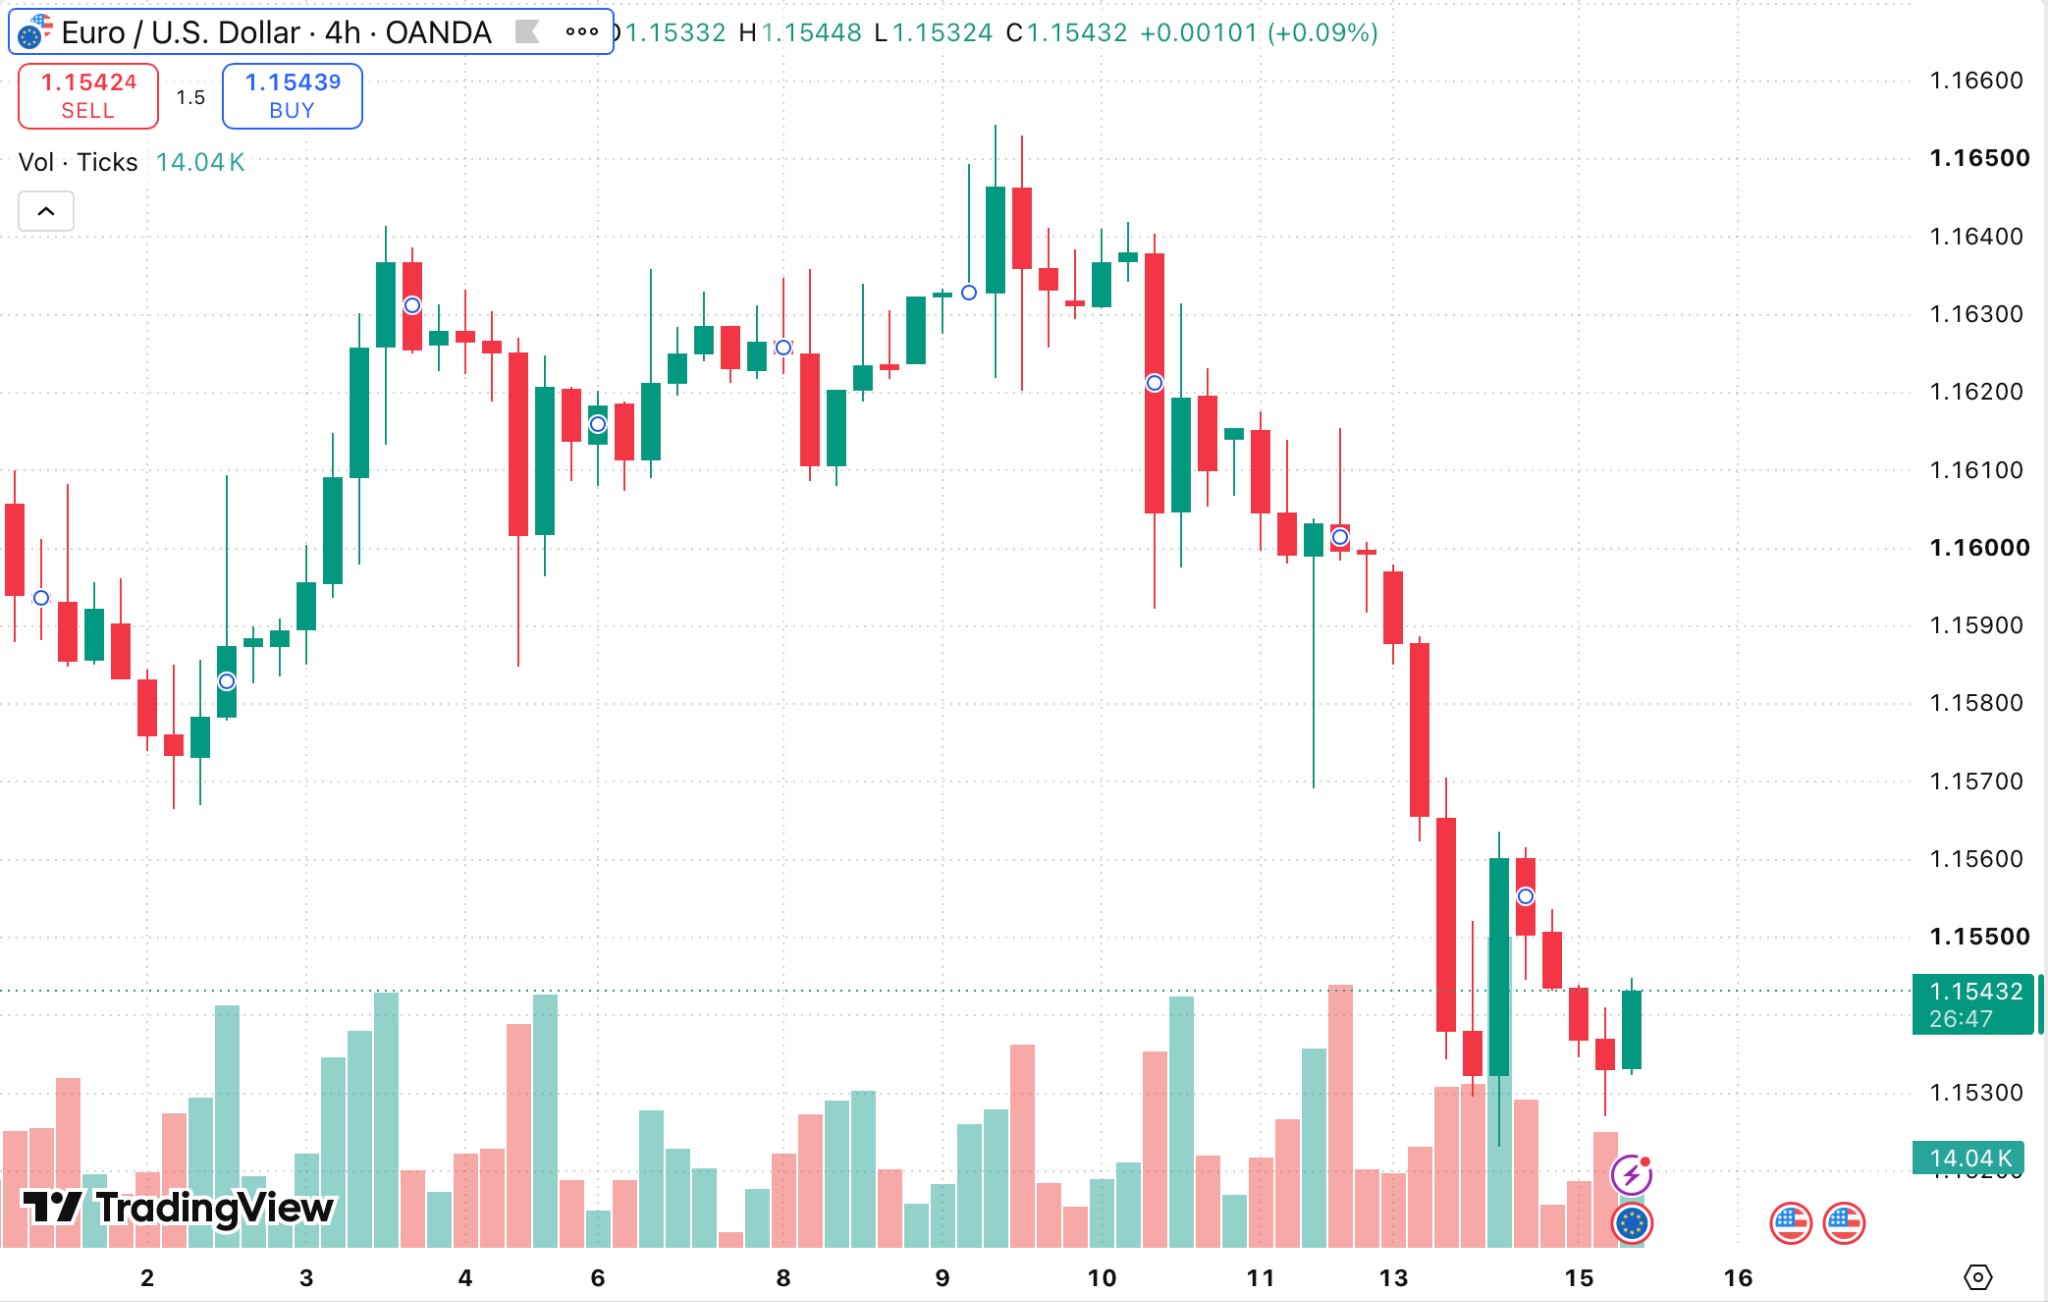
The advantage here is not that signals on longer timeframes are automatically more successful. It is that fewer rapid changes can make it easier to follow a trading plan and understand why a particular decision was made.
Are short timeframes suitable for beginners?
Short timeframes are not necessarily unsuitable for beginners. A trader learning scalping or short-term day trading will need to become comfortable with minute charts because those intervals show the price movements the strategy is designed to capture.
The difficulty is the pace. On very short charts, small price fluctuations are more visible, setups can develop quickly and more potential signals may appear during the same trading session. That means more decisions to evaluate and more frequent monitoring. Trading costs such as spreads and commissions also become more relevant when positions are opened and closed frequently.
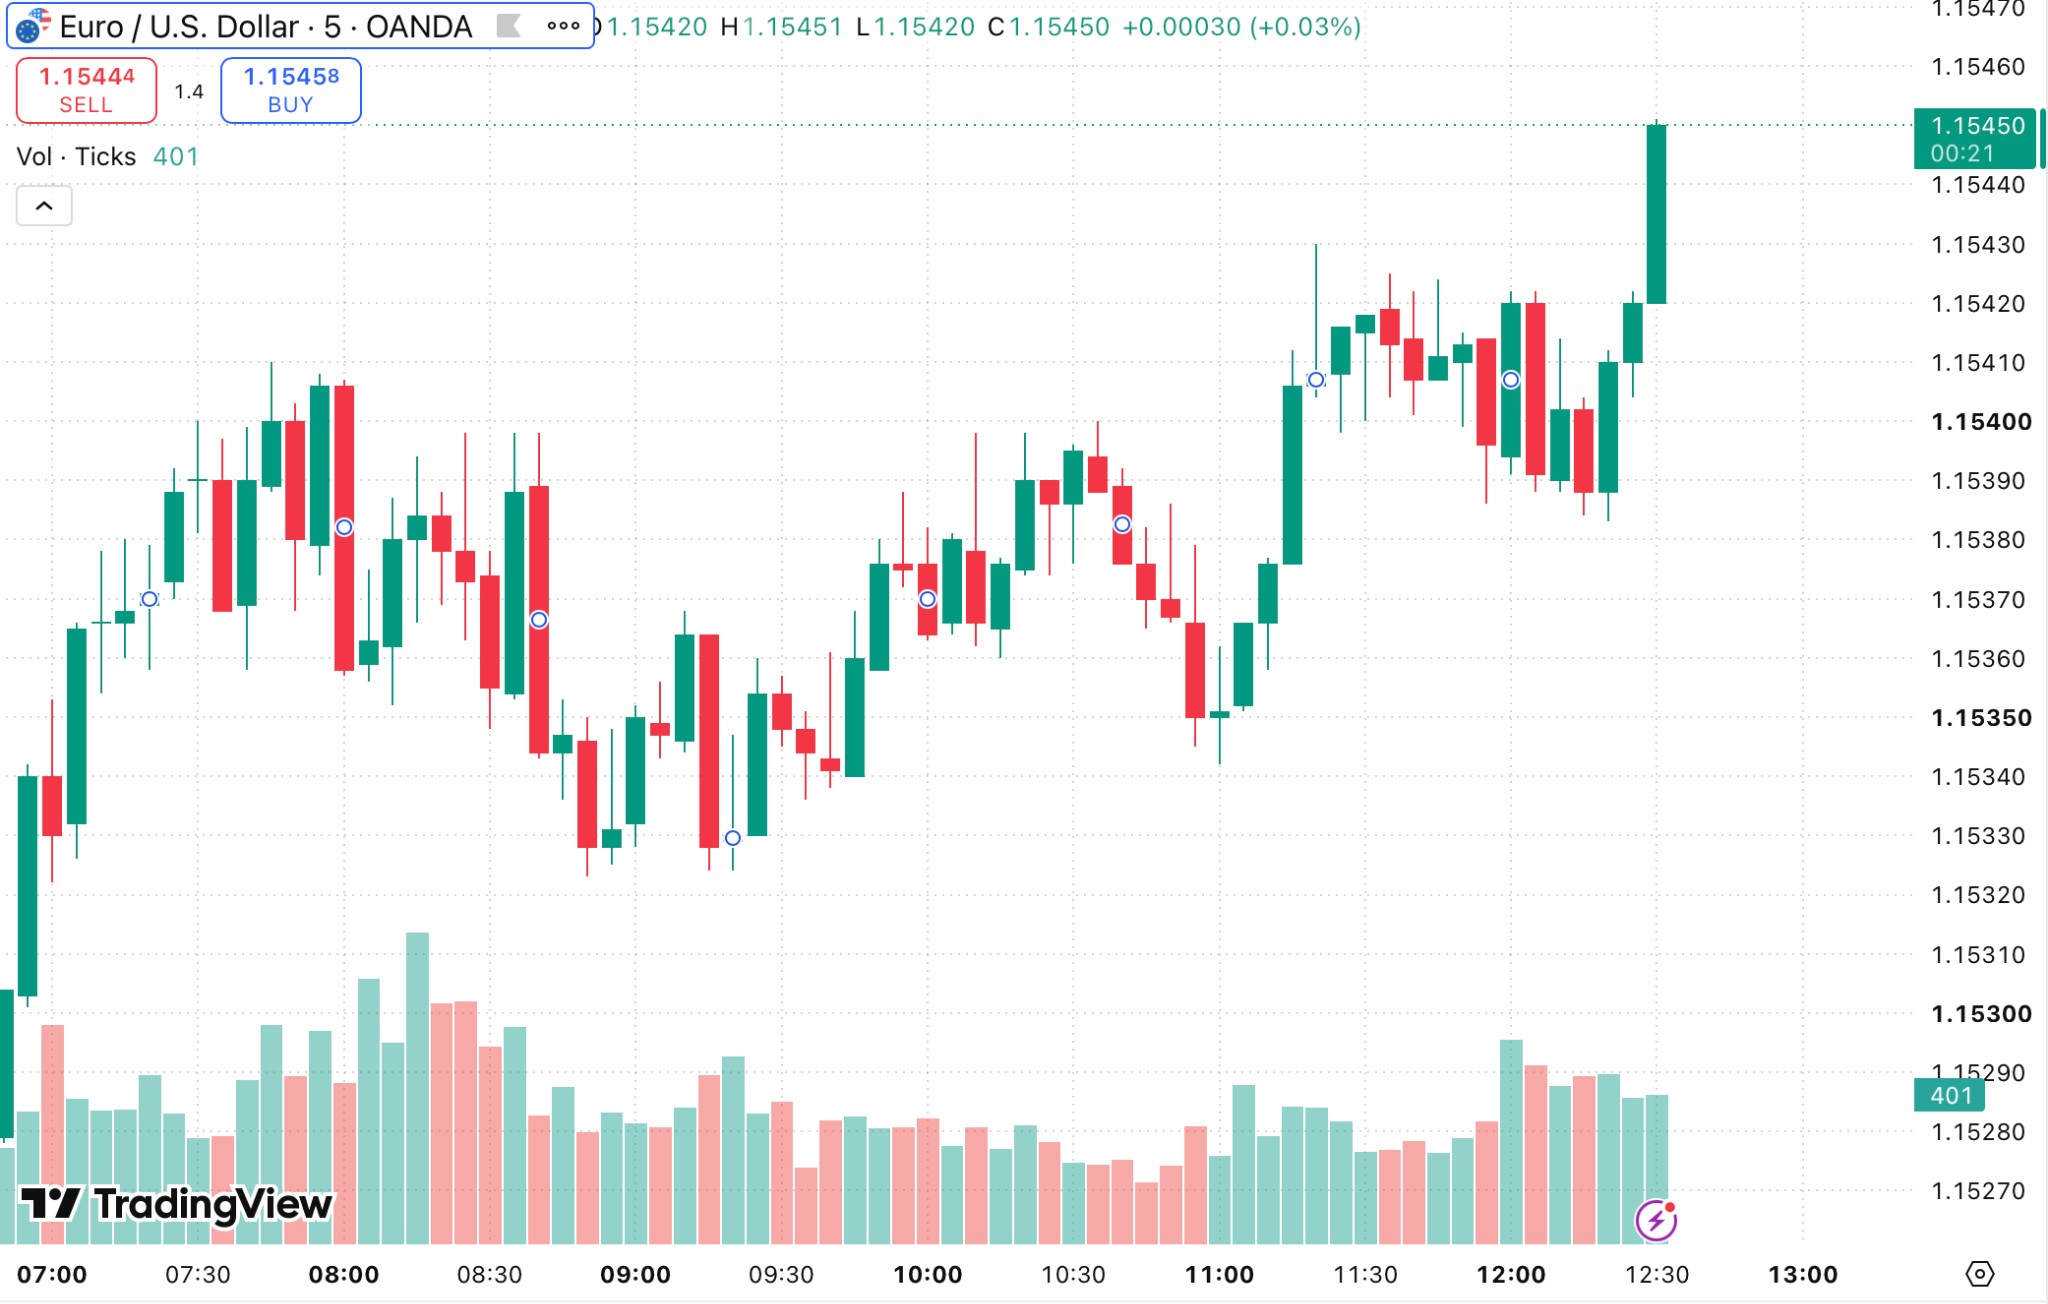
For someone deliberately learning a short-term strategy, this faster environment is part of the process. But a short timeframe should be chosen because it fits the strategy, not simply because it produces more trading opportunities.
How much time can you spend trading?
A practical way to choose a timeframe is to consider how often the market can realistically be monitored. A chart that requires attention every few minutes is unlikely to work well for someone who can only check the market occasionally.
Traders with frequent access throughout the trading day may be comfortable with hourly or shorter charts. If the market can only be checked at several scheduled times, a 4-hour chart may be more practical. For someone with limited time for monitoring, a daily chart can fit more easily into the routine.
Available trading time = market monitoring + analysis + trade review
Beginners need time not only to watch prices but also to study setups, review completed trades and identify mistakes. The pace should also feel manageable. Having enough time to monitor a 5-minute chart does not necessarily mean that making frequent decisions on it will suit a beginner. If decisions regularly feel rushed or it becomes difficult to follow the trading rules consistently, a slower timeframe may provide a better environment for practice.
How to choose one timeframe and stick with it
Beginners do not need to find a perfect timeframe immediately. A more practical approach is to choose one that broadly fits the intended trading style and daily routine, then use it consistently enough to understand how trading on that interval actually works.
A simple process is:
Decide what type of trading you want to learn. A short-term strategy requires a different pace from swing or position trading;
Consider your schedule. Choose an interval you can realistically monitor;
Select one main timeframe. This might be 1-hour, 4-hour or daily;
Practice consistently. Use the same interval long enough to become familiar with its pace and typical price movements;
Review the fit. Consider whether you can analyze setups, follow the strategy rules and make decisions without feeling constantly rushed;
Change only for a clear reason. A few unsuccessful trades do not necessarily mean the timeframe is unsuitable.
Working with one chart interval makes it easier to develop a consistent decision process instead of changing the view whenever the market behaves unexpectedly.
How to practice with a new timeframe
Once a timeframe has been selected, the next step is to become familiar with how price behaves on it. Keeping the practice environment simple makes this easier. A beginner might start with one familiar, liquid market such as EUR/USD and use the same timeframe, setup and risk-management rules rather than changing several variables at once.
Historical charts and demo accounts can be used to practice identifying trends, ranges and important price levels before risking real money. It is also useful to keep a simple trading journal, recording the setup, the reason for each decision and whether the pace of the timeframe felt manageable. After a period of practice, the journal can help show whether difficulties are related to the timeframe, the strategy or how consistently the trading rules are being applied.
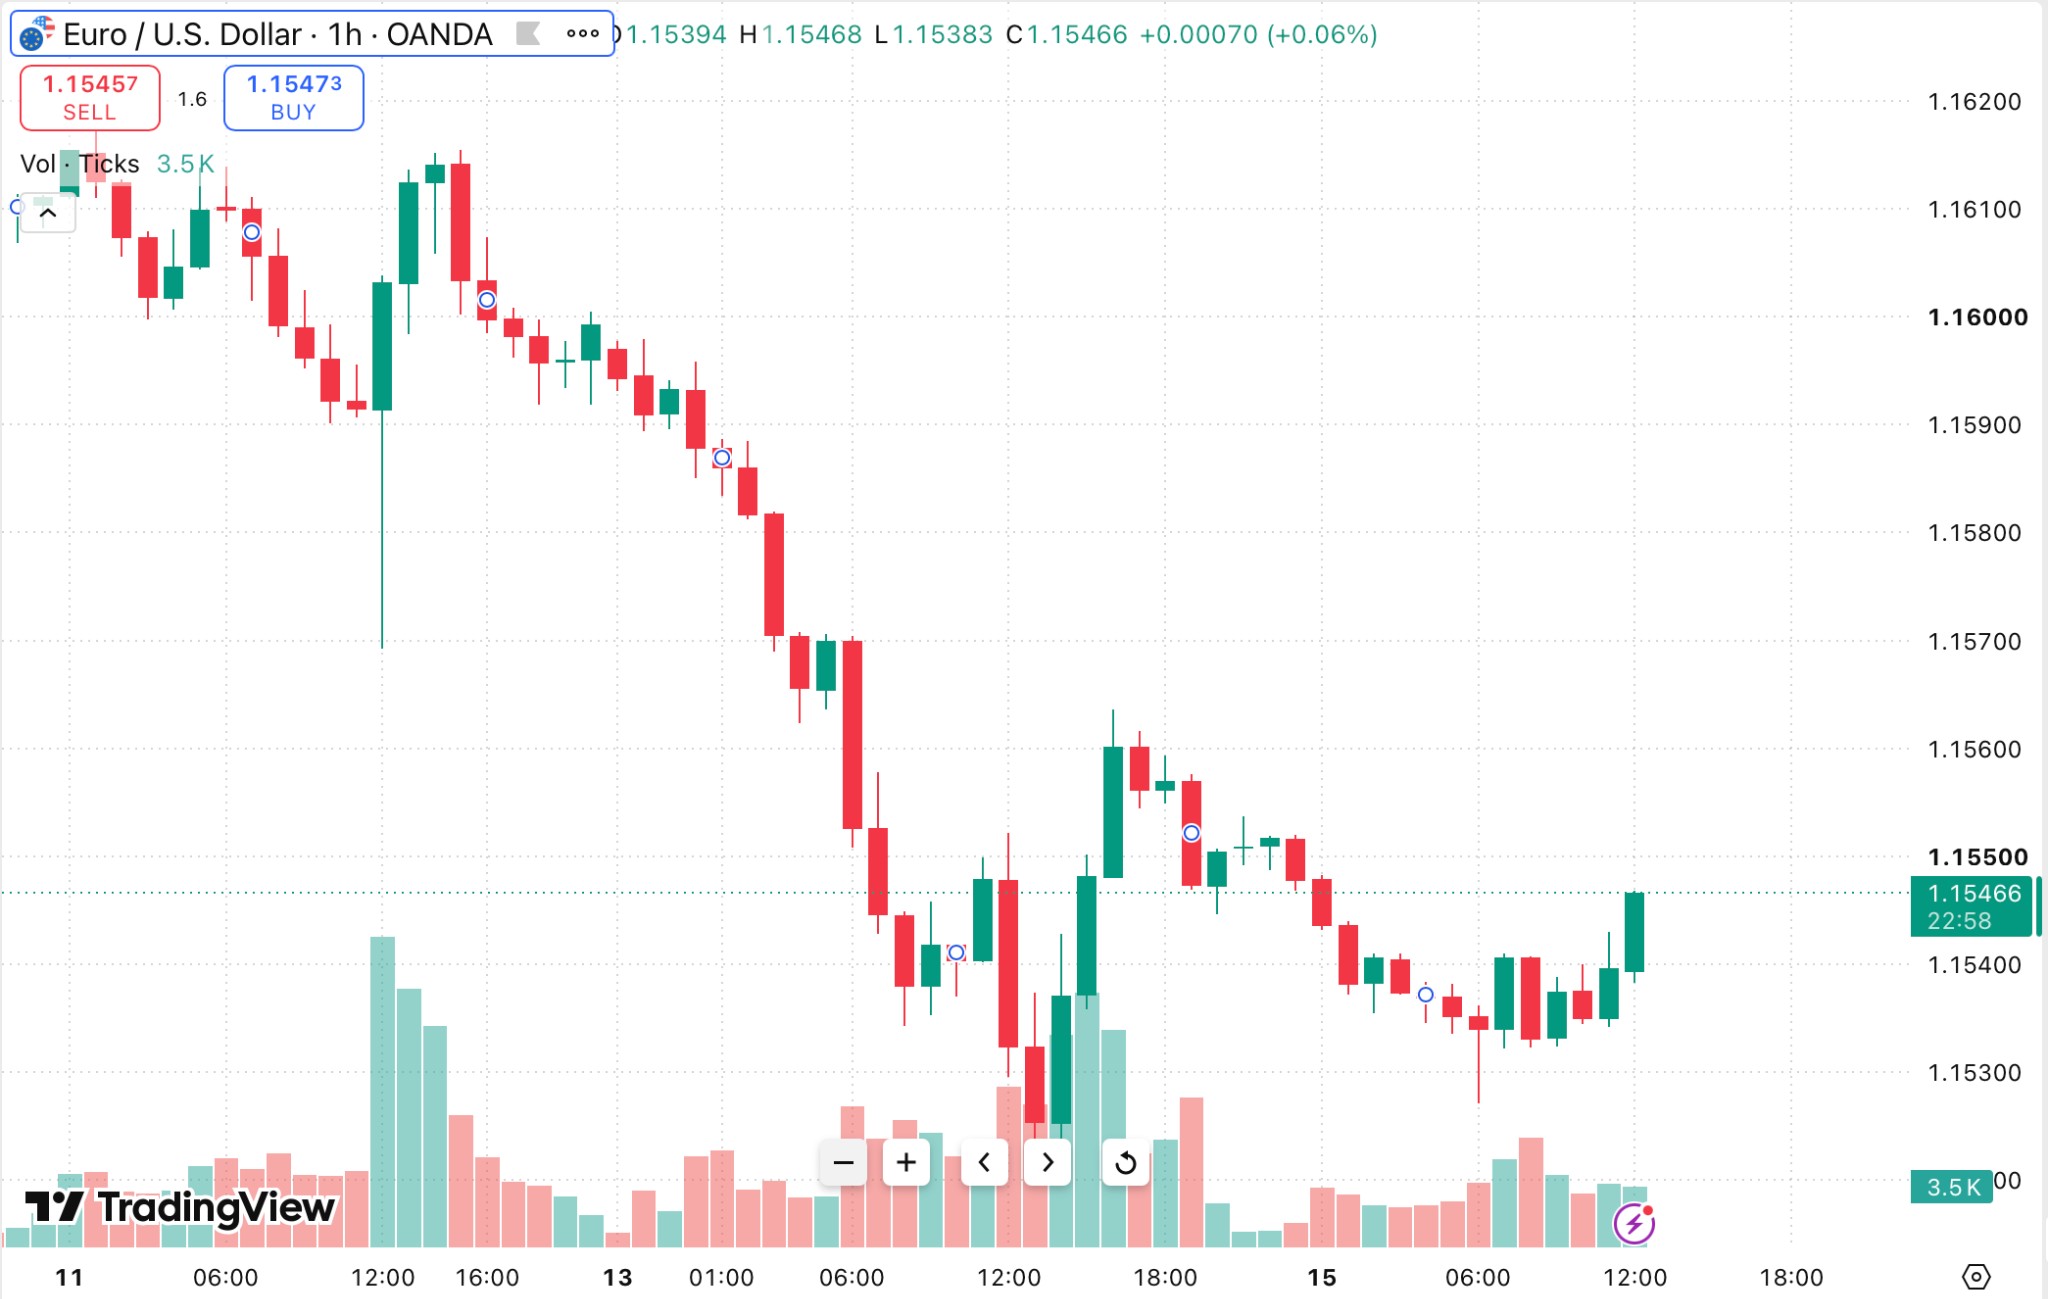
Profit or loss alone does not show whether a timeframe is suitable. During practice, a better measure is whether the trader can apply the strategy consistently and has enough time to understand each decision.
Common timeframe mistakes beginners make
The timeframe itself does not determine whether a trading strategy will work, but choosing or changing intervals for the wrong reasons can make learning harder.
Common mistakes include:
Starting with the shortest chart for more action. More candles and signals do not necessarily create better learning opportunities;
Ignoring the daily schedule. A timeframe that cannot be monitored consistently can make a strategy difficult to follow;
Switching after a few losing trades. Short-term results do not necessarily show that the timeframe is unsuitable;
Changing charts when a setup becomes unclear. Searching for an interval that supports the preferred view can lead to inconsistent decisions;
Copying another trader's timeframe. Their strategy, experience and schedule may be different;
Testing several timeframes at once. Constant switching makes it harder to become familiar with any one interval.
Best Forex brokers for beginners
Beginners may benefit from a Forex broker that provides a demo account, suitable charting tools and access to the timeframes required by their strategy. Trading costs, execution conditions, regulation and the range of available currency pairs should also be considered. Comparing these factors can help traders choose a platform that supports both practice and their preferred trading approach.
| Trading.com USA | Plus500 | OANDA | FOREX.com | IG Markets | |
|---|---|---|---|---|---|
|
Currency pairs |
69 | 60 | 68 | 80 | 80 |
|
Min. deposit, $ |
50 | 100 | No | 100 | 1 |
|
Max. leverage |
1:50 | 1:300 | 1:200 | 1:50 | 1:200 |
|
Min Spread EUR/USD, pips |
0.9 | 0.5 | 0.1 | 0.7 | 0.6 |
|
Demo |
Yes | Yes | Yes | Yes | Yes |
|
TU overall score |
6.88 | 6.67 | 6.63 | 6.47 | 6.38 |
|
Open an account |
Go to broker Your capital is at risk. |
Go to broker 81% of retail CFD accounts lose money. |
Go to broker Your capital is at risk. |
Study review | Study review |
Give yourself enough time to make a decision

I think beginners sometimes choose very short timeframes because more price movement feels like more opportunity to learn. In practice, having to make frequent decisions can make it harder to understand why a trade was taken and whether the trading rules were followed correctly.
I would start with one timeframe that provides enough opportunities to practice without requiring constant attention. For many beginners, a 4-hour or daily chart can make the learning process more manageable, while a 1-hour chart may suit someone who deliberately wants a more active approach.
The important part is to give the timeframe enough time. Switching from one interval to another after a few difficult trades makes it hard to build a consistent process. I would rather see a beginner become comfortable making planned decisions on one chart than keep searching for a timeframe that appears easier or more profitable.
Conclusion
Choosing the right trading timeframe is crucial for beginners who want to develop skill and consistency without feeling overwhelmed. The article strongly suggests that starting with 4-hour or daily charts offers a manageable learning pace, as these intervals filter out short-term noise and allow more time for thoughtful analysis. For instance, a daily chart benefits those with limited availability, while the 1-hour chart caters to learners seeking more frequent practice, though at a busier pace. Ultimately, the most powerful lesson is that sticking with one suitable timeframe lets beginners focus on learning process and decision discipline, rather than chasing quick results.
FAQs
How does choosing the wrong trading timeframe affect a beginner's learning process?
Selecting a trading timeframe that doesn't match a beginner's schedule or learning style can make it harder to practice consistently, follow trading rules, and understand trade outcomes. Frequent switching between timeframes or starting with very short intervals can lead to rushed decisions and inconsistent learning.
What are the main factors to consider before settling on a trading timeframe as a beginner?
Beginners should consider their available time for market monitoring, preferred trading pace, and the type of strategy they wish to learn. It's important to choose a timeframe that fits realistically into their daily routine and allows enough time to analyze setups and review trades without feeling rushed.
How can beginners measure their progress on a chosen trading timeframe?
Progress can be measured by how consistently the strategy is applied and whether the pace of decision-making feels manageable. Keeping a trading journal to record decisions and reflections helps identify if difficulties arise from the timeframe or other aspects of the learning process, rather than focusing solely on profit or loss.
Why is it important for beginners to avoid frequently switching trading timeframes?
Frequently changing trading timeframes prevents beginners from developing a consistent decision-making process and understanding the typical price movements within a single interval. Sticking to one timeframe enables deeper familiarity and better evaluation of both strategy effectiveness and personal comfort with the trading pace.
FAQs
How does choosing the wrong trading timeframe affect a beginner's learning process?
What are the main factors to consider before settling on a trading timeframe as a beginner?
How can beginners measure their progress on a chosen trading timeframe?
Why is it important for beginners to avoid frequently switching trading timeframes?
Editors' Top Picks and Insights






Related Articles
Team that worked on the article
Aleksandra Chaikina has been a contributor to Traders Union since 2021. With over 15 years of experience in copywriting and more than 5 years focused on financial content, she specializes in producing detailed guides, analytics, and comparative reviews across various sectors, including cryptocurrencies, Forex, investment strategies, and financial technologies.
Ciaran Ryan is a veteran financial journalist based in South Africa, where he covers cryptocurrency, mining, stock markets, and governance for Moneyweb. He also hosts the weekly Moneyweb Crypto Podcast.
Chinmay Soni is a financial analyst with more than 5 years of experience in working with stocks, Forex, derivatives, and other assets. As a founder of a boutique research firm and an active researcher, he covers various industries and fields, providing insights backed by statistical data.
Scalping in trading is a strategy where traders aim to make quick, small profits by executing numerous short-term trades within seconds or minutes, capitalizing on minor price fluctuations.
Bitcoin is a decentralized digital cryptocurrency that was created in 2009 by an anonymous individual or group using the pseudonym Satoshi Nakamoto. It operates on a technology called blockchain, which is a distributed ledger that records all transactions across a network of computers.
CFD is a contract between an investor/trader and seller that demonstrates that the trader will need to pay the price difference between the current value of the asset and its value at the time of contract to the seller.
Index in trading is the measure of the performance of a group of stocks, which can include the assets and securities in it.
Ethereum is a decentralized blockchain platform and cryptocurrency that was proposed by Vitalik Buterin in late 2013 and development began in early 2014. It was designed as a versatile platform for creating decentralized applications (DApps) and smart contracts.

-
 Afghanistan
-
 Albania
-
 Algeria
-
 Angola
-
 Argentina
-
 Armenia
-
 Australia
-
 Austria
-
 Azerbaijan
-
 Bahamas
-
 Bahrain
-
 Bangladesh
-
 Belarus
-
 Belgium
-
 Bolivia
-
 Botswana
-
 Brazil
-
 Brunei
-
 Bulgaria
-
 Cambodia
-
 Cameroon
-
 Canada
-
 Chile
-
 China
-
 Colombia
-
 Congo
-
 Costa Rica
-
 Cote d'Ivoire
-
 Croatia
-
 Cuba
-
 Cyprus
-
 Czechia
-
 DR Congo
-
 Denmark
-
 Dominican Republic
-
 Ecuador
-
 Egypt
-
 El Salvador
-
 Estonia
-
 Eswatini
-
 Ethiopia
-
 Finland
-
 France
-
 Georgia
-
 Germany
-
 Ghana
-
 Greece
-
 Haiti
-
 Hong Kong
-
 Hungary
-
 India
-
 Indonesia
-
 Iran, Islamic republic
-
 Iraq
-
 Ireland
-
 Israel
-
 Italy
-
 Jamaica
-
 Japan
-
 Jordan
-
 Kazakhstan
-
 Kenya
-
 Korea
-
 Kuwait
-
 Kyrgyzstan
-
 Laos
-
 Latvia
-
 Lebanon
-
 Lesotho
-
 Libya
-
 Lithuania
-
 Luxembourg
-
 Madagascar
-
 Malaysia
-
 Malta
-
 Mauritius
-
 Mexico
-
 Moldova
-
 Mongolia
-
 Montenegro
-
 Morocco
-
 Mozambique
-
 Myanmar
-
 Namibia
-
 Nepal
-
 Netherlands
-
 New Zealand
-
 Nigeria
-
 North Macedonia
-
 Norway
-
 Oman
-
 Pakistan
-
 Palestine
-
 Panama
-
 Papua New Guinea
-
 Paraguay
-
 Peru
-
 Philippines
-
 Poland
-
 Portugal
-
 Puerto Rico
-
 Qatar
-
 Reunion
-
 Romania
-
 Rwanda
-
 Saudi Arabia
-
 Serbia
-
 Singapore
-
 Slovakia
-
 Slovenia
-
 Somalia
-
 South Africa
-
 Spain
-
 Sri Lanka
-
 Sweden
-
 Switzerland
-
 Syria
-
 Taiwan
-
 Tajikistan
-
 Tanzania
-
 Thailand
-
 Trinidad and Tobago
-
 Tunisia
-
 Turkey
-
 UAE
-
 Uganda
-
 Ukraine
-
 United Kingdom
-
United States
-
 Uruguay
-
 Uzbekistan
-
 Venezuela
-
 Vietnam
-
 Yemen
-
 Zambia
-
 Zimbabwe
- Forex
- Crypto










- What timeframe should beginners start with?
- Why 4-hour and daily charts can be easier for beginners
- Are short timeframes suitable for beginners?
- How much time can you spend trading?
- How to choose one timeframe and stick with it
- How to practice with a new timeframe
- Common timeframe mistakes beginners make
- Best Forex brokers for beginners
- Expert opinion
- Conclusion
- FAQs


