How To Use The Money Flow Index Indicator - Complete Guide


Editorial Note: While we adhere to strict Editorial Integrity, this post may contain references to products from our partners. Here's an explanation for How We Make Money. None of the data and information on this webpage constitutes investment advice according to our Disclaimer.
The Money Flow Index (MFI) is a powerful technical indicator that blends price and volume to gauge real buying and selling pressure behind market moves. Unlike RSI, which only tracks price momentum, MFI shows whether traders are actually supporting the move, helping identify overbought and oversold zones, divergences, and hidden strength before price action confirms it.
The Money Flow Index often gets lumped in with RSI, but that skips what makes it unique. Unlike RSI, which just reads price speed, MFI mixes volume and price in one read, and that one twist shifts how you use it. It is not just showing you the move, but also whether buyers are actually backing it. A stock can climb, but if the volume does not support it, MFI throws up a red flag. When price and flow don’t agree, that is not noise, that is where the edge actually starts. In this article, we will take a deep dive into the Money Flow Index, discussing its origin, calculation, and top strategies.
Understanding money flow index

The money flow index (MFI) is a technical indicator that blends volume and price to show whether money is flowing into or out of a market. Often called the volume-weighted relative strength index (RSI), the MFI is popular among traders who want to see not just how price is moving, but how strong the buying or selling pressure really is behind that move.
This tool helps spot overbought and oversold conditions, confirms price trends, and can highlight potential reversals early. It's especially useful in markets where volume data is reliable, such as stocks, futures, and commodities.
What is MFI?
The MFI is a momentum indicator that uses both price and volume to measure buying and selling pressure. Unlike indicators that rely solely on price, the MFI looks at how much trading activity is happening and where the price closes within its daily range. This gives traders a more complete view of market strength.
Origins and purpose of the MFI
The MFI was developed by Gene Quong and Avrum Soudack as a way to improve upon the RSI by factoring in volume. Their idea was that strong price moves mean more when there’s real participation behind them. So, they built the MFI to reflect that extra detail.
Why it was created
RSI was useful, but it didn’t consider volume.
The creators wanted a tool that measured both price momentum and market interest.
By using volume, the MFI adds depth and can catch signals that price-only tools might miss.
Where it works best
Stock markets and futures, where real volume data is available.
Swing trading or position trading setups.
Confirming overbought or oversold conditions in trending or ranging markets.
Why it’s still popular
Gives early warnings before price changes direction.
Easy to read, with a simple range from 0 to 100.
Works well with other indicators and chart patterns.
Understanding the MFI formula
The money flow index might sound complicated at first, but it follows a clear, step-by-step formula. Knowing how it’s calculated helps you trust the signals it gives and understand what’s really happening when the index moves up or down. You don’t need to memorize the math, but getting familiar with the process can improve your analysis and give you more confidence in your trades.
Step-by-step breakdown
Typical price
This is the average of the high, low, and close for a single period.
Formula:
(High + Low + Close) ÷ 3
Raw money flow
Multiply the typical price by the volume for that period.
Formula:
Typical Price × Volume
Label money flow as positive or negative
- If today’s typical price is greater than yesterday’s, it’s a positive money flow.
- If it’s lower, it’s a negative money flow.
Add up money flows over the last 14 periods
- Total all positive money flow values.
- Total all negative money flow values.
Calculate the money flow ratio
Formula:
Money Flow Ratio = Total Positive Money Flow ÷ Total Negative Money Flow
Convert to the MFI
Formula:
MFI = 100 − (100 ÷ (1 + Money Flow Ratio))
What the final number means
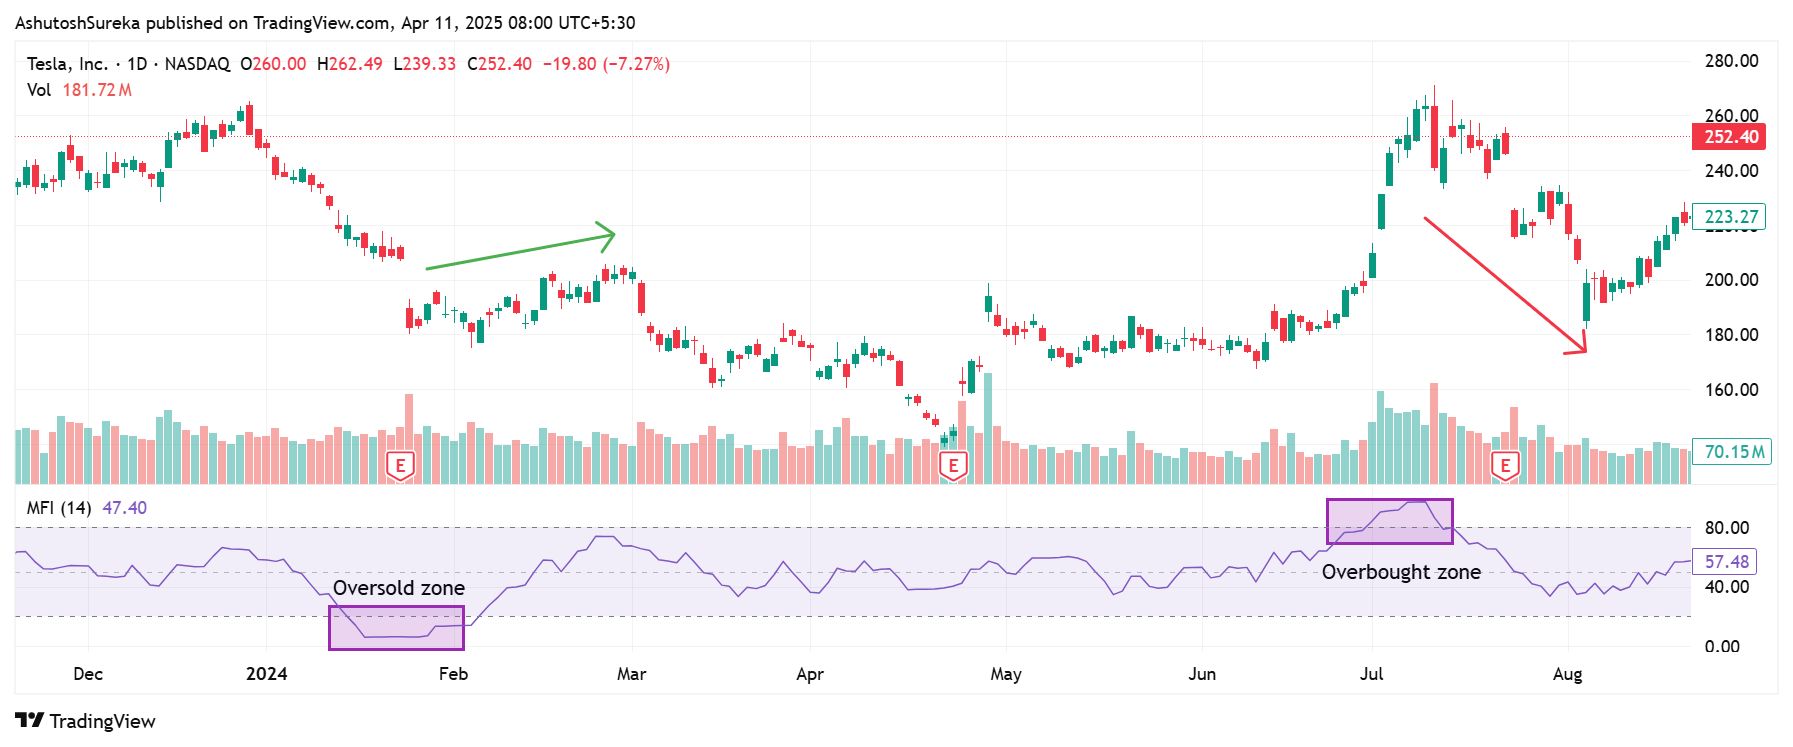
Above 80 usually means the asset is overbought.
Below 20 often signals it’s oversold.
MFI values between 40 and 60 suggest a neutral zone.
Sudden changes or divergences between MFI and price often signal upcoming moves.
How to set up money flow index indicator
The money flow index (MFI) is easy to add to most charting platforms. Whether you’re using MetaTrader, TradingView, or a broker’s custom terminal, the setup only takes a few clicks. Once it’s added, you can tweak a few settings to match your style and make it easier to read. Getting it set up properly helps you use it more confidently and avoid missing key signals.
Access the indicator
Adding the money flow indicator to your chart is fast and straightforward.
How to do it
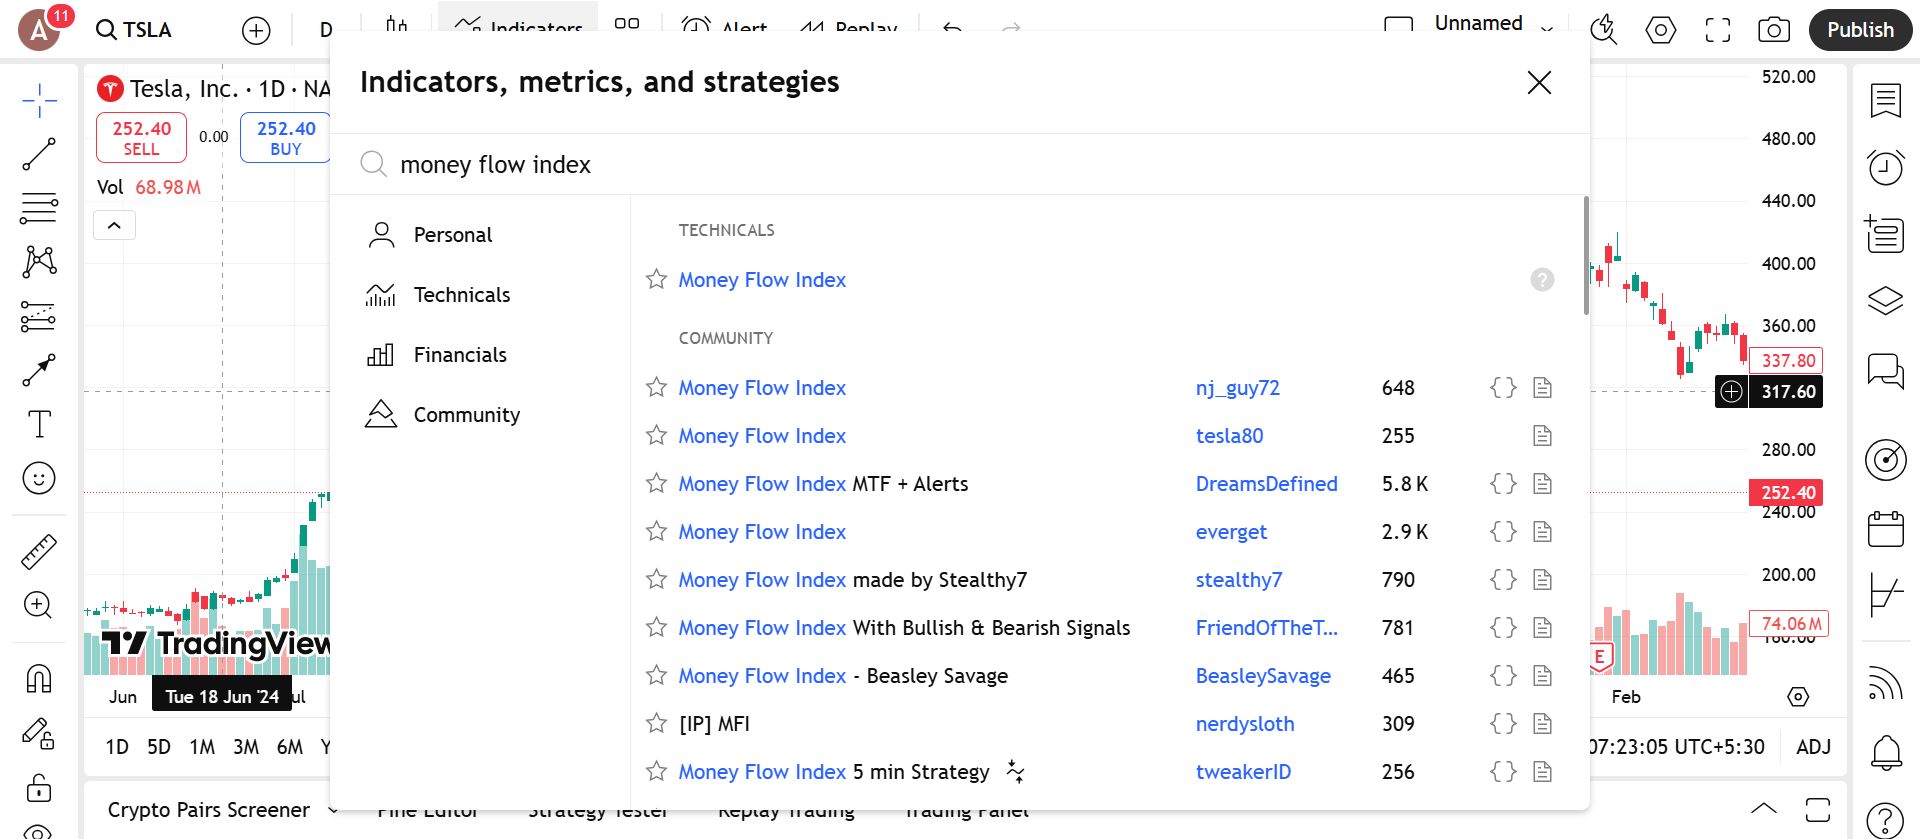
Open the indicators menu in your charting platform.
Type Money Flow Index in the search bar.
Click to apply it. Line will appear below your main chart in a separate pane.
Where it’s available
Pre-installed on TradingView, MetaTrader 4 and 5, ThinkorSwim, and most other charting tools.
No external downloads or plug-ins are required.
Configure the parameters
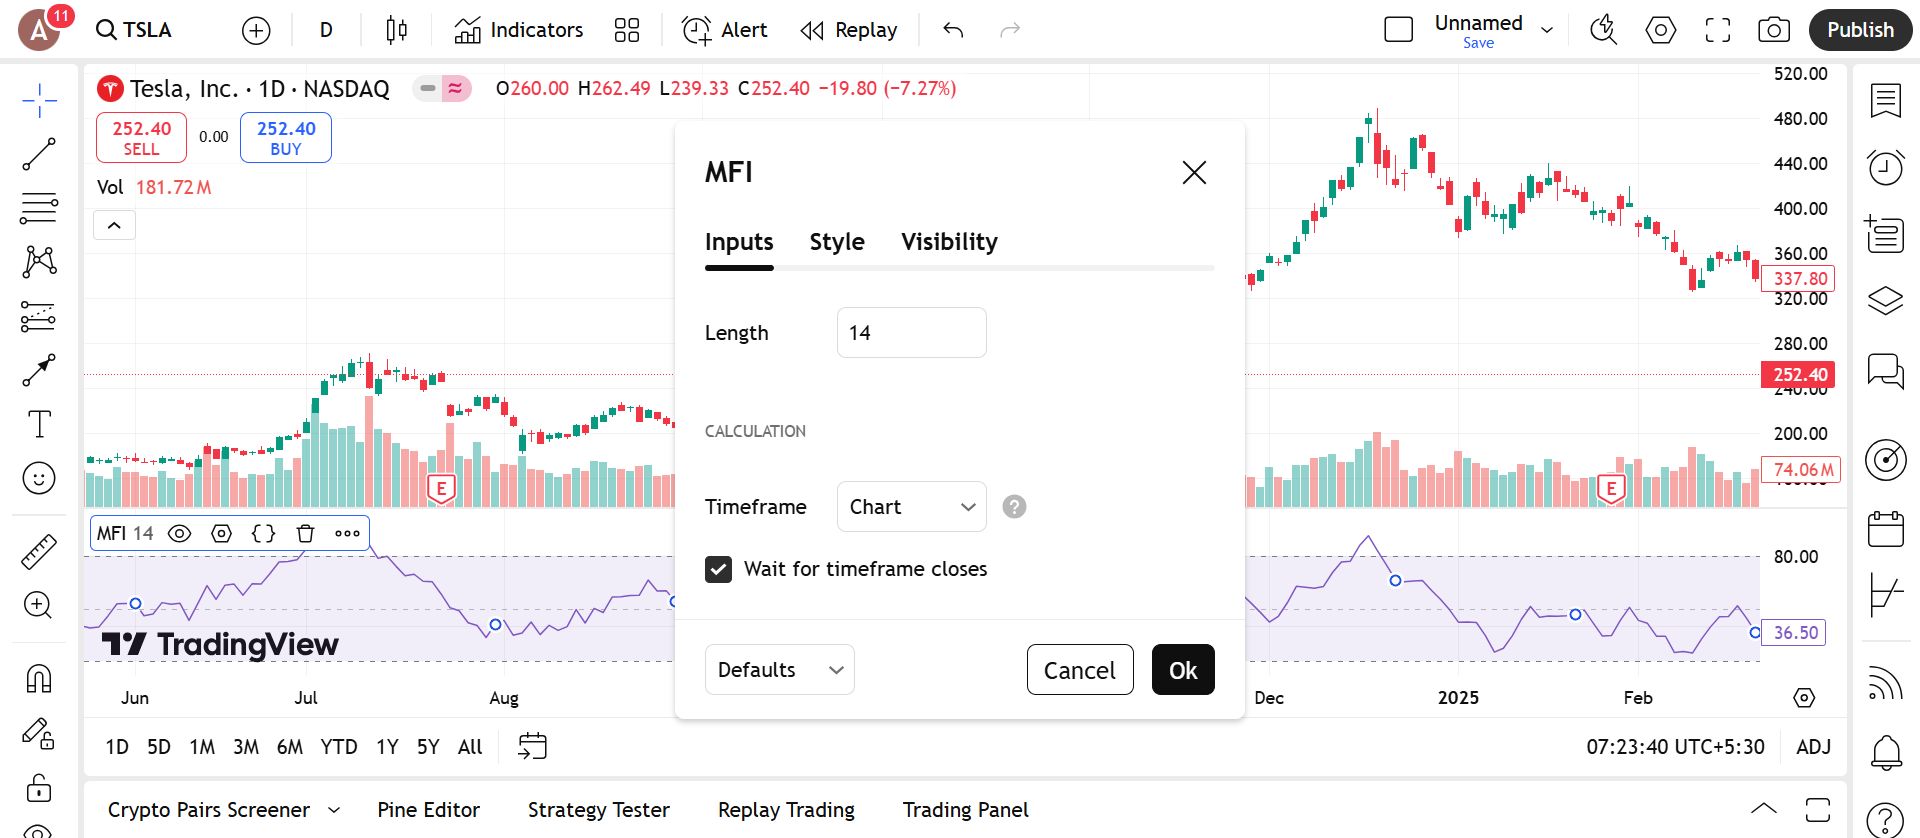
Once the indicator is added, you can adjust the settings to make it more comfortable to use. Most traders stick with the default values, but making a few visual tweaks can help you read the signals more easily.
What you can change
Lookback period
The default is 14 periods. You can shorten it for quicker signals or increase it for smoother readings.Overbought and oversold levels
Many platforms let you change the horizontal lines that mark these zones. Typically set at 80 (overbought) and 20 (oversold).Colors and line thickness
Customize the indicator’s appearance to match your chart layout. A bolder line or stronger color contrast can make the MFI easier to spot.Scale and placement
Keep the MFI in its own panel below the price for better visibility, especially when comparing MFI movement to price action.
Tips for better use
Stick with the 14-period unless you have a reason to change.
Use color-coded zones (green for oversold, red for overbought) to catch signals faster.
Combine with support and resistance or candlestick patterns for better entries.
Trading strategies using money flow index
Because it also acts like a momentum indicator, the MFI works well for spotting reversals, confirming trends, and timing entries based on strength or weakness in the market.
Overbought and oversold reversal strategy
This is the most straightforward way to use the MFI — look for extreme levels that often lead to a change in direction.
How to apply it
Look for MFI values above 80 (overbought) or below 20 (oversold).
Wait for the MFI to reverse direction and move back toward the middle range.
Confirm with price action like a support or resistance bounce, or a candlestick pattern.
Enter once reversal signs are clear and place a stop near the last high or low.
Why it works
Shows when a move may be running out of steam.
Combines volume and price for a stronger reversal signal.
Helps avoid chasing trends that are about to slow down.
MFI and trend continuation strategy
The MFI can also be used to stay with a trend by confirming the strength behind each pullback or breakout.
How to apply it
In an uptrend, watch for the MFI to stay above 50, even during dips.
When price pulls back and the MFI holds up, it's a sign of hidden strength.
Buy when price resumes upward and MFI stays firm.
In a downtrend, do the opposite — look for MFI to stay below 50 and resume lower.
Why it works
Helps avoid exiting too early in a strong trend.
Gives you a way to re-enter during a pullback.
Keeps you trading in the direction of momentum.
Divergence strategy
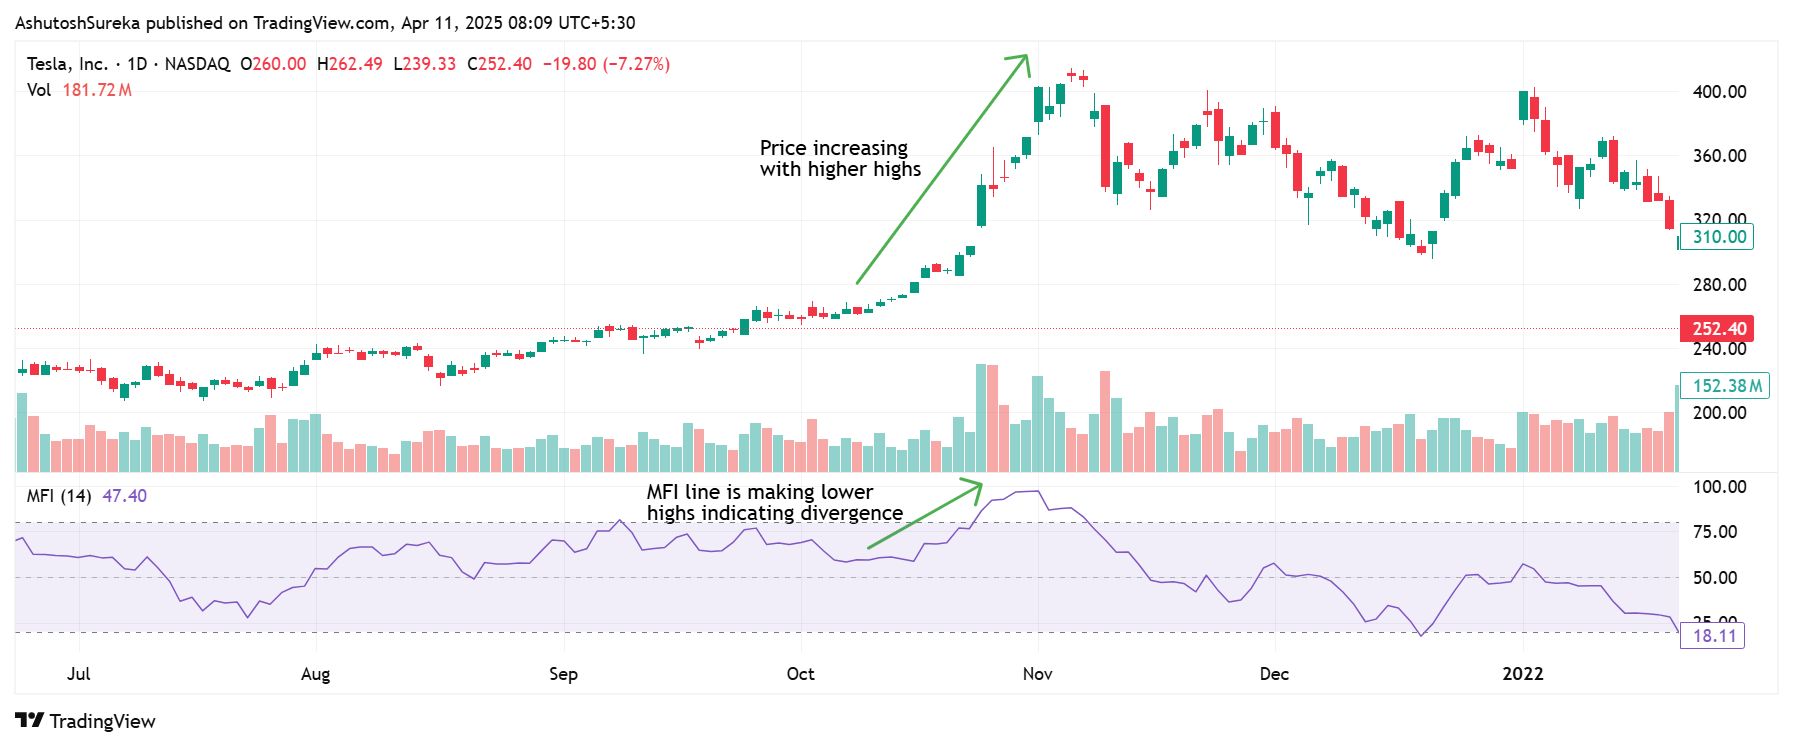
Divergence between MFI and price can be a powerful early signal that momentum is shifting, even if the chart hasn’t reacted yet.
How to apply it
If price makes a new high but the MFI makes a lower high, that’s bearish divergence.
If price makes a new low but the MFI forms a higher low, that’s bullish divergence.
Use this signal to prepare for reversals and look for confirmation in price.
Works well near key support and resistance levels.
Why it works
Highlights when volume doesn’t support the latest price move.
Gives advance warning of a slowdown or reversal.
Helps you enter before momentum fully turns.
MFI breakout confirmation strategy
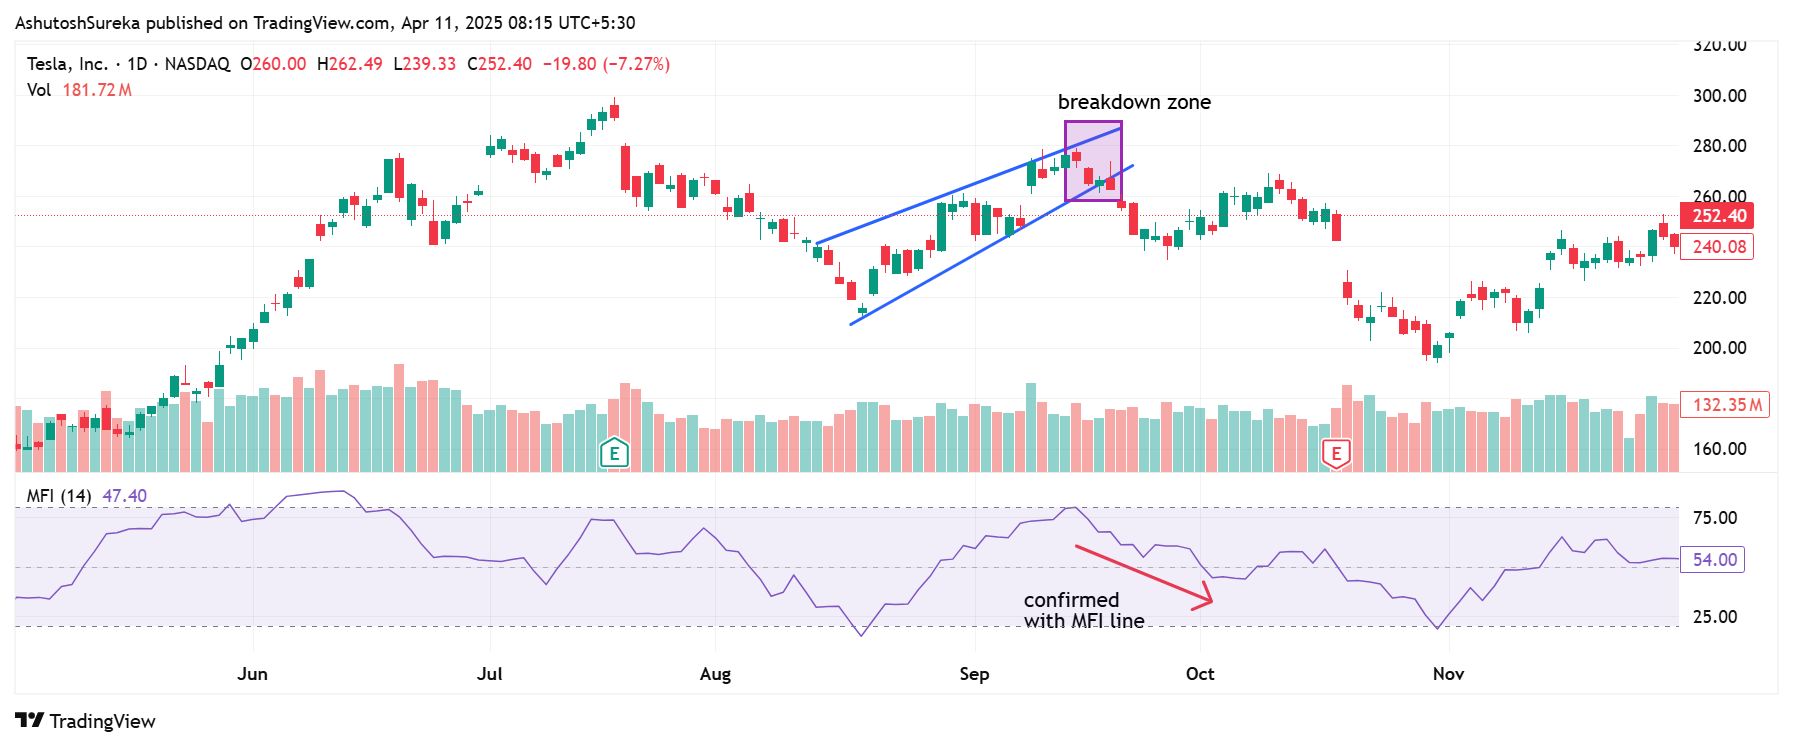
Use the MFI to check if a breakout is backed by real interest or just noise.
How to apply it
Draw resistance or support lines on your chart.
When price breaks out, check if MFI is also rising (for upside breakouts) or falling (for downside breakouts).
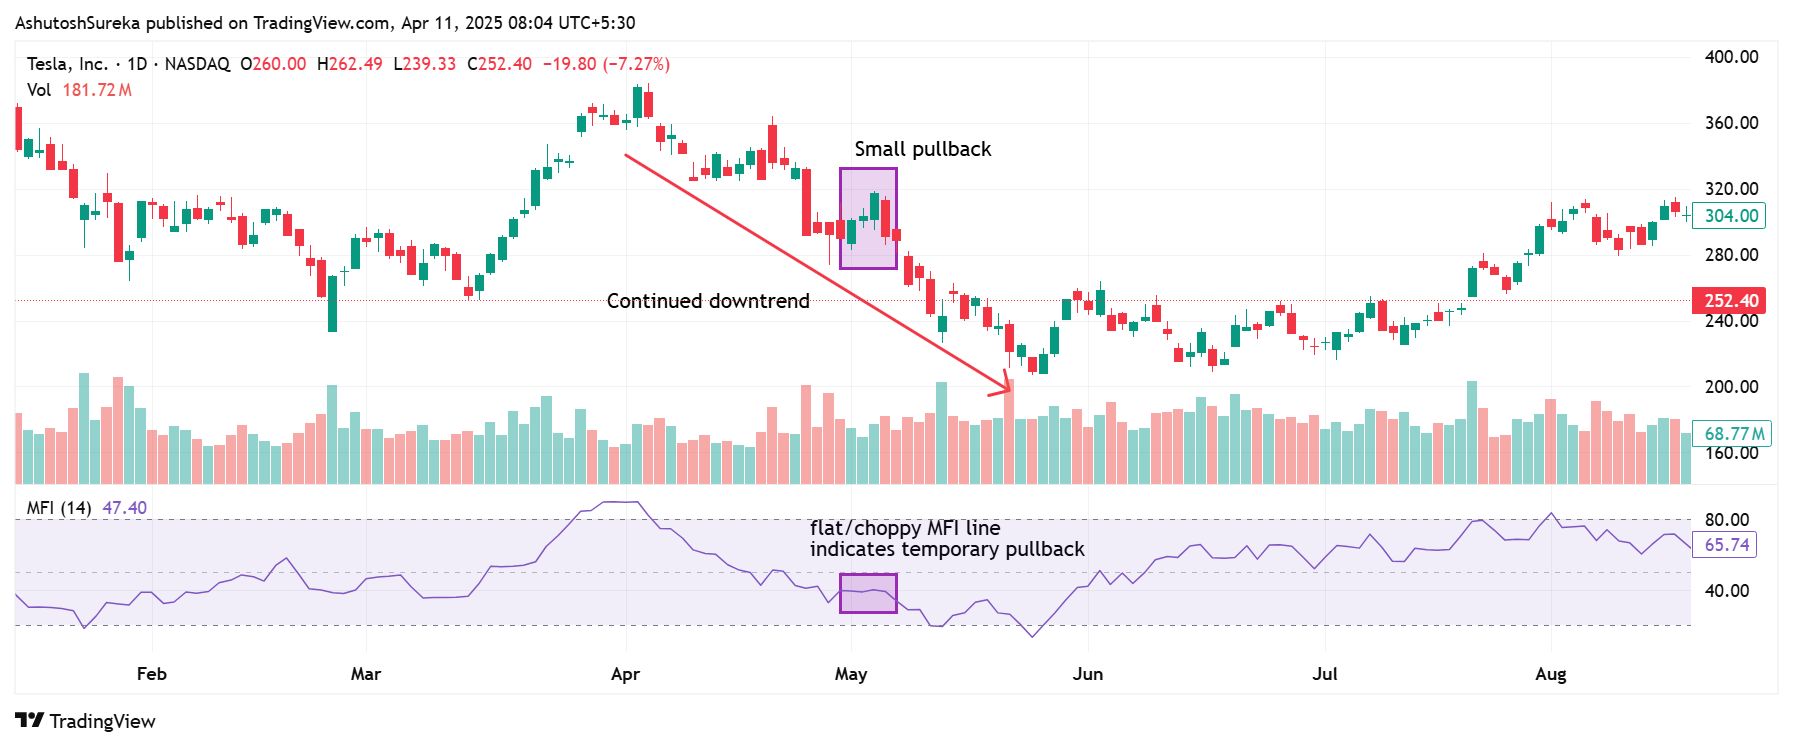
If MFI stays flat or moves opposite to price, the breakout might fail.
Enter only if price and MFI move together.
Why it works
Adds confirmation that the breakout has volume and strength behind it.
Helps avoid false breakouts that quickly reverse.
Simple way to combine volume with technical setups.
If your trading strategy relies heavily on technical indicators, choosing a broker that supports TradingView, MT5, or cTrader can significantly enhance your experience. These platforms offer an extensive array of charting tools and indicators, accommodating virtually any trading approach. In the table below, we’ve highlighted the top brokers that provide access to these platforms — helping you easily evaluate and select the one that best fits your needs:
| Currency pairs | Crypto | Stocks | Min. deposit, $ | Max. leverage | TradingView | MT5 | cTrader | Regulation | TU overall score | Open an account | |
|---|---|---|---|---|---|---|---|---|---|---|---|
| 90 | Yes | Yes | No | 1:500 | Yes | Yes | Yes | ASIC, FCA, DFSA, BaFin, CMA, SCB, CySec | 7.17 | Open an account Your capital is at risk.
|
|
| 52 | Yes | Yes | 25 | 1:1000 | No | Yes | Yes | MISA, FSC (Mauritius) | 8.2 | Open an account Your capital is at risk. |
|
| 70 | Yes | Yes | 100 | 1:500 | No | Yes | Yes | FCA, CYSEC, FSCA, SCB, FSA (Seychelles) | 7.9 | Open an account Your capital is at risk. |
|
| 56 | Yes | Yes | 50 | 1:1000 | No | Yes | Yes | CySEC, FSC (Mauritius), SVG FSA | 7.87 | Open an account Your capital is at risk. |
|
| 61 | Yes | Yes | 200 | 1:500 | Yes | Yes | Yes | ASIC, CySEC, and FSA | 7.46 | Open an account Your capital is at risk. |
We at Traders Union have analyzed financial markets for over 14 years, evaluating brokers based on 250+ transparent criteria, including security, regulation, and trading conditions. Our expert team of over 50 professionals regularly updates a Watch List of 500+ brokers to provide users with data-driven insights. While our research is based on objective data, we encourage users to perform independent due diligence and consult official regulatory sources before making any financial decisions. Learn more about our methodology and editorial policies.Why trust us
Pros and cons of money flow index indicator
- Pros
- Cons
It blends price and volume for deeper insight. Unlike basic momentum tools, the MFI uses volume to show how strong a move really is, helping you spot when price action is backed by real interest.
It’s great for catching potential reversals. With clear overbought and oversold zones, the MFI often gives you a heads-up before a trend starts to turn.
It works across different markets. Whether you’re trading stocks, commodities, or Forex (with tick volume), the MFI holds up well and stays relevant.
It’s visual and easy to follow. The 0–100 range with defined extremes makes it simple to spot stretched conditions and momentum shifts at a glance.
It depends on accurate volume data. In markets like Forex where only tick volume is available, the MFI can lose reliability and may not reflect true buying or selling pressure.
It can give signals too early. Overbought or oversold readings might show up before the market is actually ready to turn, especially during strong, trending moves.
It’s not built to stand alone. The MFI works best when combined with support and resistance, candlestick patterns, or trend filters to confirm what it’s showing.
It struggles with low-volume assets. In thin or erratic markets, the MFI can get distorted, leading to signals that are hard to trust or interpret.
Real MFI setups happen in the quiet zones

Most traders lean on MFI for signals at the extremes but the best trades usually show up when MFI is working under the radar. If price is just drifting sideways but MFI starts rising slowly that is your early hint that money is flowing in while no one’s watching. These are the moves that hit fast and catch people off. You are not waiting for MFI to flash a number. You are using it to feel what is happening before it breaks.
Another shift that changes how you use MFI is to stop waiting for alerts and start reading it like a strength check. Compare the slope of MFI to how the price is moving. If price climbs but MFI barely lifts or rolls over early you are likely seeing a weak move pretending to be strong. And if price dips but MFI holds steady or even ticks up that is a quiet buying you should not ignore. It is not about hitting a threshold. The angle gives you the feel before the chart confirms it.
Conclusion
The Money Flow Index is not about chasing reversals. It is about checking how strong the move really feels before it shows up in the candles. If you only use it at the edges you are missing its real value. MFI helps you spot when things are off before anyone talks about it. It shows you whether the move has real power or if it is running on empty. And when you learn to notice those shifts early you stop reacting and start getting ahead of the trade.
FAQs
Is the Money Flow Index indicator better than RSI?
The Money Flow Index (MFI) and RSI serve similar purposes, but MFI includes volume in its calculation, making it potentially more informative in certain conditions. Whether it is better depends on the trader’s strategy and the asset being analyzed.
What is the MFI index indicator?
The Money Flow Index is a momentum indicator that uses both price and volume to identify overbought or oversold conditions. It helps gauge the strength of money flowing in and out of an asset over a specific period.
Does MFI indicator work for long term investing?
Yes, the MFI can support long-term investing by highlighting accumulation or distribution trends over time. However, it’s most effective when combined with other indicators and fundamental analysis.
Can the Money Flow Index indicator be used in all markets including Forex?
Yes, MFI can be used across various markets, including Forex. In Forex trading, tick volume is typically used in place of real volume, but the indicator still offers valuable insights.
Related Articles
Team that worked on the article
Andrey Mastykin is an experienced author, editor, and content strategist who has been with Traders Union since 2020. As an editor, he is meticulous about fact-checking and ensuring the accuracy of all information published on the Traders Union platform. Andrey focuses on educating readers about the potential rewards and risks involved in trading financial markets.
He firmly believes that passive investing is a more suitable strategy for most individuals. Andrey's conservative approach and focus on risk management resonate with many readers, making him a trusted source of financial information.
Also, Andrey is a member of the National Union of Journalists of Ukraine (membership card No. 4574, international certificate UKR4492).
Chinmay Soni is a financial analyst with more than 5 years of experience in working with stocks, Forex, derivatives, and other assets. As a founder of a boutique research firm and an active researcher, he covers various industries and fields, providing insights backed by statistical data. He is also an educator in the field of finance and technology.
As an author for Traders Union, he contributes his deep analytical insights on various topics, taking into account various aspects.
Mirjan Hipolito is a journalist and news editor at Traders Union. She is an expert crypto writer with five years of experience in the financial markets. Her specialties are daily market news, price predictions, and Initial Coin Offerings (ICO).
Breakout trading is a trading strategy that focuses on identifying and profiting from significant price movements that occur when an asset's price breaches a well-defined level of support or resistance.
Swing trading is a trading strategy that involves holding positions in financial assets, such as stocks or forex, for several days to weeks, aiming to profit from short- to medium-term price swings or "swings" in the market. Swing traders typically use technical and fundamental analysis to identify potential entry and exit points.
Fundamental analysis is a method or tool that investors use that seeks to determine the intrinsic value of a security by examining economic and financial factors. It considers macroeconomic factors such as the state of the economy and industry conditions.
Xetra is a German Stock Exchange trading system that the Frankfurt Stock Exchange operates. Deutsche Börse is the parent company of the Frankfurt Stock Exchange.
Day trading involves buying and selling financial assets within the same trading day, with the goal of profiting from short-term price fluctuations, and positions are typically not held overnight.


-
 Afghanistan
-
 Albania
-
 Algeria
-
 Argentina
-
 Armenia
-
 Australia
-
 Austria
-
 Azerbaijan
-
 Bahamas
-
 Bahrain
-
 Bangladesh
-
 Belgium
-
 Botswana
-
 Brazil
-
 Brunei
-
 Bulgaria
-
 Burma
Burma
-
 Cambodia
-
 Cameroon
-
 Canada
-
 Chile
Chile
-
 China
China
-
 Colombia
-
 Costa Rica
-
 Cote d'Ivoire
-
 Croatia
-
 Cyprus
-
 Czech Republic
-
 Denmark
-
 Dominican Republic
-
 Ecuador
-
 Egypt
Egypt
-
 Estonia
-
 Eswatini
-
 Ethiopia
-
 Finland
-
 France
-
 Georgia
-
 Germany
-
 Ghana
Ghana
-
 Greece
-
 Haiti
Haiti
-
 Hong Kong
-
 Hungary
-
 India
India
-
 Indonesia
-
 Iran, Islamic republic
-
 Iraq
Iraq
-
 Ireland
-
 Israel
-
 Italy
Italy
-
 Jamaica
-
 Japan
Japan
-
 Jordan
-
 Kazakhstan
-
 Kenya
Kenya
-
 Korea
Korea
-
 Kuwait
-
 Kyrgyzstan
-
 Laos
Laos
-
 Latvia
-
 Lebanon
-
 Libyan Arab Jamahiriya
-
 Lithuania
-
 Luxembourg
-
 Macedonia
-
 Madagascar
-
 Malaysia
-
 Malta
Malta
-
 Mauritius
-
 Mexico
-
 Moldova
-
 Mongolia
-
 Montenegro
-
 Morocco
-
 Mozambique
-
 Namibia
-
 Nepal
Nepal
-
 Netherlands
-
 Nigeria
-
 Norway
-
 Oman
Oman
-
 Pakistan
-
 Palestine
-
 Papua New Guinea
-
 Peru
Peru
-
 Philippines
-
 Poland
-
 Portugal
-
 Puerto Rico
-
 Qatar
Qatar
-
 Romania
-
 Rwanda
-
 Saudi Arabia
-
 Serbia
-
 Singapore
-
 Slovakia
-
 Slovenia
-
 Somalia
-
 South Africa
-
 Spain
Spain
-
 Sri Lanka
-
 Sweden
-
 Switzerland
-
 Syrian Arab Republic
-
 Taiwan
-
 Tajikistan
-
 Tanzania, United Republic Of
-
 Thailand
-
 Trinidad and Tobago
-
 Tunisia
-
 Turkey
-
 UAE
UAE
-
 Uganda
-
 Ukraine
-
 United Kingdom
-
United States
-
 Uzbekistan
-
 Venezuela
-
 Vietnam
-
 Yemen
Yemen
-
 Zambia
-
 Zimbabwe
- Forex
- Crypto
