Seasonal Anomalies In The Stock Market And How To Trade Them


Editorial Note: While we adhere to strict Editorial Integrity, this post may contain references to products from our partners. Here's an explanation for How We Make Money. None of the data and information on this webpage constitutes investment advice according to our Disclaimer.
Seasonal anomalies in the stock market are recurring calendar-based patterns, like the January Effect or late-December tax-bounce setups, driven by institutional behavior, fund flows, and trader psychology. While some old patterns have faded, hidden opportunities still exist — especially around earnings clusters, fund rebalancing, and year-end positioning — if you know where to look.
When most traders hear "calendar-driven patterns," their minds jump to the usual suspects — Santa rallies or the old “Sell in May” adage. But that’s just surface noise. The real edge lies in the less obvious setups tucked inside earnings clusters, fund rebalancing periods, and the subtle shifts in tax positioning during the final days of December. These patterns don’t make headlines or get airtime on financial news — they’re buried deep in order flow and the timing of execution. This isn’t about rehashing seasonal clichés. It’s about uncovering those oddly reliable setups that continue to fly under the radar.
Risk warning: All investments carry risk, including potential capital loss. Economic fluctuations and market changes affect returns, and 40-50% of investors underperform benchmarks. Diversification helps but does not eliminate risks. Invest wisely and consult professional financial advisors.
Understanding seasonal anomalies in the stock market

Sometimes, the stock market moves in ways that seem to follow the calendar. These aren’t the big economic cycles we hear about every day — they’re smaller patterns that show up year after year, often around the same months or events. These patterns are called seasonal anomalies, and they can give investors a useful edge — if they know where to look.
Definition and concept
Seasonal anomalies are stock market trends that tend to show up at the same time every year, no matter what the economy is doing.
Unlike market cycles, which are tied to things like interest rates or GDP growth, seasonal anomalies are timing-based.
They’re often driven by things like tax deadlines, investor behavior, or fund activity — not fundamentals.
Some common examples:
January effect – small-cap stocks often rebound after year-end tax-loss selling.
Sell in May – many investors lighten up in summer, leading to slower returns between May and October.
Holiday rallies – stocks tend to rise around major holidays, as lighter trading volume and positive sentiment take hold.
These patterns don’t work every year — but they’ve happened often enough to make people pay attention.
Why they matter for investors
Even though seasonal anomalies aren’t sure things, they can help investors spot opportunities or avoid pitfalls.
They reflect real human behavior, like investors rebalancing before year-end or avoiding risk in the summer.
Traders use them to plan when to enter or exit a position — especially in short-term strategies.
Big institutions often trade in ways that reinforce these patterns, which means they can shape market movement on their own.
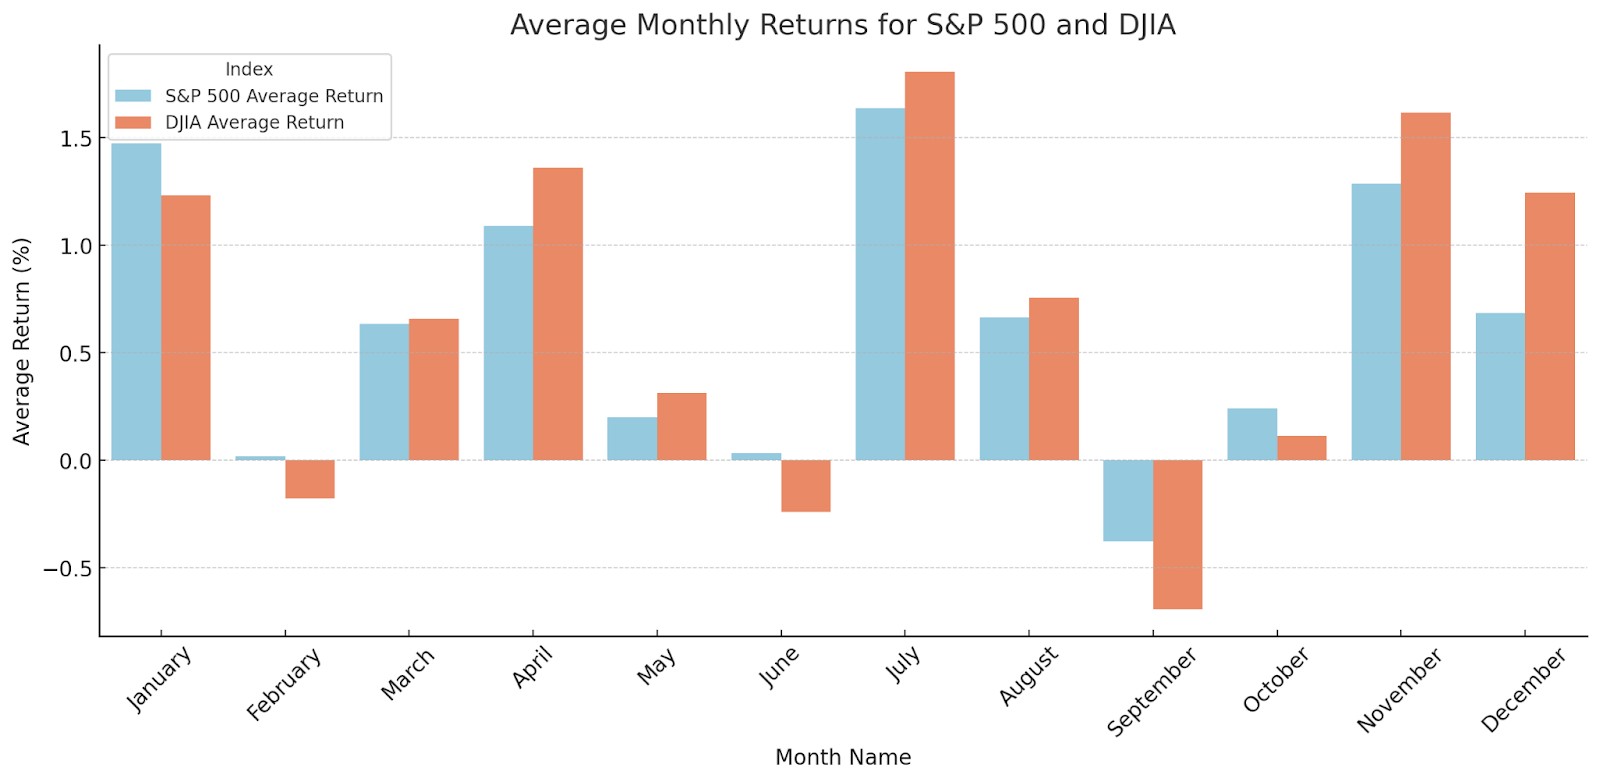
The January effect
Every January, many investors look for the same thing: a fresh rally to kick off the year. The idea that stocks — especially small ones — tend to bounce in January is called the January effect, and while it doesn’t happen every time, it’s been noticeable enough to become one of the most talked-about seasonal patterns in the market.
What is the January effect
The January effect is the tendency for stocks, particularly small-cap stocks, to rise during the early part of January. This bump usually shows up in the first couple of weeks and is more common in companies that had been beaten down the month before.
It’s more noticeable in smaller, less-traded stocks, which are more sensitive to buying pressure.
For many investors, January is a chance to reset and reposition for the new year — leading to more trades and a spike in demand.
This rally often happens without any big news or earnings, which makes it stand out.
Theories behind the anomaly
There’s no single reason the January effect exists, but a few ideas keep coming up:
Tax-loss selling. In December, investors dump losing stocks to offset gains. In January, they buy them back, lifting prices.
Portfolio cleanup. Fund managers tidy up at year-end and start the new year by buying back into riskier or overlooked stocks.
Fresh optimism. A new year brings new money and new goals, and many investors are ready to buy.
Bonus season. Investors getting year-end bonuses may put that money to work right away, often in the first weeks of January.
Basically, it’s a mix of money flows, habit, and psychology that helps drive the pattern.
Historical performance
Back in the 1970s and 1980s, the January effect was hard to ignore. Small-cap stocks regularly outperformed during the month, and investors even built strategies around it.
In early studies, most of the outperformance in small stocks for the entire year happened in January alone.
Over time, though, as more people caught on, the effect has faded.
In the last 20 years, the January rally has been hit-or-miss — but it still shows up in certain years, especially after rough Decembers.
So while it’s not a sure thing anymore, the January effect remains a useful pattern to keep on the radar, particularly for those looking to trade short-term momentum.
Sell in May and go away
It’s one of those old trader adages that keeps showing up for a reason. “Sell in May and go away” might sound like folklore, but there’s a surprising amount of historical weight behind it. The core idea is simple — summer months often deliver weaker stock returns, so stepping back until fall could be a smart seasonal play.
The concept explained
This strategy suggests that investors should lighten up on stocks in May and get back in around November. The reason? Historically, the summer months have produced lower returns compared to the rest of the year.
The phrase comes from an old British saying that ends with “...and come back on St. Leger’s Day,” which falls in mid-September.
During the summer, markets tend to slow down — trading volume drops, fewer big decisions get made, and investors are more focused on vacations than earnings.
That lull has often meant fewer gains — and sometimes more volatility.
In contrast, the stretch from November to April has historically been more productive for stock returns, making it a preferred time for many seasonal investors.
Supporting historical evidence
Plenty of market studies have looked into this pattern — and many have found that there’s something to it.
From the 1950s to the early 2000s, the U.S. stock market saw the bulk of its yearly gains come between November and April.
The summer months, from May through October, lagged behind — not necessarily crashing, but offering smaller and less consistent returns.
The trend has also been seen in international markets, including the UK and Europe.
That said, in more recent years, the difference between the two periods has narrowed, likely due to changes in how markets operate, with more data-driven and round-the-clock trading.
Still, many investors and traders keep the saying in mind — not as a strict rule, but as a seasonal guideline that might help with timing and risk management.
Other seasonal market patterns worth knowing
Stock markets have their own rhythm — and it goes deeper than just months or quarters. Certain times of the month or even specific weekdays tend to behave a little differently, thanks to a mix of investor habits, fund flows, and timing quirks. These aren’t rules to trade on blindly, but they’re useful patterns to have in your toolkit.
September effect
Of all the months on the calendar, September has the worst track record for stock performance — and it’s not just a fluke.
Over decades, September has seen more down months than any other.
No single reason explains it, but it’s likely tied to:
Investors getting back to business after summer.
Funds rebalancing portfolios.
Traders getting cautious before Q4.
It’s not a guaranteed slump, but when the pattern shows up, it can lead to choppy or sluggish performance.
So if your portfolio seems a little slow in September, you’re not imagining it — history is on your side.
Turn-of-the-month effect
Stocks often do a little better at the very end of one month and the start of the next. It’s called the turn-of-the-month effect, and it shows up in all kinds of markets.
The boost tends to happen in the last few trading days and the first few of the next month.
Why? Likely reasons include:
Automatic investments hitting the market (like 401(k) contributions).
Fund managers making tweaks to balance their books.
A bit of “window dressing” to make portfolios look good on paper.
It’s not a massive move, but it’s noticeable enough that some short-term traders watch for it.
Day-of-the-week effect
Even within a single week, stock performance isn’t evenly spread.
Mondays often come with lower returns, possibly because:
Traders digest bad news from over the weekend.
It’s the start of the week — momentum hasn’t kicked in yet.
Fridays, by contrast, tend to bring positive returns, thanks to:
End-of-week optimism.
Traders wrapping up positions.
Light volume pushing prices higher.
It’s not as strong as it once was, but the pattern still shows up from time to time — and can be a useful signal for short-term traders.
Are seasonal anomalies still profitable today?
Everyone loves a good pattern — especially one that seems to help time the market. But in today’s world of algorithms, instant data, and global traders, do seasonal anomalies still work? The short answer: sometimes. They’re not the goldmine they used to be, but they’re not totally useless either — if you know where and when to look.
Arbitrage and fading patterns
The more people notice a seasonal trend, the more they try to get ahead of it — and that usually kills the opportunity.
Hedge funds and algorithms now jump on these patterns early, sometimes even before the month begins.
That early buying or selling dampens the move, or shifts it so it happens before the calendar says it should.
It’s a classic case of too many people chasing the same play — and it waters down the results.
So while things like the January effect still show up now and then, they’re less profitable because too many eyes are watching.
Market efficiency and predictive value
Today’s markets are faster and more efficient — but they’re still run by people. That means behavior, habits, and money flows still create patterns.
Seasonal trends don’t offer easy wins anymore, but they can help frame expectations.
Knowing September tends to be weak, for example, might help you stay calm in a dip instead of panicking.
They can also help you fine-tune your timing, especially if they line up with other signals like earnings reports or economic data.
So no, you can’t blindly follow seasonal patterns — but used with other tools, they can still give you a small edge.
Situations where anomalies still show strength
Seasonal patterns may not dominate headlines anymore, but they haven’t disappeared — they’ve just become more selective and context-driven.
Small-cap stocks still respond to year-end and January flows, especially in quiet markets.
During volatile or emotional years, investors fall back on old habits, and seasonal trends can return with force.
Certain sectors — like retail during the holidays or energy during winter — still follow the calendar.
In markets with less high-speed trading — like some emerging economies — the patterns can be more pronounced.
So while they won’t build your whole strategy, these patterns can help you spot timing windows, reduce risk, or squeeze out a little extra upside.
We’ve also selected a list of reliable brokers that can help you take advantage of seasonal market patterns with the right tools and execution support.
| eToro USA | Plus500 | eOption | Revolut | Interactive Brokers | |
|---|---|---|---|---|---|
|
Foundation year |
2007 | 2008 | 2007 | 2015 | 1978 |
|
Account min. |
50 | EUR500 | No | No | No |
|
Demo |
Yes | Yes | Yes | No | Yes |
|
Deposit Fee |
No | No | Not specified | No | No |
|
Withdrawal fee |
No | No | Not specified | No charge up to a limit | No |
|
Inactivity fee |
No | No | Not specified | Not specified | No |
|
Android |
Yes | Yes | Yes | Yes | Yes |
|
iOS |
Yes | Yes | Yes | Yes | Yes |
|
Regulation |
SEC, FINRA | CySEC, FCA, ASIC, FMA, FSCA, FSA Seychelles, EFSA, MAS, DFSA, SCB | FINRA, SIPC | FCA, SEC, FINRA | SEC, FINRA, SIPC, FCA, NSE, BSE, SEBI, SEHK, HKFE, IIROC, ASIC, CFTC, NFA |
|
TU overall score |
8.8 | 8.48 | 7.93 | 8.6 | 8.53 |
|
Open an account |
Go to broker Your capital is at risk. |
Go to broker 80% of retail CFD accounts lose money. |
Study review | Study review | Study review |
The hidden rhythm behind mid-month and year-end trades

Here’s something beginners rarely get told: the middle of the month, especially a couple of days after options expiration, often sees a low-key surge in volume. If you line up SPY or sector ETFs against fund flow data, you’ll notice a subtle buying pressure that pretty consistently shows up. It’s not magic — it’s just how pensions and big asset managers move money. If you know when those flows usually hit, you can get in ahead of it and avoid chasing a move that’s already started.
Another less talked-about advantage? Late December trading — specifically, the final few sessions before the year ends. Everyone focuses on tax-loss selling, but barely anyone watches the bounce. Bigger players quietly step in during those last days to scoop up quality names that were sold off just to lock in tax losses. A lot of traders wait for January to jump in, but by then, the move has already started. The real window opens before the new year even begins.
Conclusion
Seasonal anomalies in the stock market aren’t just old sayings — they’re based on recurring behaviors from institutional investors, fund managers, and retail traders. While you can't rely on these patterns alone, understanding why they occur — like fund rebalancing, tax strategies, or predictable investor psychology — can give you an edge.
Instead of blindly following a calendar, focus on the timing of money flow and how large players shift their positions. Recognizing these subtle patterns, especially during mid-month periods or year-end repositioning, can help you better time entries, manage risk, and enhance returns.
Seasonal trends may not be as obvious in today’s fast-moving markets, but they’re far from gone. The real edge lies in spotting these recurring setups early — and combining them with broader market signals to trade with more confidence.
FAQs
How reliable are seasonal patterns for long-term investing?
Seasonal patterns can offer insights, but they are not always reliable for long-term investing. Market fundamentals, economic conditions, and global events usually outweigh seasonal trends over time.
Are seasonal effects disappearing due to high-frequency trading?
High-frequency trading may reduce some seasonal effects by quickly exploiting pricing inefficiencies. However, certain seasonal trends still appear in broader market behavior, especially among retail investors.
Do these patterns work in all global markets?
Seasonal patterns vary across regions due to differences in economic cycles, holidays, and investor behavior. While some patterns repeat globally, many are market-specific and not universally applicable.
Why does September often perform poorly in markets?
September tends to underperform due to factors like tax-related selling, portfolio rebalancing, and investor caution ahead of Q4. Historical data shows a consistent dip, though not guaranteed every year.
Editors' Top Picks and Insights

SK Hynix debuts on Nasdaq: Largest U.S. offering by foreign company

SpaceX falls out of orbit: Does anyone still want Musk’s stock?

The crypto IPO problem: How high-profile listings became investor traps

U.S. Bitcoin reserve: Trump’s unrealized crypto promise

Aiming for leadership: Payment giants prepare a new stablecoin

Proof of Reserves: the new standard for cryptocurrency exchanges
Related Articles
Team that worked on the article
Mikhail Vnuchkov joined Traders Union as an author in 2020. He began his professional career as a journalist-observer at a small online financial publication, where he covered global economic events and discussed their impact on the segment of financial investment, including investor income.
Chinmay Soni is a financial analyst with more than 5 years of experience in working with stocks, Forex, derivatives, and other assets. As a founder of a boutique research firm and an active researcher, he covers various industries and fields, providing insights backed by statistical data.
Mirjan Hipolito is a journalist and news editor at Traders Union. She is an expert crypto writer with five years of experience in the financial markets.
Index in trading is the measure of the performance of a group of stocks, which can include the assets and securities in it.
Xetra is a German Stock Exchange trading system that the Frankfurt Stock Exchange operates. Deutsche Börse is the parent company of the Frankfurt Stock Exchange.
Volatility refers to the degree of variation or fluctuation in the price or value of a financial asset, such as stocks, bonds, or cryptocurrencies, over a period of time. Higher volatility indicates that an asset's price is experiencing more significant and rapid price swings, while lower volatility suggests relatively stable and gradual price movements.
Cryptocurrency is a type of digital or virtual currency that relies on cryptography for security. Unlike traditional currencies issued by governments (fiat currencies), cryptocurrencies operate on decentralized networks, typically based on blockchain technology.
CFD is a contract between an investor/trader and seller that demonstrates that the trader will need to pay the price difference between the current value of the asset and its value at the time of contract to the seller.

-
 Afghanistan
-
 Albania
-
 Algeria
-
 Angola
-
 Argentina
-
 Armenia
-
 Australia
-
 Austria
-
 Azerbaijan
-
 Bahamas
-
 Bahrain
-
 Bangladesh
-
 Belarus
-
 Belgium
-
 Bolivia
-
 Botswana
-
 Brazil
-
 Brunei
-
 Bulgaria
-
 Cambodia
-
 Cameroon
-
 Canada
-
 Chile
Chile
-
 China
China
-
 Colombia
-
 Congo
Congo
-
 Costa Rica
-
 Cote d'Ivoire
-
 Croatia
-
 Cuba
Cuba
-
 Cyprus
-
 Czechia
-
 DR Congo
-
 Denmark
-
 Dominican Republic
-
 Ecuador
-
 Egypt
Egypt
-
 El Salvador
-
 Estonia
-
 Eswatini
-
 Ethiopia
-
 Finland
-
 France
-
 Georgia
-
 Germany
-
 Ghana
Ghana
-
 Greece
-
 Haiti
Haiti
-
 Hong Kong
-
 Hungary
-
 India
India
-
 Indonesia
-
 Iran, Islamic republic
-
 Iraq
Iraq
-
 Ireland
-
 Israel
-
 Italy
Italy
-
 Jamaica
-
 Japan
Japan
-
 Jordan
-
 Kazakhstan
-
 Kenya
Kenya
-
 Korea
Korea
-
 Kuwait
-
 Kyrgyzstan
-
 Laos
Laos
-
 Latvia
-
 Lebanon
-
 Lesotho
-
 Libya
Libya
-
 Lithuania
-
 Luxembourg
-
 Madagascar
-
 Malaysia
-
 Malta
Malta
-
 Mauritius
-
 Mexico
-
 Moldova
-
 Mongolia
-
 Montenegro
-
 Morocco
-
 Mozambique
-
 Myanmar
-
 Namibia
-
 Nepal
Nepal
-
 Netherlands
-
 New Zealand
-
 Nigeria
-
 North Macedonia
-
 Norway
-
 Oman
Oman
-
 Pakistan
-
 Palestine
-
 Panama
-
 Papua New Guinea
-
 Paraguay
-
 Peru
Peru
-
 Philippines
-
 Poland
-
 Portugal
-
 Puerto Rico
-
 Qatar
Qatar
-
 Reunion
-
 Romania
-
 Rwanda
-
 Saudi Arabia
-
 Serbia
-
 Singapore
-
 Slovakia
-
 Slovenia
-
 Somalia
-
 South Africa
-
 Spain
Spain
-
 Sri Lanka
-
 Sweden
-
 Switzerland
-
 Syria
Syria
-
 Taiwan
-
 Tajikistan
-
 Tanzania
-
 Thailand
-
 Trinidad and Tobago
-
 Tunisia
-
 Turkey
-
 UAE
UAE
-
 Uganda
-
 Ukraine
-
 United Kingdom
-
United States
-
 Uruguay
-
 Uzbekistan
-
 Venezuela
-
 Vietnam
-
 Yemen
Yemen
-
 Zambia
-
 Zimbabwe
- Forex
- Crypto
