U.S. Stocks May Upset You This Year


Editorial Note: While we adhere to strict Editorial Integrity, this post may contain references to products from our partners. Here's an explanation for How We Make Money. None of the data and information on this webpage constitutes investment advice according to our Disclaimer.
U.S. stocks may fall in 2026 due to extreme market concentration, elevated valuations, and delayed macroeconomic effects. A narrow rally led by mega-cap stocks leaves indices vulnerable if earnings disappoint or growth slows. Investors can prepare by diversifying exposure, managing risk, and avoiding panic-driven decisions.
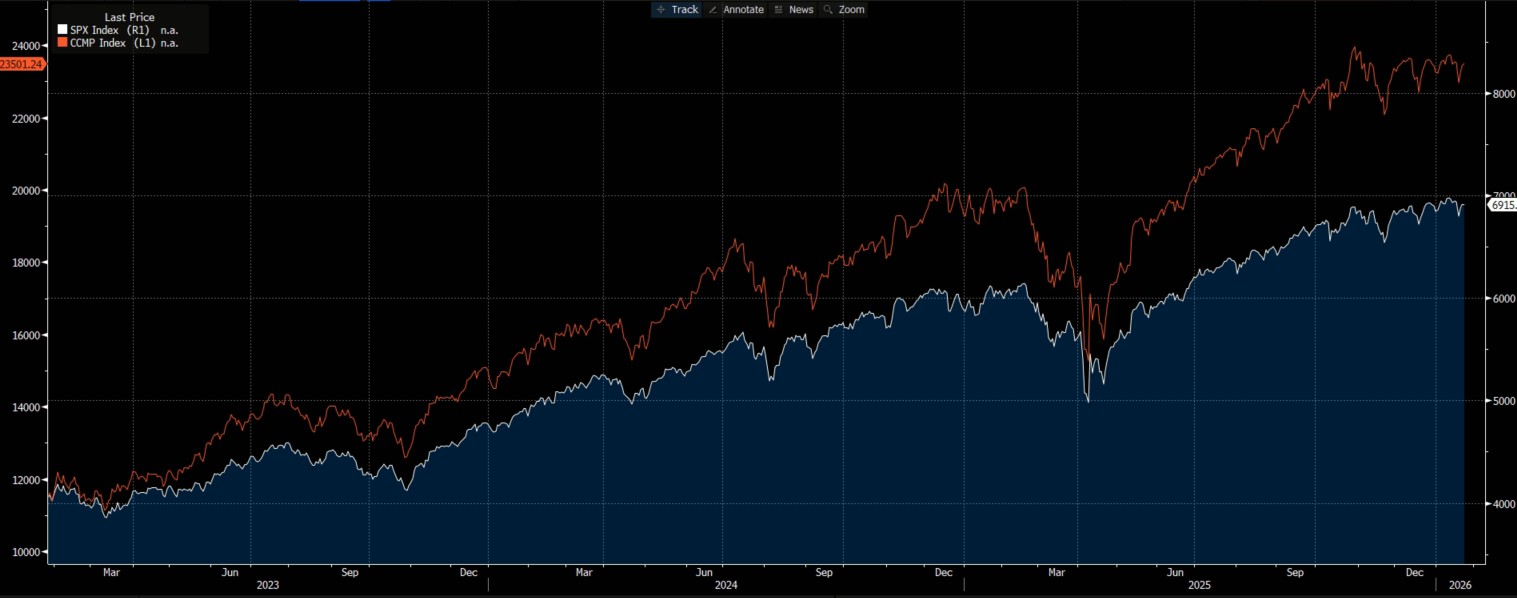
At the start of 2026, U.S. stock investors have plenty to celebrate. From the start of 2023 through the end of 2025, the S&P 500 delivered an eye-catching 86% total return. However, that headline number hides an important detail: the market has been driven by a narrow set of mega-cap winners. Over the same period, the equal-weight version of the index returned just 43%, meaning the typical stock did far less of the heavy lifting.
I am of the view that the “narrow-rally” setup makes the U.S. equity market – especially the S&P 500, Dow, and Nasdaq – vulnerable to a decline in 2026. Valuations are elevated, concentration is extreme, and the macro environment is entering a stage where policy lags can show up in earnings. In plain terms, when expectations are already high, it doesn’t take a catastrophe for markets to fall, just a series of disappointments.
A historic run usually raises the bar for what comes next
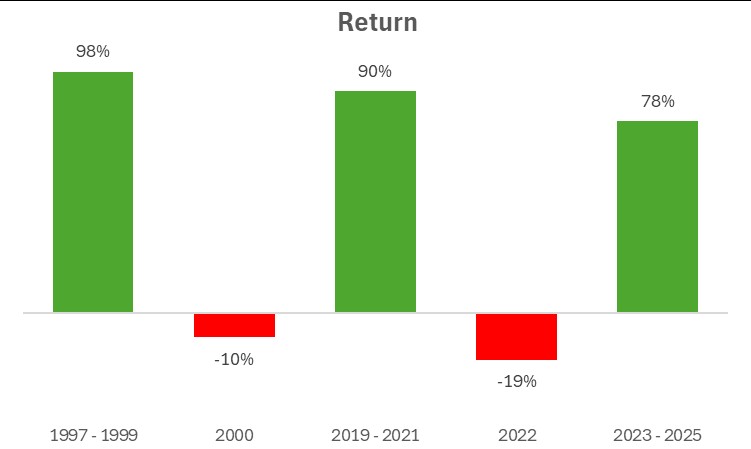
Big three-year surges in the S&P 500 are rare. One reference point notes that rallies above ~75% over three years don’t happen often. It is worth highlighting that the last two comparable gains that occurred were around 1999 and 2021, periods that were followed by weaker performance. That doesn’t guarantee a crash, but it does tell you something important: after extraordinary gains, the market’s “easy money” phase is often behind you.
A second warning sign is that investors may be overconfident because the index feels “safe.” The S&P 500 can look diversified, but its market-cap-weighted dominates the results. When leadership is narrow, index-level outcomes can change quickly if just a few names stumble.
Concentration and weak breadth: when the index isn’t the market
The recent U.S. rally has been unusually concentrated. The “Magnificent 7” made up around 37% of the S&P 500, and it can be associated with the late-cycle speculative conditions where extreme concentration, speculative fever, and poor breadth were in place.
Another piece underscores how narrow the advance has been: seven stocks accounted for nearly half of the S&P 500’s return last year, and 30% of index components beat the average index return in each of the last three years.
Why does this matter for 2026? Because concentration cuts both ways. If mega-caps keep rising, the index can look unstoppable. But if their earnings growth slows or valuations compress, the S&P 500 and Nasdaq can fall even if many smaller stocks hold up.
Valuation risk: when returns get pulled forward
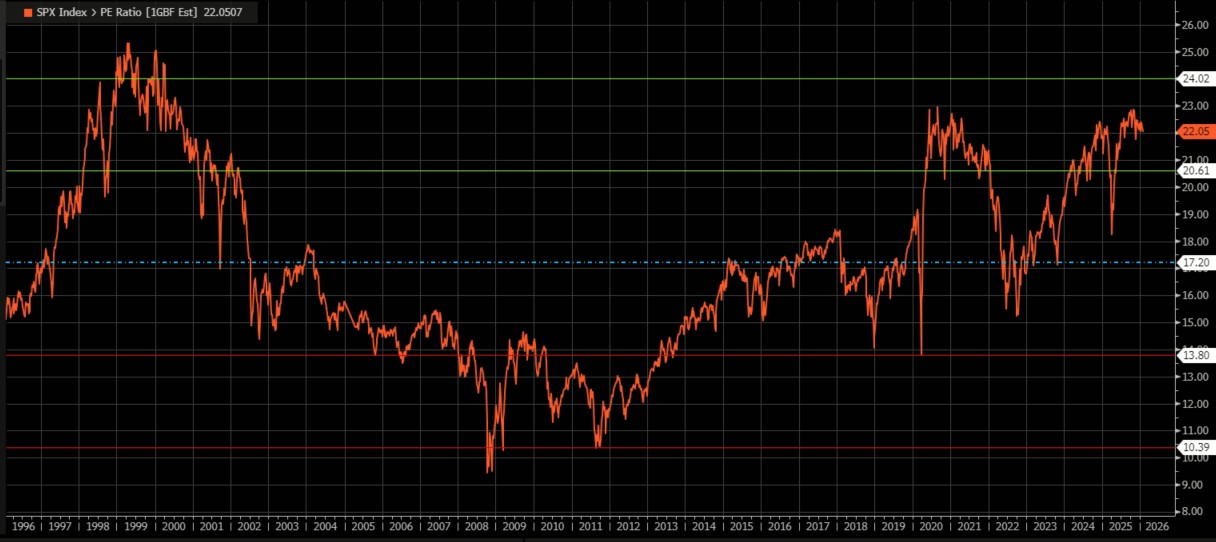
When valuations are stretched, markets can decline even without a recession. The valuation of the S&P 500 sits near extremes, with a forward P/E close to 2 standard deviations high, a condition that could lead to market downturns.
That kind of valuation often means that returns are “borrowed from the future.” In 2026, the market may simply need to re-price to more normal assumptions: slower growth, more competition, and less margin expansion.
The macro lag: why 2026 can be the year the bill comes due
Monetary policy and financial conditions don’t hit the economy instantly. Typically, the effects travel through a chain, i.e., rates → credit → spending/investment → earnings. It can show up with long, uneven lags rather than immediately.
This matters because markets can be rallying late in the cycle even while the underlying economy is quietly cooling. If 2026 brings softer labor conditions, weaker consumption, or tighter credit, equities can re-rate quickly, particularly when valuations and positioning are already optimistic.
AI optimism vs return-on-capital reality
The AI narrative is powerful, but the same late-cycle report raises a blunt point: there’s still no proof that all the AI investment “so far” will earn an attractive return on capital in the near term, and it highlights practical constraints, such as energy supply, permitting, and potential regulation, that could slow the boom.
In 2026, the market’s question may shift from “Who benefits from AI?” to “Who earns a decent return on all this spending?” If the answer is “fewer companies than investors assume”, the Nasdaq, where expectations are most inflated, could be hit hardest.
As macro and valuation risks rise, execution quality becomes increasingly important. Choosing a reliable stock broker is a practical step for investors preparing for volatility in U.S. equities. The table below compares platforms that offer access to U.S. stocks and related instruments.
| eToro USA | Plus500 | eOption | Revolut | Interactive Brokers | Fidelity | |
|---|---|---|---|---|---|---|
|
Foundation year |
2007 | 2008 | 2007 | 2015 | 1978 | 1946 |
|
Account min. |
50 | EUR500 | No | No | No | No |
|
Interest rate |
3,75 | No | 8.95% | 0%-4% | 4.83% | 4.97% |
|
Basic stock/ETF fee |
No | $0.006 | $0 | 0.12%-0.25% | 0-0,0035% | No |
|
Min. stock/ETF fee |
No | Not specified | $0 | £1.00/€1.00 | $1,00 | No |
|
Basic futures fee |
Not specified | Not specified | Not specified | No | $0,25 | Varies |
|
Min. futures fee |
Not specified | Not specified | Not specified | No | $0,25 | Varies |
|
Open an account |
Go to broker Your capital is at risk. |
Go to broker 80% of retail CFD accounts lose money. |
Study review | Study review | Study review | Study review |
Focus on risk control

I’m bearish on U.S. equities in 2026, not because I’m predicting a single disaster, but because the market’s foundation looks fragile: extreme concentration, expensive valuations, and a narrative-driven boom that may disappoint once investors demand real returns.
I wouldn’t try to “all-in” short the market. Instead, I’d focus on risk control. First, I’d reduce overexposure to mega-cap tech by diversifying across sectors and considering a more balanced index approach (for example, equal-weight exposure can reduce concentration risk). Second, I’d rebuild a cash buffer so I can act if volatility spikes. Third, for investors who understand the mechanics, I’d consider temporary hedges: buying put options on an S&P 500 ETF can define downside risk, and inverse ETFs can work for short tactical windows.
If you choose to act based on your risk appetite, the list of the best stock brokers for investing below can help. It gives you a quick way to compare trusted platforms so you can open an account easily and place your trades with a bit more clarity and control.
Conclusion
As U.S. equities scale new highs, investors must stay alert to mounting vulnerabilities that could trigger a downturn in 2026. The S&P 500’s exceptional advance has heightened the risk of corrections if economic growth slows or policy shifts unsettle markets. For example, higher interest rates or disappointing earnings could swiftly puncture today’s optimism. The key takeaway: resilience comes from diversification and active risk management, not complacency. Ultimately, those who prepare with discipline now will navigate future volatility with confidence and seize opportunity where others see only threat.
FAQs
How does investor overconfidence contribute to potential U.S. stock market weakness in 2026?
What historical patterns suggest caution after strong multi-year U.S. stock rallies?
Why could the performance of smaller U.S. stocks differ from major indices in 2026?
How might rapid growth in artificial intelligence investment affect U.S. stock returns by 2026?
Editors' Top Picks and Insights

Lean Ethereum: Why Buterin wants to rebuild the network

SK Hynix debuts on Nasdaq: Largest U.S. offering by foreign company

SpaceX falls out of orbit: Does anyone still want Musk’s stock?

The crypto IPO problem: How high-profile listings became investor traps

U.S. Bitcoin reserve: Trump’s unrealized crypto promise

Aiming for leadership: Payment giants prepare a new stablecoin
Related Articles
Team that worked on the article
Andreas Kristo Saragih is a seasoned equity research analyst with over a decade of experience across both buy-side and sell-side roles, focused on the Indonesian capital market. He has extensive sector coverage, including banking, consumer goods, retail, real estate, healthcare, transportation, poultry, cement, pharmaceuticals, construction, and infrastructure.
Dan Blystone began his trading career in 1998 as an arbitrage clerk on the floor of the Chicago Mercantile Exchange (CME). He later traded bond and Eurex futures at proprietary firms such as Altea Trading, gaining valuable experience in high-frequency trading and risk management.
Chinmay Soni is a financial analyst with more than 5 years of experience in working with stocks, Forex, derivatives, and other assets. As a founder of a boutique research firm and an active researcher, he covers various industries and fields, providing insights backed by statistical data.
The deviation is a statistical measure of how much a set of data varies from the mean or average value. In forex trading, this measure is often calculated using standard deviation that helps traders in assessing the degree of variability or volatility in currency price movements.
Index in trading is the measure of the performance of a group of stocks, which can include the assets and securities in it.
Risk management is a risk management model that involves controlling potential losses while maximizing profits. The main risk management tools are stop loss, take profit, calculation of position volume taking into account leverage and pip value.
Bitcoin is a decentralized digital cryptocurrency that was created in 2009 by an anonymous individual or group using the pseudonym Satoshi Nakamoto. It operates on a technology called blockchain, which is a distributed ledger that records all transactions across a network of computers.
Ethereum is a decentralized blockchain platform and cryptocurrency that was proposed by Vitalik Buterin in late 2013 and development began in early 2014. It was designed as a versatile platform for creating decentralized applications (DApps) and smart contracts.

-
 Afghanistan
-
 Albania
-
 Algeria
-
 Angola
-
 Argentina
-
 Armenia
-
 Australia
-
 Austria
-
 Azerbaijan
-
 Bahamas
-
 Bahrain
-
 Bangladesh
-
 Belarus
-
 Belgium
-
 Bolivia
-
 Botswana
-
 Brazil
-
 Brunei
-
 Bulgaria
-
 Cambodia
-
 Cameroon
-
 Canada
-
 Chile
Chile
-
 China
China
-
 Colombia
-
 Congo
Congo
-
 Costa Rica
-
 Cote d'Ivoire
-
 Croatia
-
 Cuba
Cuba
-
 Cyprus
-
 Czechia
-
 DR Congo
-
 Denmark
-
 Dominican Republic
-
 Ecuador
-
 Egypt
Egypt
-
 El Salvador
-
 Estonia
-
 Eswatini
-
 Ethiopia
-
 Finland
-
 France
-
 Georgia
-
 Germany
-
 Ghana
Ghana
-
 Greece
-
 Haiti
Haiti
-
 Hong Kong
-
 Hungary
-
 India
India
-
 Indonesia
-
 Iran, Islamic republic
-
 Iraq
Iraq
-
 Ireland
-
 Israel
-
 Italy
Italy
-
 Jamaica
-
 Japan
Japan
-
 Jordan
-
 Kazakhstan
-
 Kenya
Kenya
-
 Korea
Korea
-
 Kuwait
-
 Kyrgyzstan
-
 Laos
Laos
-
 Latvia
-
 Lebanon
-
 Lesotho
-
 Libya
Libya
-
 Lithuania
-
 Luxembourg
-
 Madagascar
-
 Malaysia
-
 Malta
Malta
-
 Mauritius
-
 Mexico
-
 Moldova
-
 Mongolia
-
 Montenegro
-
 Morocco
-
 Mozambique
-
 Myanmar
-
 Namibia
-
 Nepal
Nepal
-
 Netherlands
-
 New Zealand
-
 Nigeria
-
 North Macedonia
-
 Norway
-
 Oman
Oman
-
 Pakistan
-
 Palestine
-
 Panama
-
 Papua New Guinea
-
 Paraguay
-
 Peru
Peru
-
 Philippines
-
 Poland
-
 Portugal
-
 Puerto Rico
-
 Qatar
Qatar
-
 Reunion
-
 Romania
-
 Rwanda
-
 Saudi Arabia
-
 Serbia
-
 Singapore
-
 Slovakia
-
 Slovenia
-
 Somalia
-
 South Africa
-
 Spain
Spain
-
 Sri Lanka
-
 Sweden
-
 Switzerland
-
 Syria
Syria
-
 Taiwan
-
 Tajikistan
-
 Tanzania
-
 Thailand
-
 Trinidad and Tobago
-
 Tunisia
-
 Turkey
-
 UAE
UAE
-
 Uganda
-
 Ukraine
-
 United Kingdom
-
United States
-
 Uruguay
-
 Uzbekistan
-
 Venezuela
-
 Vietnam
-
 Yemen
Yemen
-
 Zambia
-
 Zimbabwe
- Forex
- Crypto
