MTracer Review: Reading The Market Through Whale Signals


Editorial Note: While we adhere to strict Editorial Integrity, this post may contain references to products from our partners. Here's an explanation for How We Make Money. None of the data and information on this webpage constitutes investment advice according to our Disclaimer.
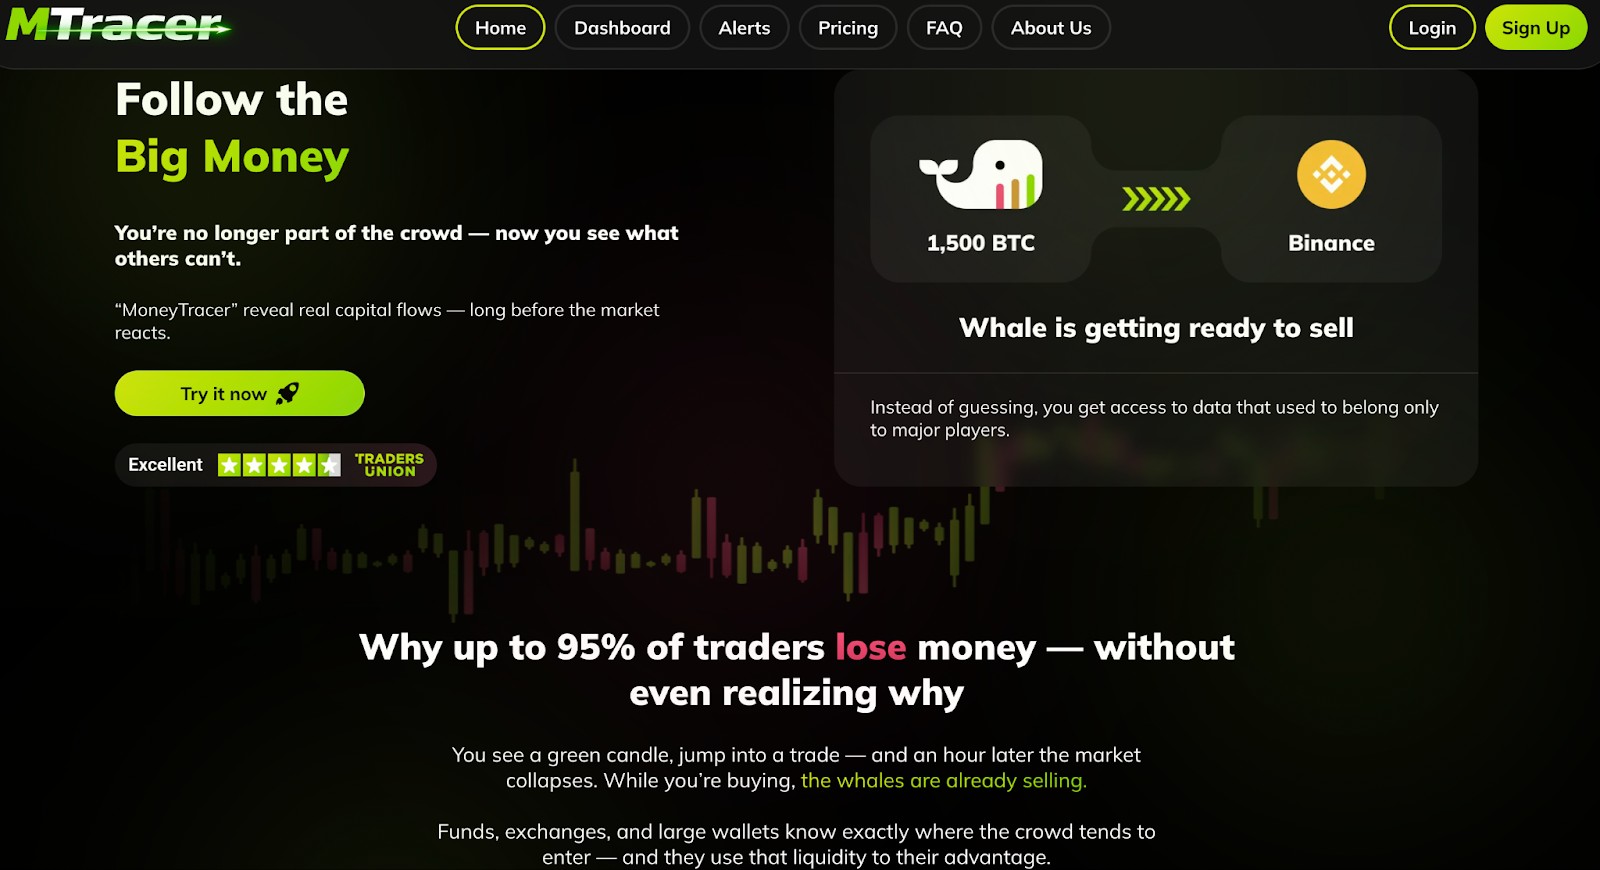
MTracer is a crypto monitoring tool that shows what large investors (“whales”) are doing on the blockchain. It tracks big transfers of coins and movements to and from exchanges in real time, helping traders see when big players are buying, selling, or staying inactive. This makes it easier to understand whether a price move is supported by large capital or driven mainly by short-term retail reactions.
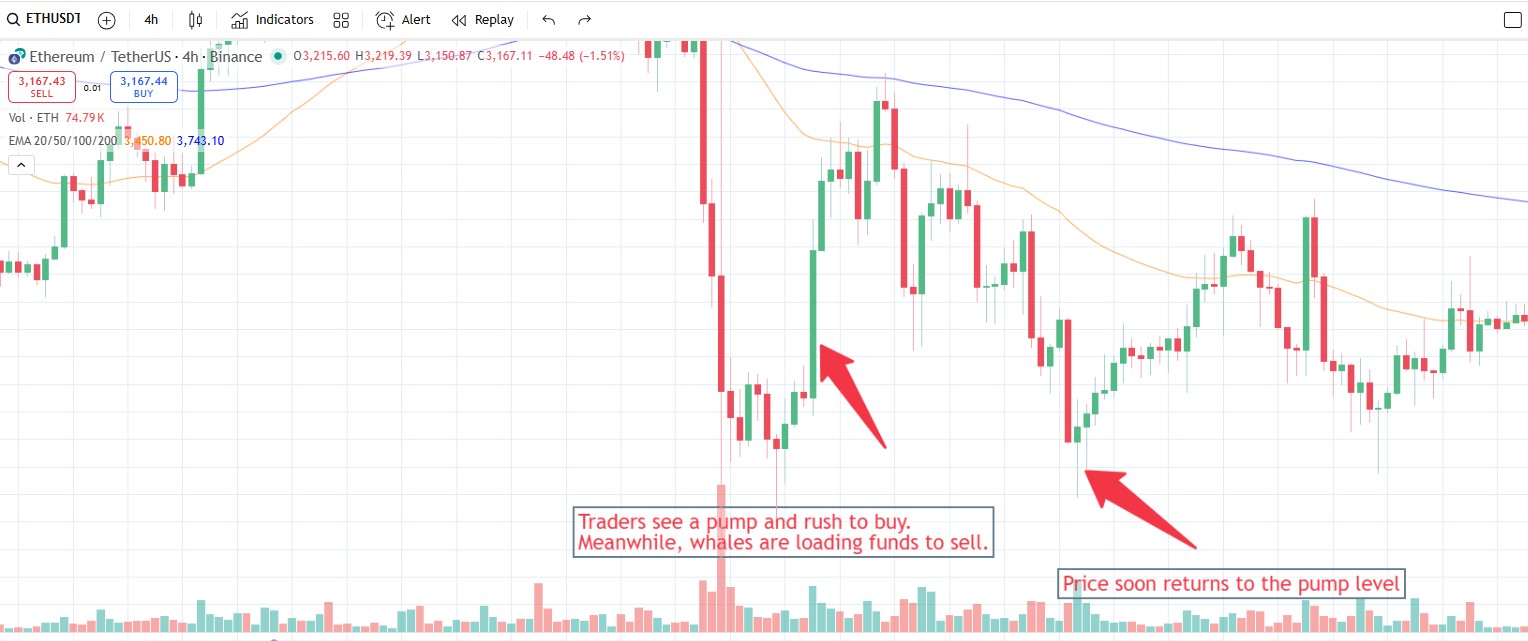
Have you ever entered a trade right after a strong move – only to see the market reverse almost immediately? You’re not alone. For most retail traders, the chart is the main source of information. Green candles feel like confirmation. Red candles feel like danger. But price only shows what has already happened. It rarely explains why the move started – or whether it’s close to ending.
This is where many traders get trapped: they react to price, while large players act before price becomes obvious. To better understand what’s really happening under the surface, more traders are starting to look at capital flow – where big money is moving, not just how price reacts.
In this article, you’ll learn what whale signals are, why they matter for market timing, and how tools like MTracer help track large capital movements in real time – making the market easier to read, even for beginners.
Risk warning: Cryptocurrency markets are highly volatile, with sharp price swings and regulatory uncertainties. Research indicates that 75-90% of traders face losses. Only invest discretionary funds and consult an experienced financial advisor.
Why following large capital matters
In market terms, “whales” are large participants: funds, exchanges, market makers, early holders, and large private wallets.
They don’t trade emotionally. They don’t chase candles. And they rarely act at the same moment as the crowd.
Whales usually:
build positions quietly, when volatility is low and attention is minimal;
reduce or exit positions when demand is high and sentiment turns optimistic.
By the time a strong price move becomes obvious to most traders, large capital has often already made its decision.
Understanding this timing difference is key. What looks like “the start” of a move on the chart is often the final phase from the perspective of big money.
Traders who want to understand how whale signals work in real market conditions can explore this topic in more detail through the Follow the Whales. This educational course is led by Viktoras Karapetyants, a professional trader with over 25 years of experience. Instead of telling you when to buy or sell, the program explains why large players move capital and how to read these movements calmly and logically.
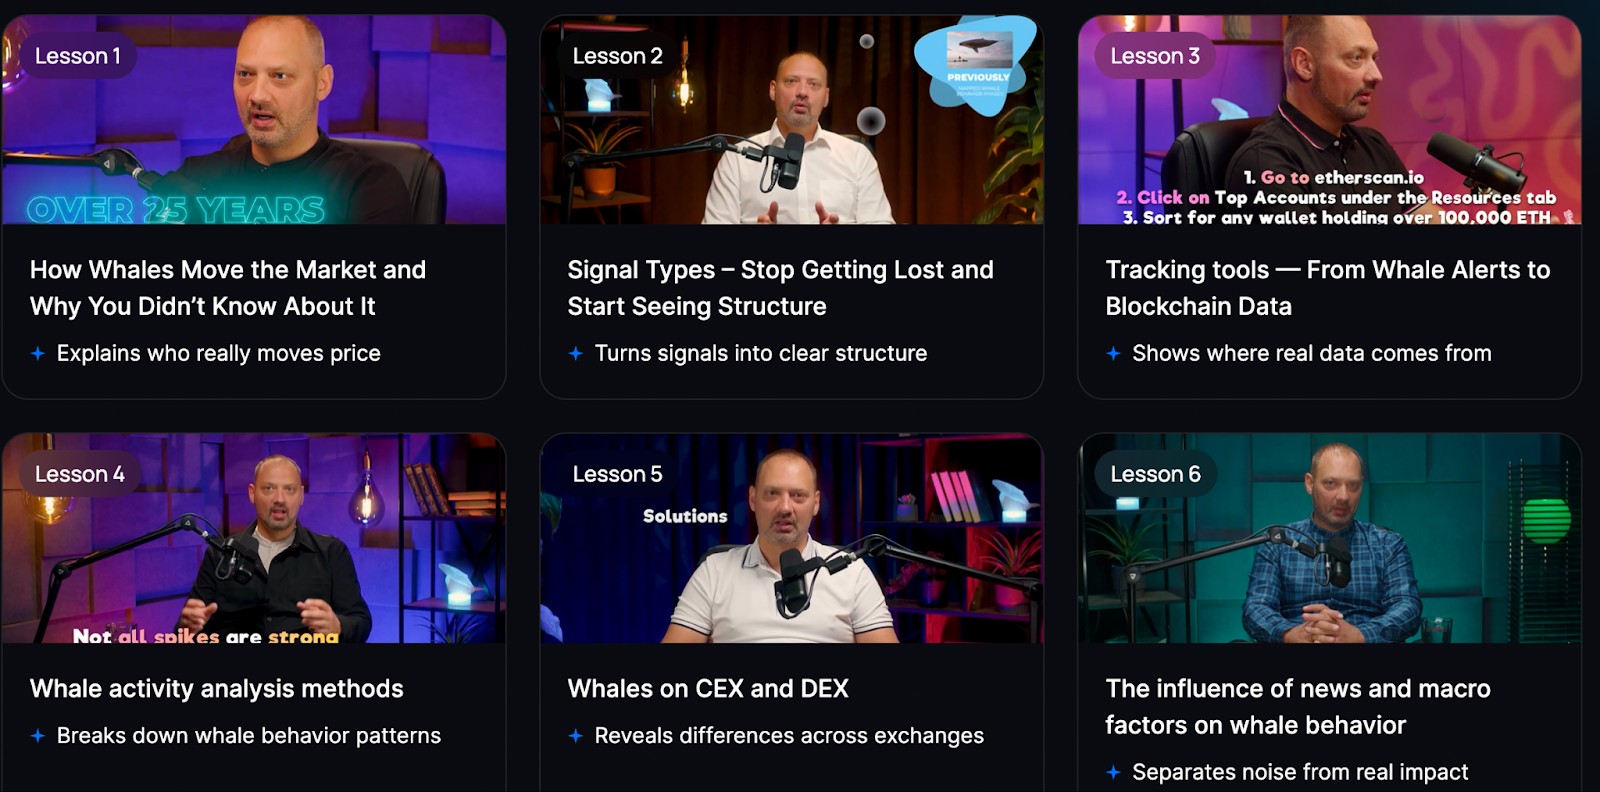
During the course, participants learn how to make sense of on-chain data step by step: what large transfers actually mean, how to spot accumulation and distribution phases early, and how to avoid jumping into trades just because the price moved. The focus is on building a clear way of thinking – so traders stop reacting emotionally and start understanding how big money positions itself before major market moves.
A real example: how whales distribute at market highs
A clear illustration of this behavior appeared in October 2025, when Bitcoin was trading near its all-time highs.
Sentiment was extremely bullish. Headlines were optimistic. Many traders expected the rally to continue.
But on-chain data showed something else.
Throughout the month, large wallets transferred over $5.5 billion worth of BTC to exchanges – a classic sign that big holders were preparing to sell. These inflows happened quietly, while public attention stayed focused on price.
Soon after:
Bitcoin briefly pushed to a new high near $126,000;
retail traders entered late, driven by optimism;
the market then dropped roughly $15,000 in the following days.
Nothing “unexpected” happened. Large players simply used rising demand as liquidity to exit.
This pattern repeats across markets and cycles – and it’s one of the main reasons many traders buy tops and sell bottoms.
Why reacting to price isn’t enough
Most traders don’t lose because the market is “rigged.” They lose because they’re reacting instead of observing. The crowd unintentionally shows whales exactly where liquidity sits:
emotional breakout entries;
clusters of stop-loss orders;
panic selling during pullbacks.
Large players don’t guess – they use that liquidity. To avoid being on the wrong side of these moves, traders need context. Not more indicators, but a clearer picture of who is acting and when.
That’s where on-chain monitoring tools come in.
What is MTracer?
MTracer is an on-chain analytics platform designed to track the movement of large capital – often referred to as “whale activity.”
Instead of focusing only on price, MTracer shows:
when large amounts of crypto move into exchanges (potential selling pressure);
when assets move out of exchanges (potential accumulation);
how these movements combine into a broader picture of market behavior.
The idea is simple: watch what big money is doing, not just how price reacts afterward.

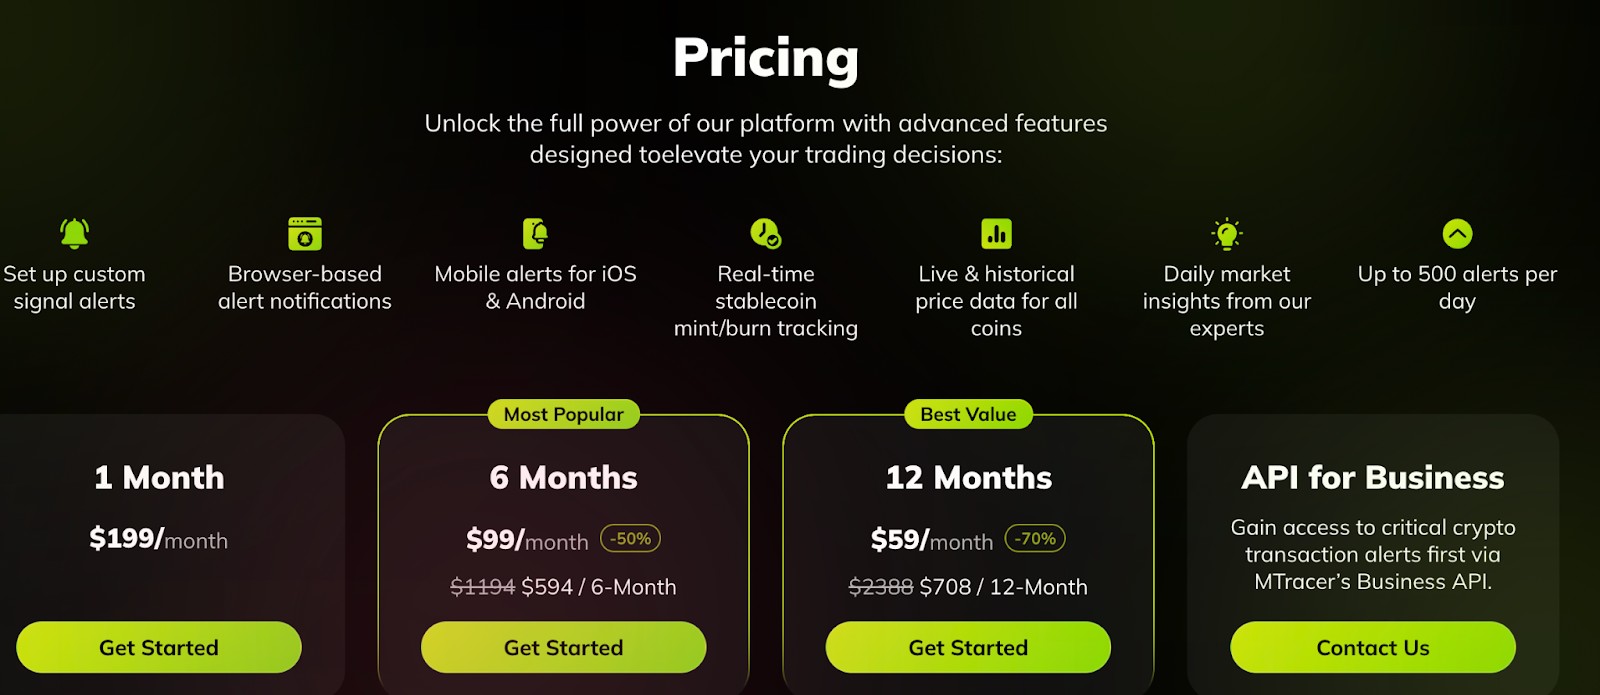
MTracer turns raw blockchain data into clear, visual signals that are accessible even for traders without deep technical backgrounds. Users can try MTracer free for 7 days and explore all key features, including whale alerts. After the trial period, access continues through a subscription model or by linking a supported exchange account, depending on the chosen plan.
How MTracer works
MTracer continuously scans supported blockchains and highlights meaningful movements through two main elements:
1. Live whale alerts
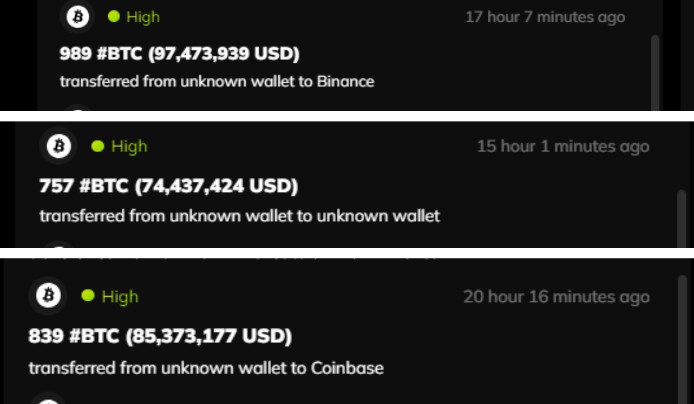
These alerts show significant transactions as they happen, such as:
large wallet-to-wallet transfers;
inflows to exchanges (often linked to selling);
outflows from exchanges (often linked to accumulation);
stablecoin movements that signal changes in liquidity.
Each alert includes context and relative strength, helping users quickly judge whether it’s worth attention.
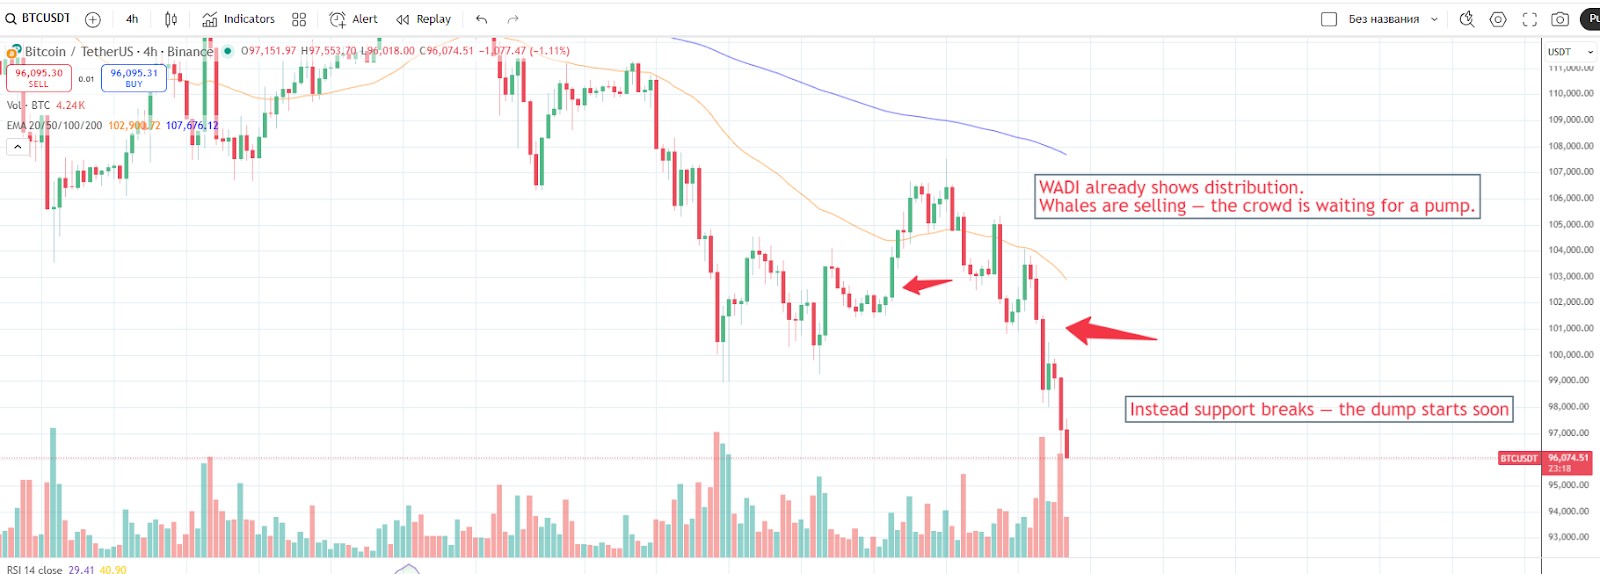
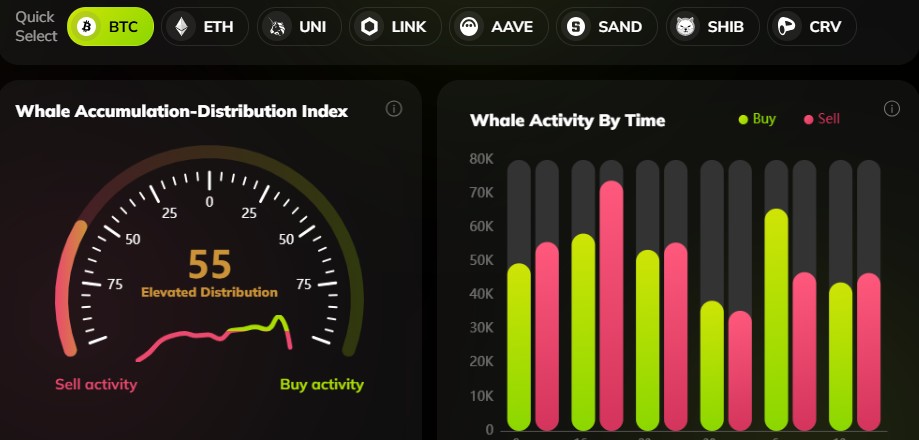
2. WADI – Whale Accumulation Distribution Index
WADI is a single score (from 0 to 100) that summarizes overall whale behavior.
higher accumulation readings suggest whales are quietly building positions;
higher distribution readings suggest whales are reducing exposure;
neutral values indicate low activity or balance.
Instead of interpreting dozens of isolated transactions, traders get a directional overview of what large capital is doing.
How this looks in practice
Imagine seeing an alert like: “Whale inflow: 3,200 BTC → Binance”. On its own, this is just information – not a trading signal.
But if, at the same time:
multiple similar inflows appear;
WADI rises into the distribution zone;
It suggests that large holders are preparing to sell while price may still look strong.
The opposite works the same way. An alert such as: “Whale outflow: 1,500 BTC ← Binance” combined with WADI shifting into accumulation often appears before visible price growth – during quiet, sideways conditions when most traders lose interest.
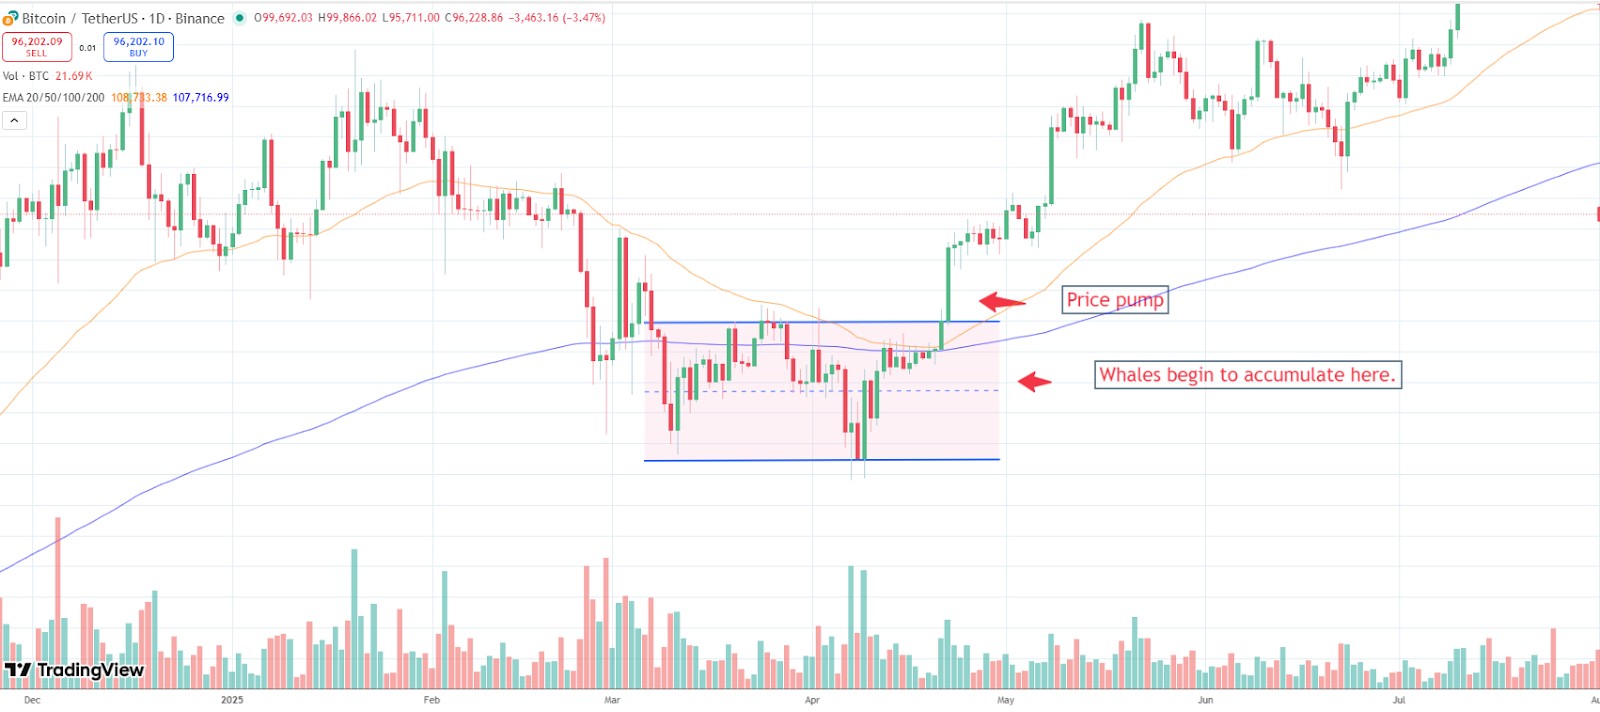
This is how many major moves begin: not during hype, but in silence.
My experience: staying defensive during February’s drawdown

In early February 2026, the crypto market saw a sharp sell-off. Bitcoin dropped about 7% in a single day, briefly falling below $71,000, while total market capitalization declined by over 6% in 24 hours. Price alone was misleading. Short-term bounces near $78,000–$79,000 repeatedly failed, trapping traders who chased quick recoveries.What helped me stay out of trouble was watching capital flow through MTracer.
While price attempted to stabilize:
exchange inflows remained elevated;
whale alerts continued to signal capital moving onto exchanges;
WADI stayed firmly in distribution territory.
This context made it clear that large players were still reducing exposure. I avoided entering longs during those “hopeful” rebounds that later faded. Only when inflows slowed and WADI began shifting toward neutral did selling pressure ease – before price showed any convincing recovery.
Conclusion
MTracer stands out by offering traders a crucial advantage: it reveals the underlying forces driving market shifts by closely tracking whale activity and capital flows. Instead of merely observing price charts, users gain actionable insights into why key price moves occur and where smart money is heading. For instance, sharp inflows from major wallets or sudden exchange deposits can signal impending volatility—information traditional analysis often misses. Ultimately, the platform turns what was once hidden into clear, timely intelligence, empowering traders to anticipate moves rather than just react. In a market where knowledge is power, MTracer transforms data into decisive action.
FAQs
How does MTracer differentiate between accumulation and distribution phases in the market?
What types of crypto transactions does MTracer monitor to generate whale alerts?
Can traders without technical backgrounds effectively use MTracer for market analysis?
How can combining whale alerts and WADI scores enhance decision-making during volatile markets?
Editors' Top Picks and Insights

AI without limits: How dangerous are neural networks?

Worldcoin on Wall Street: From iris scans to ETF

Mark Cuban's wealth philosophy: Why stocks matter more than salary or crypto

Dangerous but indispensable: Why the crypto market needs bridges

Markus Levin: DePIN could power the AI agent economy

Pokémon cards for $2,500: How collectibles became a new form of gambling
Related Articles
Team that worked on the article
Anastasiia has 17 years of experience in finance and content marketing. She believes that the support of information and expert opinion is very important for the success of investors and new traders.
Dan Blystone began his trading career in 1998 as an arbitrage clerk on the floor of the Chicago Mercantile Exchange (CME). He later traded bond and Eurex futures at proprietary firms such as Altea Trading, gaining valuable experience in high-frequency trading and risk management.
Chinmay Soni is a financial analyst with more than 5 years of experience in working with stocks, Forex, derivatives, and other assets. As a founder of a boutique research firm and an active researcher, he covers various industries and fields, providing insights backed by statistical data.
Bitcoin is a decentralized digital cryptocurrency that was created in 2009 by an anonymous individual or group using the pseudonym Satoshi Nakamoto. It operates on a technology called blockchain, which is a distributed ledger that records all transactions across a network of computers.
Volatility refers to the degree of variation or fluctuation in the price or value of a financial asset, such as stocks, bonds, or cryptocurrencies, over a period of time. Higher volatility indicates that an asset's price is experiencing more significant and rapid price swings, while lower volatility suggests relatively stable and gradual price movements.
Risk management is a risk management model that involves controlling potential losses while maximizing profits. The main risk management tools are stop loss, take profit, calculation of position volume taking into account leverage and pip value.
CFD is a contract between an investor/trader and seller that demonstrates that the trader will need to pay the price difference between the current value of the asset and its value at the time of contract to the seller.
Index in trading is the measure of the performance of a group of stocks, which can include the assets and securities in it.

-
 Afghanistan
-
 Albania
-
 Algeria
-
 Angola
-
 Argentina
-
 Armenia
-
 Australia
-
 Austria
-
 Azerbaijan
-
 Bahamas
-
 Bahrain
-
 Bangladesh
-
 Belarus
-
 Belgium
-
 Bolivia
-
 Botswana
-
 Brazil
-
 Brunei
-
 Bulgaria
-
 Cambodia
-
 Cameroon
-
 Canada
-
 Chile
Chile
-
 China
China
-
 Colombia
-
 Congo
Congo
-
 Costa Rica
-
 Cote d'Ivoire
-
 Croatia
-
 Cuba
Cuba
-
 Cyprus
-
 Czechia
-
 DR Congo
-
 Denmark
-
 Dominican Republic
-
 Ecuador
-
 Egypt
Egypt
-
 El Salvador
-
 Estonia
-
 Eswatini
-
 Ethiopia
-
 Finland
-
 France
-
 Georgia
-
 Germany
-
 Ghana
Ghana
-
 Greece
-
 Haiti
Haiti
-
 Hong Kong
-
 Hungary
-
 India
India
-
 Indonesia
-
 Iran, Islamic republic
-
 Iraq
Iraq
-
 Ireland
-
 Israel
-
 Italy
Italy
-
 Jamaica
-
 Japan
Japan
-
 Jordan
-
 Kazakhstan
-
 Kenya
Kenya
-
 Korea
Korea
-
 Kuwait
-
 Kyrgyzstan
-
 Laos
Laos
-
 Latvia
-
 Lebanon
-
 Lesotho
-
 Libya
Libya
-
 Lithuania
-
 Luxembourg
-
 Madagascar
-
 Malaysia
-
 Malta
Malta
-
 Mauritius
-
 Mexico
-
 Moldova
-
 Mongolia
-
 Montenegro
-
 Morocco
-
 Mozambique
-
 Myanmar
-
 Namibia
-
 Nepal
Nepal
-
 Netherlands
-
 New Zealand
-
 Nigeria
-
 North Macedonia
-
 Norway
-
 Oman
Oman
-
 Pakistan
-
 Palestine
-
 Panama
-
 Papua New Guinea
-
 Paraguay
-
 Peru
Peru
-
 Philippines
-
 Poland
-
 Portugal
-
 Puerto Rico
-
 Qatar
Qatar
-
 Reunion
-
 Romania
-
 Rwanda
-
 Saudi Arabia
-
 Serbia
-
 Singapore
-
 Slovakia
-
 Slovenia
-
 Somalia
-
 South Africa
-
 Spain
Spain
-
 Sri Lanka
-
 Sweden
-
 Switzerland
-
 Syria
Syria
-
 Taiwan
-
 Tajikistan
-
 Tanzania
-
 Thailand
-
 Trinidad and Tobago
-
 Tunisia
-
 Turkey
-
 UAE
UAE
-
 Uganda
-
 Ukraine
-
 United Kingdom
-
United States
-
 Uruguay
-
 Uzbekistan
-
 Venezuela
-
 Vietnam
-
 Yemen
Yemen
-
 Zambia
-
 Zimbabwe
- Forex
- Crypto
