The Xmaster Formula Forex Indicator Review 2026


Editorial Note: While we adhere to strict Editorial Integrity, this post may contain references to products from our partners. Here's an explanation for How We Make Money. None of the data and information on this webpage constitutes investment advice according to our Disclaimer.

The XMaster Formula indicator can be worth using for traders who value simplicity and visual cues in market analysis. It offers straightforward signals with its red and green stripes, indicating potential selling and buying points. However, its effectiveness depends on the trader's ability to interpret these signals in the context of the prevailing market trend and with proper risk management.
In Forex trading, the allure of definitive success often lies in the meticulous analysis and strategic use of technical indicators. Among the plethora of tools available, the XMaster Formula indicator emerges as a subject of intrigue.
This brings us to a pivotal question: Is incorporating the XMaster Formula into your trading arsenal a move toward prosperity or a step toward perplexity? This article will answer this question.
What is the Xmaster formula indicator for MT5?
Before diving into the XMaster Formula indicator, let’s establish a foundation. MT4 and MT5 are cutting-edge platforms developed by MetaQuotes Software for online trading in Forex, contracts for differences (CFDs), and futures markets. MT5, the latest iteration, offers extended features including the ability to add new indicators - enhancements that cater to the sophisticated needs of modern traders.
To harness these platforms' full potential, one must engage with a reputable broker.
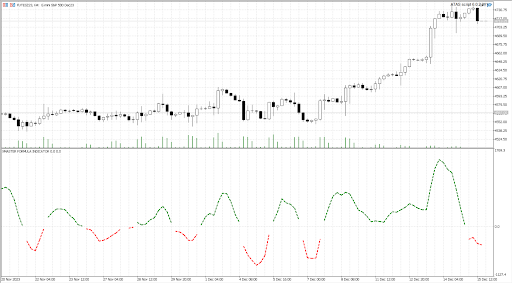 Xmaster formula Indicator on the chart
Xmaster formula Indicator is added below the price chart in the form of an oscillator, which consists of red and green coloured bars. The bars are not redrawn.
How is the XMaster formula indicator calculated?
The XMaster Formula Indicator shrouded in a veil of proprietary secrecy, has intrigued the trading community. According to various sources, it is an amalgamation and refinement of the revered Relative Strength Index (RSI) and the Moving Average Convergence Divergence (MACD).
These foundational tools measure momentum and trend changes. Their fusion in the XMaster Formula is thought to be a sophisticated enhancement. However, the exact algorithmic concoction remains unknown, known only to its creators, adding an element of mystique to its application.
How to Install the XMaster formula indicator MT5 Indicator
Downloading and installing the XMaster Formula Indicator within your MT5 platform is a fairly simple series of straightforward steps, which are:
1. Acquire the XmasterFormula.ex5 file from a trustworthy website
2. Start the MT5 platform and go to the ‘Navigator’ panel
3. Click and drag the .ex5 file and position it within the 'Navigator' window
4. Position (drop) the file into the 'Indicators' directory found under 'MQL5'
5. Reboot the MT5 platform for the changes to take effect. This will render the indicator accessible
6. Upon restart, to apply the Xmaster Formula onto a chart, navigate through 'Insert' to 'Indicators', then to 'Custom', and finally select 'Xmaster Formula' from your toolbar
What are the best MT5 brokers?
We compared the trading conditions of the best MT5 brokers for trading with a wide selection of indicators.
ECN/RAW Account: Provides direct access to other participants in currency markets through electronic communication networks (ECNs) with lower spreads and higher transparency.
Trading Bots (EAs): Supports the use of Expert Advisors (EAs), which are automated trading systems that execute trades based on pre-set strategies, available on the MT5 platform.
Android and iOS: Ensures platform accessibility via mobile apps for Android and iOS, allowing traders to manage their accounts and trade directly from their smartphones.
| Trading.com USA | ZForex | OANDA | |
|---|---|---|---|
|
Currency pairs |
69 | 50 | 68 |
|
Min. deposit, $ |
50 | 10 | No |
|
ECN |
No | Yes | Yes |
|
Trading bots (EAs) |
Yes | Yes | Yes |
|
Android |
Yes | Yes | Yes |
|
iOS |
Yes | Yes | Yes |
|
Open account |
Go to broker Your capital is at risk. |
Go to broker Your capital is at risk.
|
Go to broker Your capital is at risk. |
How to trade using the XMaster formula indicator
Trading with the XMaster Formula indicator typically involves two strategic approaches: reversal and continuation.
The reversal strategy focuses on identifying potential points where the market is likely to reverse its direction. Traders using this method will look for signals that suggest a price movement is overextended (either overbought or oversold) and ready to retract, offering opportunities to enter the market just as a new trend is starting.
The continuation strategy is used to identify and follow established trends. With this strategy, traders aim to enter trades that align with the current trend's direction, capitalizing on the market's existing momentum for potential gains.
Both strategies rely on the XMaster Formula indicator's signals to indicate potential entry points, with each strategy catering to different trading styles and risk appetites. The subsequent sections will provide detailed insights into how each approach can be implemented effectively.
Reversal strategy
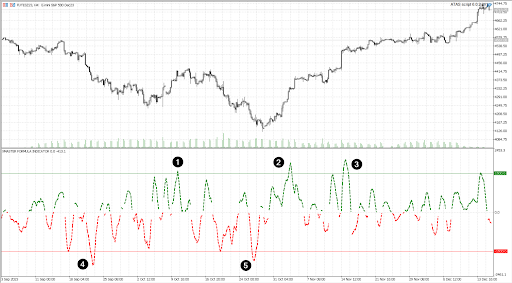 XMaster Formula indicator reversal signals
Looking at the provided chart image, we can identify instances marked by the indicator where such conditions are signaled. The chart shows periods where the indicator’s output rises above (points labeled ‘1’, ‘2’ and ‘3’) or dips below (points labeled ‘4’ and ‘5’) certain threshold levels, which traders interpret as overbought or oversold states, respectively.
Points labeled with numbers on the chart indicate where entering a trade could have been beneficial following a reversal signal. Simply put, traders can consider buying at oversold stages and selling at overbought stages.
What result could such XMaster Formula indicator signals lead to?
1. Potential profit
2. Potential loss
3. Potential loss
4. Potential loss
5. Potential profit
It's critical to note that the reliability of these signals can be heavily influenced by the prevailing trend. In a strong trending market, overbought or oversold conditions may persist, leading to premature entries if relying solely on the XMaster Formula indicator. Therefore, the quality of signals often hinges on the market's trend, and traders might need to adjust their strategy accordingly.
Continuation strategy
In employing the continuation strategy with the XMaster Formula indicator, the focus shifts to aligning with the market's existing momentum. This method involves initiating a sell trade upon the emergence of the first red stripe and a buy trade with the first appearance of a green stripe on the indicator.
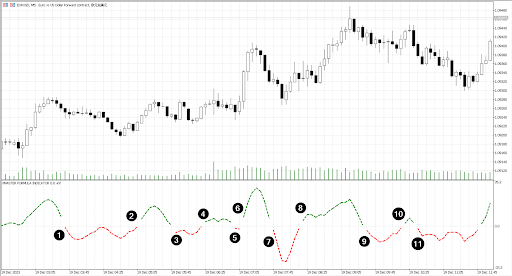 Trend continuation signals by XMaster Formula indicator
The provided chart image illustrates several instances where the XMaster Formula indicator signals potential entry points for continuation trades. Each point is marked and categorized based on the trade's outcome, ranging from 'Potential breakeven' to 'Potential profit' or 'Potential loss.' These outcomes represent the trade's financial result had a trader followed the indicator's signal at that moment.
1. Potential breakeven
2. Potential loss
3. Potential loss
4. Potential loss
5. Potential loss
6. Potential loss
7. Potential breakeven
8. Potential profit
9. Potential loss
10. Potential loss
11. Potential breakeven
It's important to note that during flat or range-bound market periods, the indicator may produce an excessive number of signals, which can often result in losing trades. This occurrence is depicted in the image, where a succession of red and green stripes corresponds to minimal price movements, leading to a predominance of potential losses and breakevens.
The implication here is clear: the effectiveness of the continuation strategy is contingent on a market that exhibits a clear trend, as opposed to periods of flat action where signals may be less reliable.
Pros and cons
The XMaster Formula indicator presents a blend of advantages and drawbacks for traders considering its application:
- Pros
- Cons
- The process to download and install the XMaster Formula indicator is fairly simple, offering a user-friendly experience without the necessity for intricate configuration
- Interpretation of the indicator is streamlined. Traders can quickly discern trading signals through clear green and red stripes
- It is versatile, designed to function across various markets, whether one trades Forex, commodities, or indices
- Compatibility is broad, with availability for both the MT4 and MT5 trading platforms, thus accommodating a wide range of users
- A significant disadvantage is the tendency for the indicator to generate numerous signals that do not lead to profitable outcomes. This can result in a challenging signal-to-noise ratio, where discerning actionable insights may require further filtration or supplementary analytical techniques.
- To increase the accuracy of the indicator signals, it would be reasonable to use additional means of analysis - for example, support and resistance levels. The search for auxiliary techniques can be difficult.
Tips for using XMaster formula indicator
To optimize the use of the XMaster Formula indicator in trading, consider these strategic tips:
Begin by assessing the overall trend or the absence of one. Apply the indicator's signals with this context in mind, as trend direction can significantly influence the effectiveness of the signals.
Experiment with contrarian trading by sometimes taking positions opposite to the indicator's signals. While this approach may not always be successful, it can occasionally capitalize on the indicator's propensity for false signals.
Maintain realistic expectations about the indicator's capabilities. It is not a shortcut to wealth. Consistently successful trading requires skill, patience, and a sound strategy.
Augment the XMaster Formula indicator with other technical analysis tools, such as support and resistance levels. These can provide additional confirmation and refine entry and exit points.
Above all, adhere to a well-defined trading plan and risk management strategy. Discipline in execution and control over risks are paramount to long-term trading success.
Who is the XMaster formula indicator good for?
The XMaster Formula indicator can be a valuable tool for various types of traders:
1. Novice traders who are looking for a simple and straightforward visual tool to complement their market analysis without getting overwhelmed by complex indicators.
2. Busy traders who prefer quick visual cues to make timely decisions without the luxury of in-depth analysis for each trade.
3. Traders who prefer a minimalist approach and wish to avoid the clutter of multiple overlays on their charts, benefit from the clear, concise signals that the XMaster Formula provides.
Expert Opinion

Should you use the XMaster indicator? The best technical indicators for any trader to use are those that a trader feels comfortable using and that fit well with their overall trading strategy (e.g., short-term or long-term, swing trading, etc.) and with their risk tolerance. When considering a new indicator, a smart approach is to first test it out with paper trades in a demo account. That will enable you to evaluate both how well the indicator works and whether or not you’re comfortable using it.
I have some reservations about one statement made about the indicator – that it’s good for “novice traders”. Personally, I don’t think it’s generally a good idea for novice traders to rely on using a momentum indicator that appears to be rather prone to generating false (bad) trading signals. Beginning traders often start out with a limited amount of capital. Therefore, just a few false trading signals generated over a short timespan can wipe out their account.
The article offers wise advice in suggesting that traders use the XMaster as a supplemental, confirming indicator, along with other technical indicators such as moving averages or trendlines, rather than employing it as a standalone indicator.
Conclusion
The XMaster Formula indicator stands out for its straightforward approach to signaling trades, providing clear buy and sell cues through red and green stripes. However, its true value emerges when traders recognize that no indicator works in isolation. For instance, using XMaster Formula during strong trending markets or alongside robust risk management strategies can significantly enhance trading outcomes. Relying solely on its alerts in ranging or choppy markets, on the other hand, may produce false signals. Ultimately, the real power of the XMaster Formula lies not just in its simplicity, but in how wisely and contextually it is applied.
FAQs
Can the XMaster Formula Indicator be used across different asset classes or is it limited to Forex?
What are potential risks of relying solely on the XMaster Formula Indicator for trading decisions?
How does the signal-to-noise ratio affect trading results with the XMaster Formula Indicator?
Is the XMaster Formula Indicator suitable for automated trading systems on MT4 and MT5?
Editors' Top Picks and Insights

Bitcoin price prediction and Bollinger Bands: Can BTC recover after falling to $63,000?

FIFA World Cup on blockchain: Where football meets crypto

Aliens, Satoshi, and Bitcoin: How the extraterrestrial theory emerged

Blockchain nation in crisis: How a power struggle split Liberland

Shifting priorities: Governments back mining as businesses turn to AI

Intel's comeback: Apple, Trump and the AI bet
Related Articles
Team that worked on the article
Vuk stands at the forefront of financial journalism, blending over six years of crypto investing experience with profound insights gained from navigating two bull/bear cycles. A dedicated content writer, Vuk has contributed to a myriad of publications and projects.
Chinmay Soni is a financial analyst with more than 5 years of experience in working with stocks, Forex, derivatives, and other assets. As a founder of a boutique research firm and an active researcher, he covers various industries and fields, providing insights backed by statistical data.
Tobi Opeyemi Amure is an editor and expert writer with over 7 years of experience. In 2023, Tobi joined the Traders Union team as an editor and fact checker, making sure to deliver trustworthy and reliable content.
Social trading is a form of online trading that allows individual traders to observe and replicate the trading strategies of more experienced and successful traders. It combines elements of social networking and financial trading, enabling traders to connect, share, and follow each other's trades on trading platforms.
Risk management in Forex involves strategies and techniques used by traders to minimize potential losses while trading currencies, such as setting stop-loss orders and position sizing, to protect their capital from adverse market movements.
Copy trading is an investing tactic where traders replicate the trading strategies of more experienced traders, automatically mirroring their trades in their own accounts to potentially achieve similar results.
Forex trading, short for foreign exchange trading, is the practice of buying and selling currencies in the global foreign exchange market with the aim of profiting from fluctuations in exchange rates. Traders speculate on whether one currency will rise or fall in value relative to another currency and make trading decisions accordingly. However, beware that trading carries risks, and you can lose your whole capital.
Cryptocurrency is a type of digital or virtual currency that relies on cryptography for security. Unlike traditional currencies issued by governments (fiat currencies), cryptocurrencies operate on decentralized networks, typically based on blockchain technology.

-
 Afghanistan
-
 Albania
-
 Algeria
-
 Angola
-
 Argentina
-
 Armenia
-
 Australia
-
 Austria
-
 Azerbaijan
-
 Bahamas
-
 Bahrain
-
 Bangladesh
-
 Belarus
-
 Belgium
-
 Bolivia
-
 Botswana
-
 Brazil
-
 Brunei
-
 Bulgaria
-
 Cambodia
-
 Cameroon
-
 Canada
-
 Chile
Chile
-
 China
China
-
 Colombia
-
 Congo
Congo
-
 Costa Rica
-
 Cote d'Ivoire
-
 Croatia
-
 Cuba
Cuba
-
 Cyprus
-
 Czechia
-
 DR Congo
-
 Denmark
-
 Dominican Republic
-
 Ecuador
-
 Egypt
Egypt
-
 El Salvador
-
 Estonia
-
 Eswatini
-
 Ethiopia
-
 Finland
-
 France
-
 Georgia
-
 Germany
-
 Ghana
Ghana
-
 Greece
-
 Haiti
Haiti
-
 Hong Kong
-
 Hungary
-
 India
India
-
 Indonesia
-
 Iran, Islamic republic
-
 Iraq
Iraq
-
 Ireland
-
 Israel
-
 Italy
Italy
-
 Jamaica
-
 Japan
Japan
-
 Jordan
-
 Kazakhstan
-
 Kenya
Kenya
-
 Korea
Korea
-
 Kuwait
-
 Kyrgyzstan
-
 Laos
Laos
-
 Latvia
-
 Lebanon
-
 Lesotho
-
 Libya
Libya
-
 Lithuania
-
 Luxembourg
-
 Madagascar
-
 Malaysia
-
 Malta
Malta
-
 Mauritius
-
 Mexico
-
 Moldova
-
 Mongolia
-
 Montenegro
-
 Morocco
-
 Mozambique
-
 Myanmar
-
 Namibia
-
 Nepal
Nepal
-
 Netherlands
-
 New Zealand
-
 Nigeria
-
 North Macedonia
-
 Norway
-
 Oman
Oman
-
 Pakistan
-
 Palestine
-
 Panama
-
 Papua New Guinea
-
 Paraguay
-
 Peru
Peru
-
 Philippines
-
 Poland
-
 Portugal
-
 Puerto Rico
-
 Qatar
Qatar
-
 Reunion
-
 Romania
-
 Rwanda
-
 Saudi Arabia
-
 Serbia
-
 Singapore
-
 Slovakia
-
 Slovenia
-
 Somalia
-
 South Africa
-
 Spain
Spain
-
 Sri Lanka
-
 Sweden
-
 Switzerland
-
 Syria
Syria
-
 Taiwan
-
 Tajikistan
-
 Tanzania
-
 Thailand
-
 Trinidad and Tobago
-
 Tunisia
-
 Turkey
-
 UAE
UAE
-
 Uganda
-
 Ukraine
-
 United Kingdom
-
United States
-
 Uruguay
-
 Uzbekistan
-
 Venezuela
-
 Vietnam
-
 Yemen
Yemen
-
 Zambia
-
 Zimbabwe
- Forex
- Crypto
