How To Identify Pullbacks And Reverses?


Editorial Note: While we adhere to strict Editorial Integrity, this post may contain references to products from our partners. Here's an explanation for How We Make Money. None of the data and information on this webpage constitutes investment advice according to our Disclaimer.
How to identify pullbacks and reverses:
Step 1: Understand the definitions
Step 2: Observe key indicators
Step 3: Use technical tools
Step 4: Assess the market context
Step 5: Set confirmation rules
Step 6: Plan your trades
Trading pullback and trading reversal are used quite often. Successfully identifying and differentiating between a pullback and a reversal can help you optimize your trades.
Knowing when the price direction of an asset might change will help you decide when to get out of the market. You can also use it to set up profitable trades. While these concepts may seem challenging for beginners, this detailed TU article simplifies the differences and provides practical insights.
How to identify pullbacks and reverses?
Understanding and differentiating pullbacks from reversals is essential for effective trading. Here's a step-by-step guide to help you identify them confidently:
Step 1: Understand the definitions
Pullback: A short-term pause or counter-move within the overall trend. It’s temporary and offers an opportunity to join the prevailing trend.
Reversal: A longer-term shift in the trend direction, signaling the start of a new trend in the opposite direction.
Step 2: Observe key indicators
Price Action
For a pullback, price typically retraces slightly without breaking key trend lines or significant support/resistance levels.
A reversal often involves a breach of these levels, indicating a potential trend change.
Volume Analysis
Pullback: Occurs on lower volume, reflecting weak opposition to the prevailing trend.
Reversal: Accompanied by higher volume, signaling strong interest in the opposite direction.
Trend Lines
A pullback stays within the boundaries of the trend line.
A reversal breaks the trend line decisively.
Step 3: Use technical tools
Moving Averages
Pullbacks often touch the 20- or 50-day moving averages before resuming the trend.
A reversal may cross below or above key moving averages, indicating a trend shift.
Fibonacci Retracement Levels
Pullbacks commonly retrace to 38.2%, 50%, or 61.8% Fibonacci levels.
A reversal usually surpasses these levels and continues moving in the opposite direction.
Momentum Indicators
Candlestick Patterns
Look for Doji, Engulfing patterns, or Pin bars at key levels for reversals.
Pullbacks usually lack strong reversal patterns and involve smaller candles.
Step 4: Assess the market context
Pullback: Happens in healthy trends, often due to profit-taking or minor corrections.
Reversal: Typically triggered by major fundamental changes, such as earnings reports, economic data, or geopolitical events.
Step 5: Set confirmation rules
Use multiple tools for confirmation. For example:
A trend line break combined with high volume and RSI divergence suggests a reversal.
A price bounce off a moving average with low volume and no divergence points to a pullback.
Step 6: Plan your trades
For Pullbacks:
Enter trades in the direction of the main trend.
Use tools like Fibonacci levels or moving averages to time entries.
Set tight stop-loss levels below/above the pullback level.
For Reversals:
Wait for clear confirmation of the new trend.
Use breakout strategies or counter-trend systems to capitalize on the reversal.
Place stop-losses beyond the previous trend’s high/low.
How to identify reverses: full guide
A trend reversal occurs when the price of an asset changes direction, signalling the end of an existing trend and the start of a new one. This shift can move prices from upward to downward (or vice versa) and is critical for traders and investors to identify for effective decision-making.
The best way to identify a trend reversal is by closely observing market movements and using tools like trend lines and moving averages (MAs). These tools analyze historical prices to help traders predict potential shifts and make informed decisions.
Using trend lines
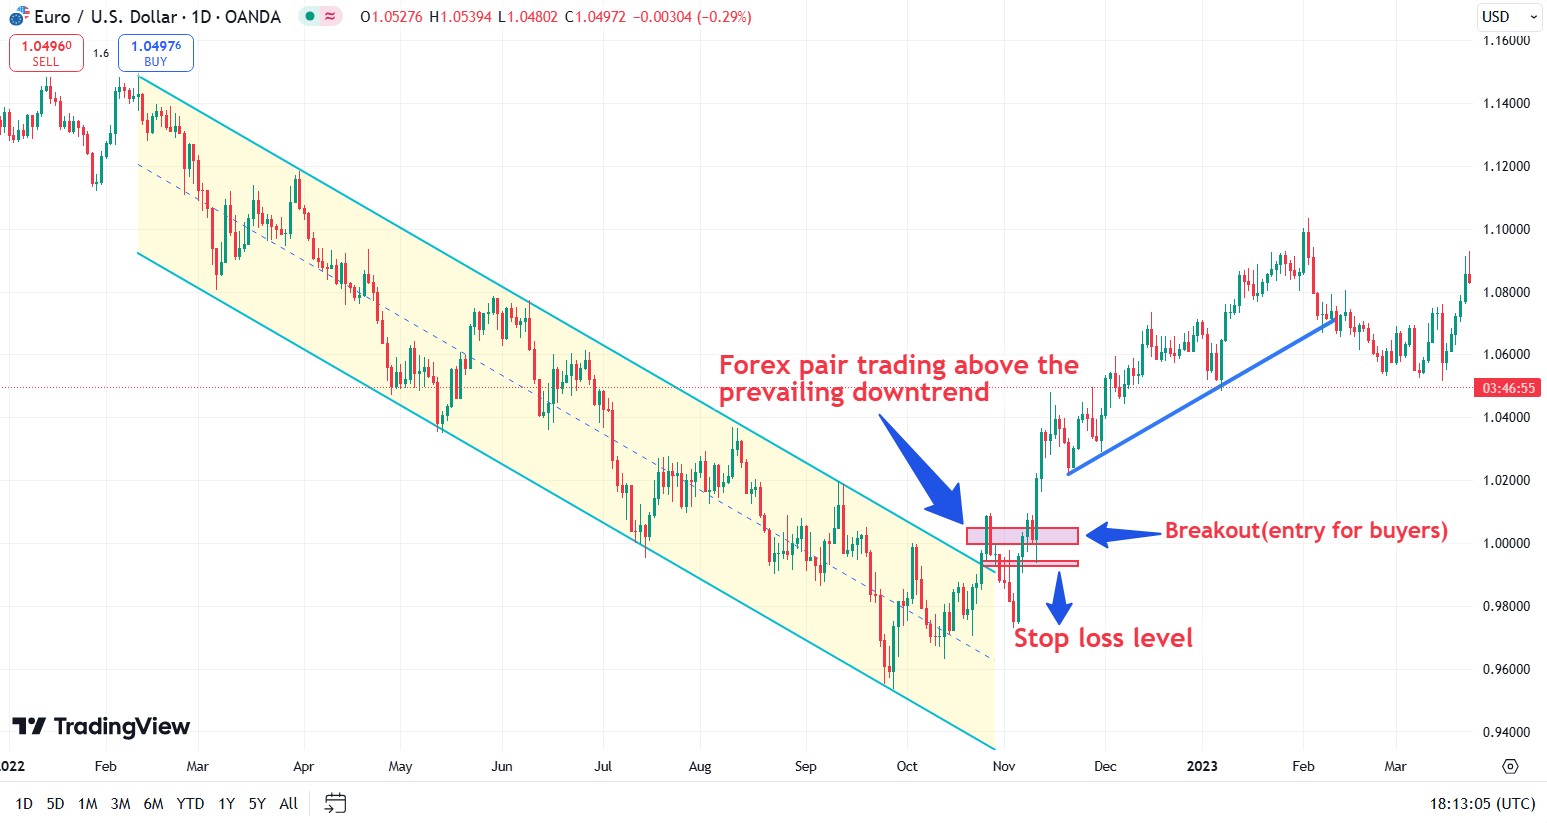
Trend lines are straightforward and effective tools for identifying reversals. By connecting at least two high points (forming an upper trend line) and two low points (forming a lower trend line) on a price chart, traders can visualize support and resistance levels. When the price breaks through one of these lines and moves in the opposite direction, a trend reversal may be underway.
From uptrend to downtrend: The price forms lower highs and lower lows after breaking the upward trend line.
From downtrend to uptrend: The price forms higher highs and higher lows after breaking the downward trend line.
Moving averages (MA)

Moving averages like the Simple Moving Average (SMA) and Exponential Moving Average (EMA) show average price movement over time. Adding MAs to a chart helps traders see current trends and potential reversals. For clarity, avoid placing too many MAs on a single chart. Using MAs alongside other indicators can increase accuracy when identifying trend reversals.
By combining these techniques, traders can better detect and confirm trend reversals, enabling more informed trading decisions.
How to identify pullbacks: full guide
A pullback is a pause or mild decline from the current stock or commodity price chart peak during an upswing. The phrases "pullback" and "retracement" are sometimes used interchangeably since they are similar.
Below are a few ways you can identify a pullback:
Moving Averages. They are one of the most common chart indicators for technical analysis. They show trends by smoothing out prices over various time frames. When faster-moving averages (with shorter periods) are higher than slower-moving averages (with longer periods), it can mean that the price is going up.
Bollinger bands. These are a prominent stock market technical analysis tool. Bollinger bands use standard deviations to predict the anticipated range of movement. When the price drops to the bottom range, traders should consider buying.
Parabolic SAR. Pullbacks can also be found using the Parabolic SAR (stop and reverse) tool. Parabolic SAR looks at a price range to find stocks that have gone down but are now going up again. In the event of a positive move, it displays dots below the stock price. When prices are falling, dots appear above the stock.
Trend pullback vs trend reversal | What is the difference?
Reversals and pullbacks both involve an asset's price declining from a high point, but the key difference is duration and impact. Reversals are long-lasting trend changes often driven by fundamental shifts, while pullbacks are temporary dips within an ongoing trend.
Reversals are typically triggered by significant fundamental changes that alter an asset's perceived value. For example, a company announcing weaker-than-expected profits may lead investors to revise the stock's net present value. Similarly, events like unfavourable legal settlements or a competitor launching a disruptive product can have lasting effects on the underlying business.
These fundamental changes often unfold over multiple trading sessions and may initially resemble short-term downturns. However, as the market adjusts to the new reality, these events lead to sustained changes in the asset's trend, distinguishing reversals from mere pullbacks.
We’ve selected leading brokers that support tools like moving averages, Bollinger Bands, and trend indicators, helping traders identify pullbacks and reversals effectively.
| Currency pairs | Min. deposit, $ | Max. leverage | MT4 | MT5 | Deposit fee, % | Withdrawal fee, % | Inactivity fee, $ | Investor protection | Open an account | |
|---|---|---|---|---|---|---|---|---|---|---|
| 60 | 100 | 1:300 | No | No | No | No | 10 | €20,000 £85,000 SGD 75,000 | Open an account Your capital is at risk. |
|
| 90 | No | 1:500 | Yes | Yes | No | No | No | £85,000 €20,000 €100,000 (DE) | Open an account Your capital is at risk.
|
|
| 68 | No | 1:200 | Yes | Yes | No | No | No | £85,000 SGD 75,000 $500,000 | Open an account Your capital is at risk. |
|
| 80 | 100 | 1:50 | Yes | Yes | No | No | 15 | £85,000 | Study review | |
| 100 | No | 1:30 | No | No | No | Yes | No | $500,000 £85,000 | Open an account Your capital is at risk. |
One advanced technique involves analyzing volume patterns during price retracements

Identifying whether a market movement is a pullback or a reversal is crucial for traders aiming to make informed decisions. One advanced technique involves analyzing volume patterns during price retracements. In a pullback, volume typically decreases as the price moves against the prevailing trend, indicating that the movement is temporary and lacks strong conviction. Conversely, during a reversal, volume often increases, reflecting a significant shift in market sentiment. By closely monitoring volume alongside price action, traders can gain deeper insights into the nature of market movements
Another specialized approach is to observe momentum indicators such as the Relative Strength Index (RSI) or Moving Average Convergence Divergence (MACD). These tools help assess the strength of a trend and identify potential turning points. For instance, if the RSI shows overbought conditions during an uptrend and then begins to decline, it may signal an impending reversal rather than a mere pullback.
Similarly, a bearish crossover in the MACD during a downtrend could indicate a reversal is underway. Integrating momentum analysis with volume patterns and price action provides a comprehensive framework for distinguishing between pullbacks and reversals.
Conclusion
Understanding the difference between a trend pullback and a trend reversal is essential for successful trading. Pullbacks offer temporary price corrections within an ongoing trend, while reversals indicate a complete market shift. Traders can enhance their strategies by using tools like trend lines, moving averages, Bollinger Bands, and momentum indicators. Incorporating volume analysis helps differentiate between temporary retracements and long-term trend changes. Applying these techniques with proper risk management ensures more accurate market predictions and better trading outcomes. Stay informed, use reliable indicators, and align your trading strategies with current market conditions for consistent success.
FAQs
What are the ways to trade a reversal trend?
You can trade a reversal trend in three ways: support and resistance, breakout, or pull out.
What is the difference between a trend and a pattern?
A trend shows the general direction of a price over time. A pattern is a set of data points following a particular direction.
How do you know if it's a pullback or reversal?
The key difference between a pullback and a reversal is duration and impact. A pullback is a temporary dip within an ongoing trend, lasting a few trading sessions, while a reversal signals a lasting change in the overall trend, often reflecting a shift in market sentiment.
Why do pullbacks happen?
When the price of a stock or commodity stops going up or goes against the trend on the stock market, this is called a pullback. It reflects a temporary drop in the price of an asset that is generally going up.
Related Articles
Team that worked on the article
Alamin Morshed is a contributor at Traders Union. He specializes in writing articles for businesses that want to improve their Google search rankings to compete with their competition. With expertise in search engine optimization (SEO) and content marketing, he ensures his work is both informative and impactful.
Chinmay Soni is a financial analyst with more than 5 years of experience in working with stocks, Forex, derivatives, and other assets. As a founder of a boutique research firm and an active researcher, he covers various industries and fields, providing insights backed by statistical data. He is also an educator in the field of finance and technology.
As an author for Traders Union, he contributes his deep analytical insights on various topics, taking into account various aspects.
Mirjan Hipolito is a journalist and news editor at Traders Union. She is an expert crypto writer with five years of experience in the financial markets. Her specialties are daily market news, price predictions, and Initial Coin Offerings (ICO).
Day trading involves buying and selling financial assets within the same trading day, with the goal of profiting from short-term price fluctuations, and positions are typically not held overnight.
Cryptocurrency is a type of digital or virtual currency that relies on cryptography for security. Unlike traditional currencies issued by governments (fiat currencies), cryptocurrencies operate on decentralized networks, typically based on blockchain technology.
Index in trading is the measure of the performance of a group of stocks, which can include the assets and securities in it.
Bollinger Bands (BBands) are a technical analysis tool that consists of three lines: a middle moving average and two outer bands that are typically set at a standard deviation away from the moving average. These bands help traders visualize potential price volatility and identify overbought or oversold conditions in the market.
Forex leverage is a tool enabling traders to control larger positions with a relatively small amount of capital, amplifying potential profits and losses based on the chosen leverage ratio.


-
 Afghanistan
-
 Albania
-
 Algeria
-
 Argentina
-
 Armenia
-
 Australia
-
 Austria
-
 Azerbaijan
-
 Bahamas
-
 Bahrain
-
 Bangladesh
-
 Belgium
-
 Botswana
-
 Brazil
-
 Brunei
-
 Bulgaria
-
 Burma
Burma
-
 Cambodia
-
 Cameroon
-
 Canada
-
 Chile
Chile
-
 China
China
-
 Colombia
-
 Costa Rica
-
 Cote d'Ivoire
-
 Croatia
-
 Cyprus
-
 Czech Republic
-
 Denmark
-
 Dominican Republic
-
 Ecuador
-
 Egypt
Egypt
-
 Estonia
-
 Eswatini
-
 Ethiopia
-
 Finland
-
 France
-
 Georgia
-
 Germany
-
 Ghana
Ghana
-
 Greece
-
 Haiti
Haiti
-
 Hong Kong
-
 Hungary
-
 India
India
-
 Indonesia
-
 Iran, Islamic republic
-
 Iraq
Iraq
-
 Ireland
-
 Israel
-
 Italy
Italy
-
 Jamaica
-
 Japan
Japan
-
 Jordan
-
 Kazakhstan
-
 Kenya
Kenya
-
 Korea
Korea
-
 Kuwait
-
 Kyrgyzstan
-
 Laos
Laos
-
 Latvia
-
 Lebanon
-
 Libyan Arab Jamahiriya
-
 Lithuania
-
 Luxembourg
-
 Macedonia
-
 Madagascar
-
 Malaysia
-
 Malta
Malta
-
 Mauritius
-
 Mexico
-
 Moldova
-
 Mongolia
-
 Montenegro
-
 Morocco
-
 Mozambique
-
 Namibia
-
 Nepal
Nepal
-
 Netherlands
-
 Nigeria
-
 Norway
-
 Oman
Oman
-
 Pakistan
-
 Palestine
-
 Papua New Guinea
-
 Peru
Peru
-
 Philippines
-
 Poland
-
 Portugal
-
 Puerto Rico
-
 Qatar
Qatar
-
 Romania
-
 Rwanda
-
 Saudi Arabia
-
 Serbia
-
 Singapore
-
 Slovakia
-
 Slovenia
-
 Somalia
-
 South Africa
-
 Spain
Spain
-
 Sri Lanka
-
 Sweden
-
 Switzerland
-
 Syrian Arab Republic
-
 Taiwan
-
 Tajikistan
-
 Tanzania, United Republic Of
-
 Thailand
-
 Trinidad and Tobago
-
 Tunisia
-
 Turkey
-
 UAE
UAE
-
 Uganda
-
 Ukraine
-
 United Kingdom
-
United States
-
 Uzbekistan
-
 Venezuela
-
 Vietnam
-
 Yemen
Yemen
-
 Zambia
-
 Zimbabwe
- Forex
- Crypto
