Best Moving Average Strategies For Day Trading


Editorial Note: While we adhere to strict Editorial Integrity, this post may contain references to products from our partners. Here's an explanation for How We Make Money. None of the data and information on this webpage constitutes investment advice according to our Disclaimer.
The best moving average strategies for day trading are:
Strategy 1. 5-8-13 moving averages strategy.
Strategy 2. Using the 20 EMA to determine entry and exit points.
Strategy 3. Trend trading with multiple moving averages (13-26 SMA).
Strategy 4. The golden cross and death cross strategy.
Strategy 5. Mean reversion strategy with bollinger bands.
Day trading is a fast-paced strategy that can lead to solid gains for traders who sharpen their skills. Moving averages aren't just lines on a chart — they’re essential tools for identifying market direction, spotting strong support and resistance zones, and reducing the noise from short-term price swings. In this article, Traders Union experts break down the real value of moving averages in day trading, covering their different types and the practical strategies traders use to make better decisions.
The best moving average strategies for day trading
Expert traders have identified five of the most effective moving average strategies for day trading. These approaches help traders navigate market trends, identify high-probability trade setups, and optimize their entry and exit points.

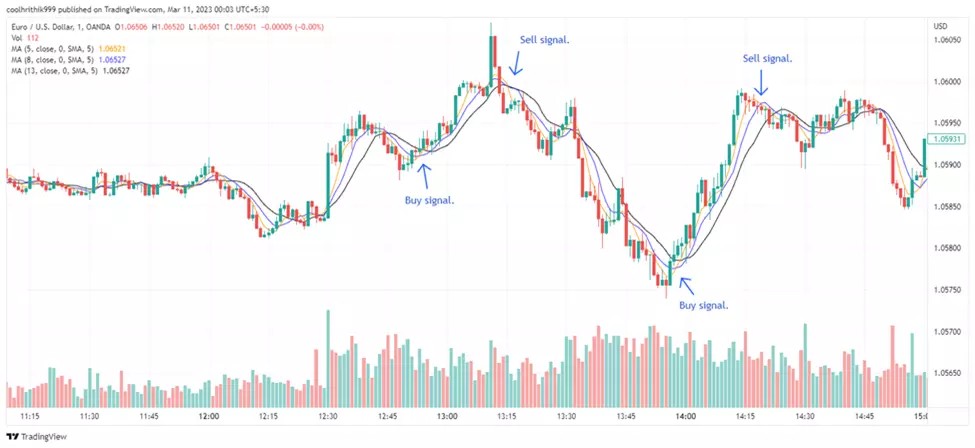
1. 5-8-13 moving averages strategy
A powerful short-term trading approach utilizes three Simple Moving Averages (SMAs) set at 5, 8, and 13 periods. These values, derived from the Fibonacci sequence, help traders assess short-term momentum shifts. The strategy involves monitoring moving average crossovers:
A buy signal occurs when the 5-day SMA crosses above the 8-day SMA and later above the 13-day SMA.
A sell signal is generated when the opposite happens — when the 5-day SMA moves below the 8-day SMA, followed by a drop below the 13-day SMA.
This strategy is particularly useful for capturing momentum trends and identifying sideways markets. If moving averages start converging without clear direction, it signals weak intraday trends, advising traders to stay on the sidelines. Additionally, bearish crossovers across multiple time frames can indicate short-selling opportunities, with positions closed once the moving averages start to rise again.
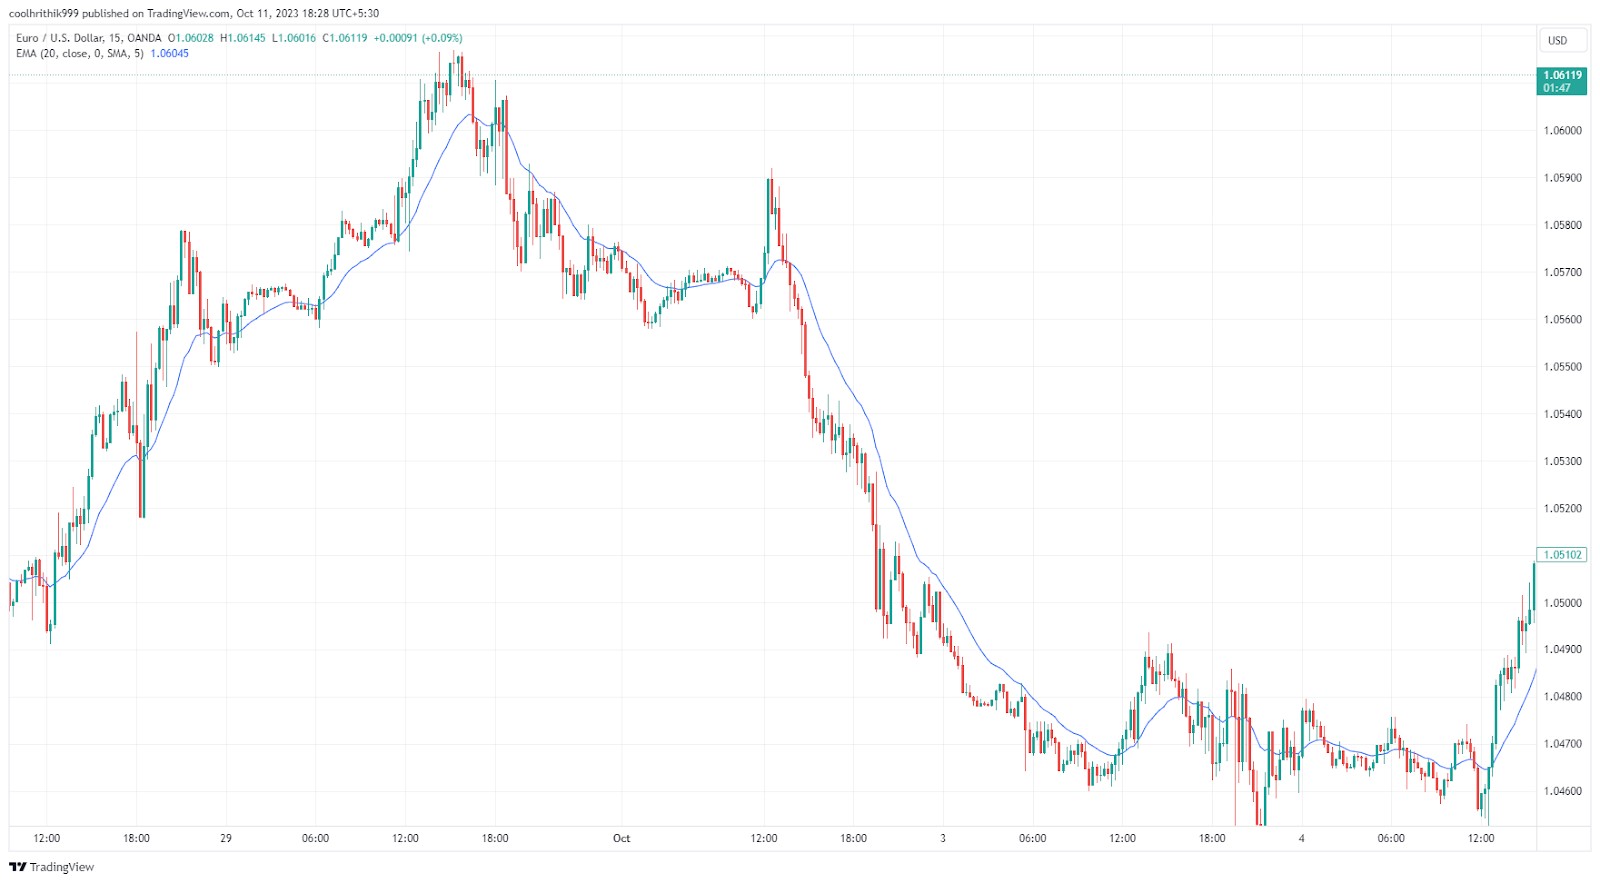
2. Using the 20 EMA to determine entry and exit points
The 20-period Exponential Moving Average (EMA) is a widely used tool to identify ideal trade entries and exits. Day traders often use different types of moving averages, such as the Volume Weighted Moving Average (VWMA) or Smoothed Moving Average (SMA), to refine their strategy.
When an asset’s price crosses below the 20 EMA, it can signal an opportunity to exit a long position or enter a short trade.
Conversely, if the price rises above the 20 EMA, traders may look to enter a long position.
By using the 20 EMA as a dynamic support and resistance level, traders can improve their decision-making and increase profitability.
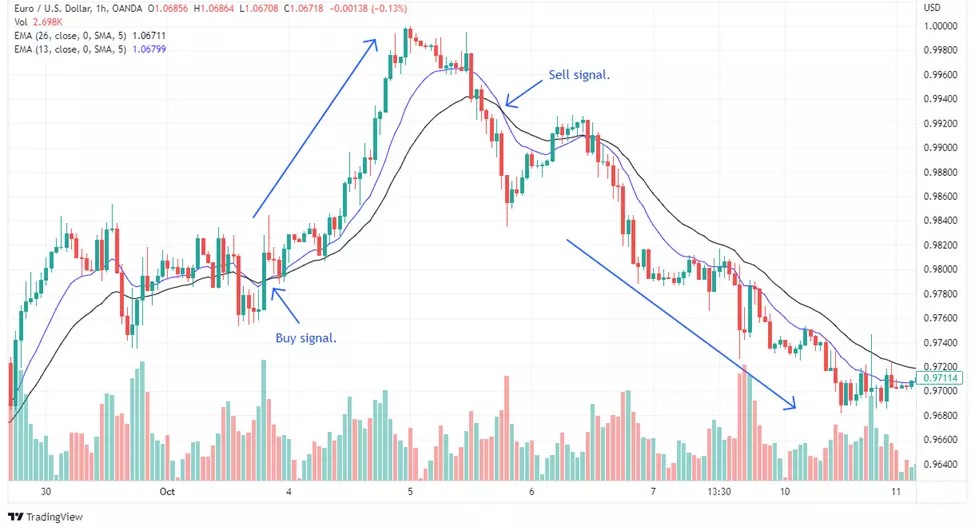
3. Trend trading with multiple moving averages (13-26 SMA)
This strategy employs longer moving averages — specifically the 13-day and 26-day SMAs — to identify and trade strong trends.
A buy signal is confirmed when the 13-day SMA crosses above the 26-day SMA, suggesting an upward trend.
A sell signal occurs when the 13-day SMA moves below the 26-day SMA, indicating a potential downtrend.
While this method provides more reliable trend confirmations than shorter-period moving averages, it comes at the cost of slightly delayed entry signals. Traders can capitalize on this strategy by entering trades aligned with the prevailing trend and avoiding premature exits.
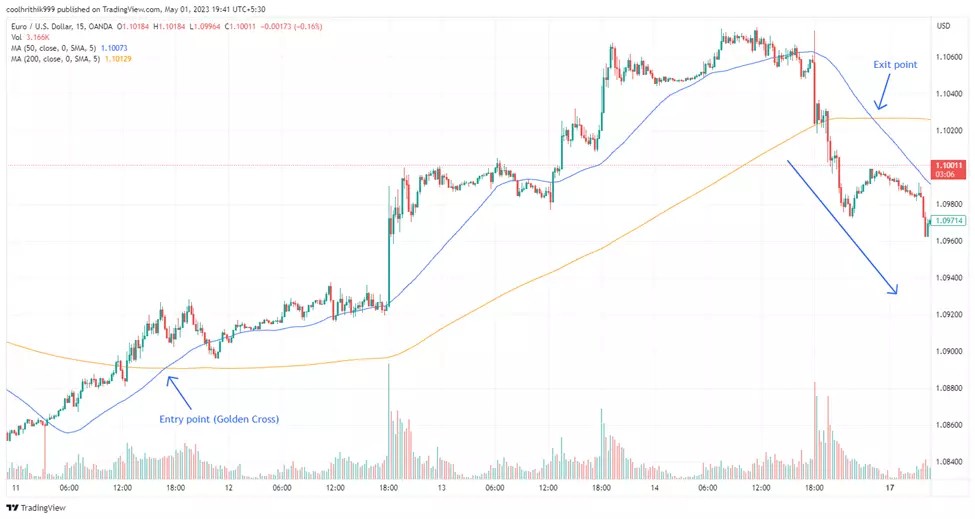
4. The golden cross and death cross strategy
One of the most well-known moving average strategies revolves around crossover signals between the 50-day and 200-day SMAs.
Golden cross. Occurs when the 50-day SMA moves above the 200-day SMA, indicating bullish momentum and a potential long entry.
Death cross. Happens when the 50-day SMA crosses below the 200-day SMA, signaling bearish momentum and a possible short trade.
These long-term moving average crossovers are particularly effective for spotting major trend shifts, making them useful for both day traders and swing traders.
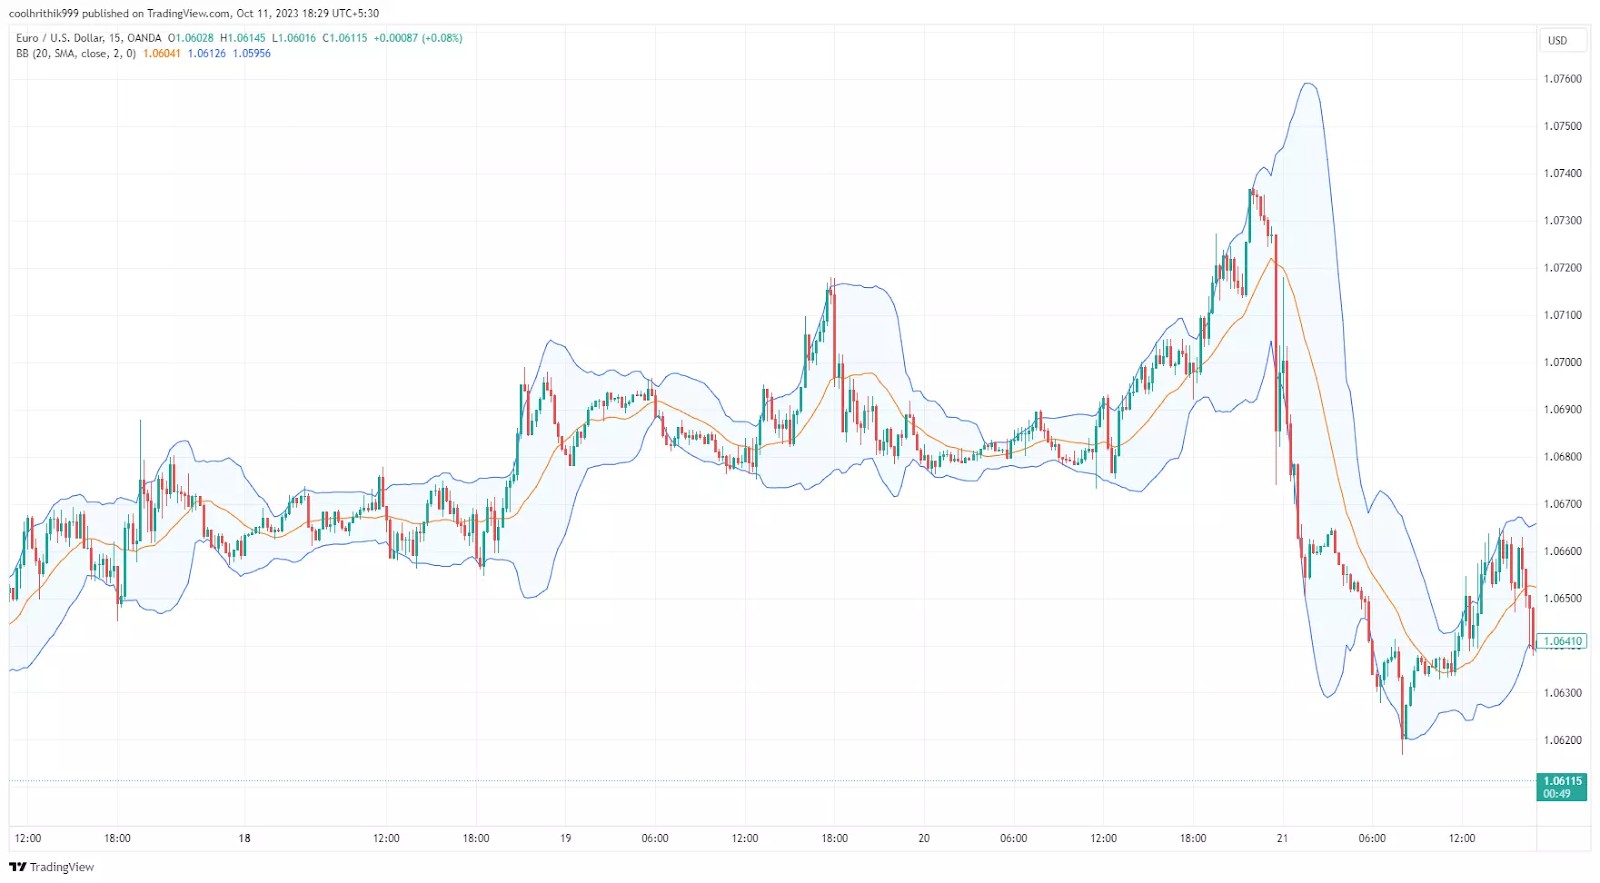
5. Mean reversion strategy with bollinger bands
Mean reversion trading involves capitalizing on price fluctuations around a central moving average. This approach often integrates Bollinger Bands, where the 20-day SMA serves as the baseline for identifying potential reversals.
If the price moves significantly below the 20-day SMA, it may indicate an oversold condition, presenting a buying opportunity.
Conversely, if the price rises far above the 20-day SMA, traders might look for a short-selling opportunity.
A common technique is to use the upper Bollinger Band as a stop-loss level or reference previous swing highs to refine exit points. Since prices often return to the mean even in trending markets, this strategy can help traders capture short-term price corrections efficiently.
Top trading platforms for using moving averages
For traders serious about using moving average (MA) strategies, TradingView remains one of the most reliable platforms available. It offers a wide range of built-in and customizable indicators, giving users the flexibility to fine-tune their approach with precision. What makes it even more practical is its compatibility with several top brokers — allowing you to analyze and trade directly from the same interface without switching platforms.
Below is a comparison of leading brokers that integrate with TradingView, making it easier to apply and execute MA-based strategies in real time.
| TradingView support | Account min. | Demo | Deposit Fee | Withdrawal fee | Foundation year | Android | iOS | Regulation | TU overall score | Open an account | |
|---|---|---|---|---|---|---|---|---|---|---|---|
| Yes | No | Yes | No | $25 for wire transfers out | 2007 | Yes | Yes | FINRA, SIPC | 7.63 | Open an account Via eOption's secure website. |
|
| Yes | No | No | No | No charge | 2014 | Yes | Yes | FCA, FSCS, OSC, BCSC, ASC, MSC, IIROC, CIPF. | 7.39 | Open an account Via Wealthsimple's secure website. |
|
| Yes | No | No | No | $25 | 1919 | Yes | Yes | FDIC, FINRA, SIPC, SEC, CFTC, NFA | 6.61 | Study review | |
| Yes | No | No | No | No charge up to a limit | 2015 | Yes | Yes | FCA, SEC, FINRA | 7.69 | Study review | |
| Yes | No | Yes | No | No | 1978 | Yes | Yes | FCA, ASIC, MAS, CFTC, NFA, CIRO | 7.45 | Open an account Your capital is at risk. |
Why trust us
We at Traders Union have analyzed financial markets for over 14 years, evaluating brokers based on 250+ transparent criteria, including security, regulation, and trading conditions. Our expert team of over 50 professionals regularly updates a Watch List of 500+ brokers to provide users with data-driven insights. While our research is based on objective data, we encourage users to perform independent due diligence and consult official regulatory sources before making any financial decisions.
Learn more about our methodology and editorial policies.
Understanding moving averages in day trading
Moving averages (MAs) are core tools in a day trader’s toolkit — not just for smoothing out price noise, but for revealing the market’s underlying direction. By calculating the average price of an asset over a chosen period, moving averages help traders cut through intraday volatility and focus on meaningful trends.
In day trading, shorter timeframes matter. While long-term investors rely on 50-day or 200-day MAs to gauge broader trends, intraday traders often turn to 5-, 9-, or 21-period moving averages to spot momentum shifts and make quicker decisions. These short-term averages can double as dynamic support or resistance levels, guiding entries and exits in fast-moving markets.
Exponential moving averages (EMAs) are often preferred over simple moving averages (SMAs) in day trading, as they react faster to recent price action. This responsiveness makes them valuable for scalping or short-term breakout strategies, where timing is critical.
The math behind a moving average is simple but effective: to calculate a 5-period SMA, for example, you total the last five closing prices and divide by five. This rolling average updates with each new candle, helping traders anticipate reversals or confirm trend strength.
Ultimately, the “best” moving average depends on your trading style. But when used correctly, moving averages can become more than just a trend filter — they act as a real-time roadmap in an otherwise chaotic market.
Different types of moving averages

1. Simple moving average (SMA)
The SMA is the most commonly used moving average, calculated by averaging an asset's closing prices over a set period. Each data point carries equal weight, which means the SMA reacts more slowly to price changes. While effective in identifying trend direction, support, and resistance levels, the SMA may lag behind fast-moving markets.
2. Exponential moving average (EMA)
The EMA addresses the lagging issue of the SMA by giving more importance to recent price data. It first calculates an SMA, then applies a smoothing factor (multiplier) to weigh recent prices more heavily. This makes the EMA more responsive to price fluctuations, making it a preferred choice for short-term traders.
3. Weighted moving average (WMA)
The WMA also prioritizes recent data but uses a weighted formula to enhance accuracy. Unlike the EMA, which applies an exponential formula, the WMA assigns different weights based on a descending scale. The formula for a 5-day WMA would be:
WMA=(P1×5)+(P2×4)+(P3×3)+(P4×2)+(P5×1)5+4+3+2+1WMA = \frac{(P1 \times 5) + (P2 \times 4) + (P3 \times 3) + (P4 \times 2) + (P5 \times 1)}{5 + 4 + 3 + 2 + 1}WMA=5+4+3+2+1(P1×5)+(P2×4)+(P3×3)+(P4×2)+(P5×1)
4. Smoothed moving average (SMMA)
The SMMA functions similarly to the EMA but places equal importance on historical and recent price data. It is primarily used to reduce price noise over a longer timeframe, making it beneficial for identifying steady trends.
5. Volume weighted moving average (VWMA)
Unlike traditional moving averages that focus only on price, the VWMA incorporates trading volume, providing a deeper market analysis. It is calculated using the formula:
VWMA=∑(ClosingPrice×Volume)∑VolumeVWMA = \frac{\sum (Closing Price \times Volume)}{\sum Volume}VWMA=∑Volume∑(ClosingPrice×Volume)
This approach helps traders assess the strength of price movements based on trading activity.
Additional variations include the Least Squares Moving Average (LSMA) for filtering out price spikes and the Arnaud Legoux Moving Average (ALMA) for smoother trend detection.
Optimal moving average periods for day trading
9 or 10-Period MA
For short-term day traders, speed is essential. The 9-period or 10-period EMA reacts swiftly to price shifts, making it a favorite for scalpers. It serves as a directional filter, helping traders assess the market's short-term momentum.
21-Period MA
The 21-period MA is ideal for traders who follow short- to medium-term trends. It aligns well with market movements and offers a balanced view of price action, making it useful for trend-following strategies.
50-Period MA
Longer moving averages like the 50-period MA help traders gauge overall market direction. It provides a broader perspective, making it a preferred tool for identifying long-term trends while still being relevant for intraday strategies.
How to use moving averages effectively
Selecting the right type of moving average
The choice between SMA and EMA depends on trading style:
SMA. Best for identifying long-term trends with stable signals.
EMA. More effective for short-term strategies requiring quick trend recognition.
Choosing the right moving average length
Shorter MAs (e.g., 10 or 20 periods) provide faster signals but can be prone to false alerts. Longer MAs (e.g., 50, 100, or 200 periods) offer greater stability but may delay entry signals.
Using multiple moving averages
A common approach is to combine two MAs to identify crossovers:
When a shorter MA crosses above a longer MA, it generates a bullish signal.
When a shorter MA crosses below a longer MA, it produces a bearish signal.
Combining moving averages with other indicators
Incorporating chart patterns
MAs can be used alongside chart patterns like triangles, head and shoulders, and flags to confirm trends and potential breakout points.
Creating automated trading systems
Many trading platforms allow traders to build Expert Advisors (EAs) that automate moving average strategies, reducing manual workload and ensuring disciplined execution.
Pros and cons of using moving averages for day trading
- Pros
- Cons
Reliable for trend identification. Helps traders detect bullish and bearish trends early.
Useful for support and resistance. Acts as a guide for potential trade entries and exits.
Smooths market volatility. Reduces noise and clarifies price movements.
Works well with other indicators. Enhances trading accuracy when combined with tools like RSI and MACD.
Forms the basis for trading strategies. Helps traders develop structured trading plans.
Lagging nature. Moving averages are reactive and may delay trade signals.
False signals in choppy markets. MAs can generate misleading signals in sideways markets.
Fixed parameters. Do not automatically adjust to changing market conditions.
The most versatile tools in technical analysis

If you’re day trading with moving averages, don’t just focus on the crossover itself — pay close attention to the angle of the slope before entering a trade. A flat or barely-angled moving average, even after a crossover, is a red flag. It means price is consolidating, not trending. A sharp upward or downward angle, on the other hand, signals actual momentum behind the move. Pro traders use this slope confirmation to avoid false breakouts and limit entries to high-probability setups. Set an alert not just for a crossover, but also for when the EMA angle crosses a certain degree on platforms like TradingView. That’s how you filter noise.
Here’s another edge: combine a short EMA (like 9) and a mid-range EMA (like 21) with the Volume Weighted Average Price (VWAP) as a third confluence tool. Most beginners trade MAs blindly — but when price crosses both EMAs and holds above the VWAP, it shows not only momentum, but volume-backed commitment. That combo filters out false moves and gives extra conviction for entries. Bonus tip? Watch how price reacts to the EMAs right before big economic news releases — smart money often leaves footprints in those moments. This tells you where liquidity is stacking up.
Conclusion
Moving averages are powerful tools for day traders, offering a structured way to identify trends, entry points, and trade signals. However, they work best when combined with other indicators and market analysis. Whether using fast EMAs for scalping or longer SMAs for trend trading, success depends on how well traders adapt these tools to their strategies. With the right approach, moving averages can significantly enhance decision-making and overall trading performance.
FAQs
Can moving averages predict market reversals?
Moving averages don’t predict reversals but can help confirm them. When combined with volume spikes or momentum indicators, a crossover or price break below/above key averages can signal a possible shift in trend.
Is it better to use EMAs or SMAs for day trading?
EMAs are usually better for day trading because they react faster to recent price movements. SMAs can still be useful, but their slower response makes them more suited for swing or position trading.
Do moving averages work in all market conditions?
No, they tend to struggle in sideways or choppy markets, often giving false signals. They're most effective during trending phases, so it's smart to pair them with trend filters or volatility indicators.
Can moving averages be used for setting stop-loss levels?
Yes, many traders place stop-losses just beyond a key moving average line. For example, a stop below the 20 EMA in an uptrend gives the trade room to breathe without exiting too early.
Related Articles
Team that worked on the article
Mikhail Vnuchkov joined Traders Union as an author in 2020. He began his professional career as a journalist-observer at a small online financial publication, where he covered global economic events and discussed their impact on the segment of financial investment, including investor income. With five years of experience in finance, Mikhail joined Traders Union team, where he is in charge of forming the pool of latest news for traders, who trade stocks, cryptocurrencies, Forex instruments and fixed income.
Chinmay Soni is a financial analyst with more than 5 years of experience in working with stocks, Forex, derivatives, and other assets. As a founder of a boutique research firm and an active researcher, he covers various industries and fields, providing insights backed by statistical data. He is also an educator in the field of finance and technology.
As an author for Traders Union, he contributes his deep analytical insights on various topics, taking into account various aspects.
Mirjan Hipolito is a journalist and news editor at Traders Union. She is an expert crypto writer with five years of experience in the financial markets. Her specialties are daily market news, price predictions, and Initial Coin Offerings (ICO).
Scalping in trading is a strategy where traders aim to make quick, small profits by executing numerous short-term trades within seconds or minutes, capitalizing on minor price fluctuations.
An investor is an individual, who invests money in an asset with the expectation that its value would appreciate in the future. The asset can be anything, including a bond, debenture, mutual fund, equity, gold, silver, exchange-traded funds (ETFs), and real-estate property.
Volatility refers to the degree of variation or fluctuation in the price or value of a financial asset, such as stocks, bonds, or cryptocurrencies, over a period of time. Higher volatility indicates that an asset's price is experiencing more significant and rapid price swings, while lower volatility suggests relatively stable and gradual price movements.
Xetra is a German Stock Exchange trading system that the Frankfurt Stock Exchange operates. Deutsche Börse is the parent company of the Frankfurt Stock Exchange.
Bollinger Bands (BBands) are a technical analysis tool that consists of three lines: a middle moving average and two outer bands that are typically set at a standard deviation away from the moving average. These bands help traders visualize potential price volatility and identify overbought or oversold conditions in the market.


-
 Afghanistan
-
 Albania
-
 Algeria
-
 Argentina
-
 Armenia
-
 Australia
-
 Austria
-
 Azerbaijan
-
 Bahamas
-
 Bahrain
-
 Bangladesh
-
 Belgium
-
 Botswana
-
 Brazil
-
 Brunei
-
 Bulgaria
-
 Burma
Burma
-
 Cambodia
-
 Cameroon
-
 Canada
-
 Chile
Chile
-
 China
China
-
 Colombia
-
 Costa Rica
-
 Cote d'Ivoire
-
 Croatia
-
 Cyprus
-
 Czech Republic
-
 Denmark
-
 Dominican Republic
-
 Ecuador
-
 Egypt
Egypt
-
 Estonia
-
 Eswatini
-
 Ethiopia
-
 Finland
-
 France
-
 Georgia
-
 Germany
-
 Ghana
Ghana
-
 Greece
-
 Haiti
Haiti
-
 Hong Kong
-
 Hungary
-
 India
India
-
 Indonesia
-
 Iran, Islamic republic
-
 Iraq
Iraq
-
 Ireland
-
 Israel
-
 Italy
Italy
-
 Jamaica
-
 Japan
Japan
-
 Jordan
-
 Kazakhstan
-
 Kenya
Kenya
-
 Korea
Korea
-
 Kuwait
-
 Kyrgyzstan
-
 Laos
Laos
-
 Latvia
-
 Lebanon
-
 Libyan Arab Jamahiriya
-
 Lithuania
-
 Luxembourg
-
 Macedonia
-
 Madagascar
-
 Malaysia
-
 Malta
Malta
-
 Mauritius
-
 Mexico
-
 Moldova
-
 Mongolia
-
 Montenegro
-
 Morocco
-
 Mozambique
-
 Namibia
-
 Nepal
Nepal
-
 Netherlands
-
 Nigeria
-
 Norway
-
 Oman
Oman
-
 Pakistan
-
 Palestine
-
 Papua New Guinea
-
 Peru
Peru
-
 Philippines
-
 Poland
-
 Portugal
-
 Puerto Rico
-
 Qatar
Qatar
-
 Romania
-
 Rwanda
-
 Saudi Arabia
-
 Serbia
-
 Singapore
-
 Slovakia
-
 Slovenia
-
 Somalia
-
 South Africa
-
 Spain
Spain
-
 Sri Lanka
-
 Sweden
-
 Switzerland
-
 Syrian Arab Republic
-
 Taiwan
-
 Tajikistan
-
 Tanzania, United Republic Of
-
 Thailand
-
 Trinidad and Tobago
-
 Tunisia
-
 Turkey
-
 UAE
UAE
-
 Uganda
-
 Ukraine
-
 United Kingdom
-
United States
-
 Uzbekistan
-
 Venezuela
-
 Vietnam
-
 Yemen
Yemen
-
 Zambia
-
 Zimbabwe
- Forex
- Crypto
