Overbought And Oversold Indicators Explained


Editorial Note: While we adhere to strict Editorial Integrity, this post may contain references to products from our partners. Here's an explanation for How We Make Money. None of the data and information on this webpage constitutes investment advice according to our Disclaimer.
The key overbought and oversold indicators are:
RSI. Helps spot potential reversals by identifying overbought and oversold conditions.
Stochastic Oscillator. Detects momentum shifts to highlight possible trend reversals.
Parabolic SAR. Indicates trend direction and potential reversal points.
Fibonacci Retracement. Identifies key support and resistance areas for price reversals.
Bollinger Bands. Measures price volatility to signal overbought or oversold conditions.
MACD. Shows trend strength and direction, helping to spot buy/sell opportunities.
In this article, we explore overbought and oversold Forex indicators, essential tools in technical analysis used to identify potential reversal points in asset prices. Understanding how these indicators function can help traders spot key market signals and find the right moments to enter or exit trades.
Best overbought and oversold Indicators
The key overbought and oversold indicators are essential tools for identifying potential market reversals, momentum shifts, and trend changes. Here's a detailed overview.
RSI (Relative Strength Index)
The RSI measures the speed and change of price movements, providing insights into whether a market is overbought (above 70) or oversold (below 30). It helps traders spot potential reversals by analyzing momentum and identifying divergence between price and the indicator.
Stochastic Oscillator
This momentum indicator compares a security's closing price to its price range over a specific period. Values above 80 suggest overbought conditions, while values below 20 indicate oversold conditions. It is especially useful for detecting momentum shifts and highlighting possible trend reversals in conjunction with price patterns.
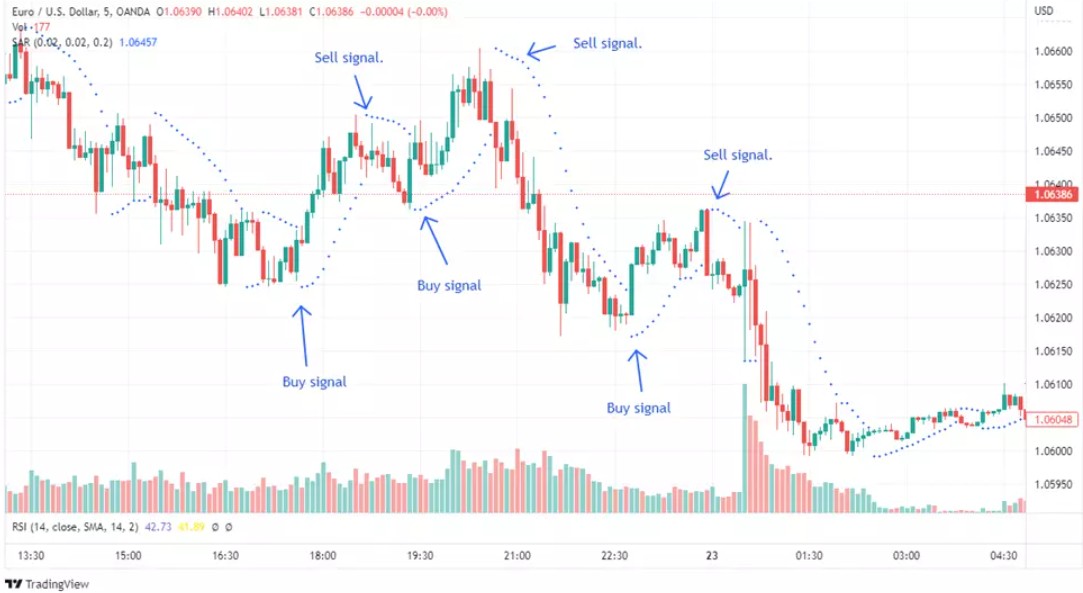
Parabolic SAR (Stop and Reverse)
The Parabolic SAR helps identify trend direction and potential reversal points by plotting dots above or below the price chart. When the dots switch positions (e.g., from above to below the price), it may signal a reversal, making this indicator valuable in trending markets.
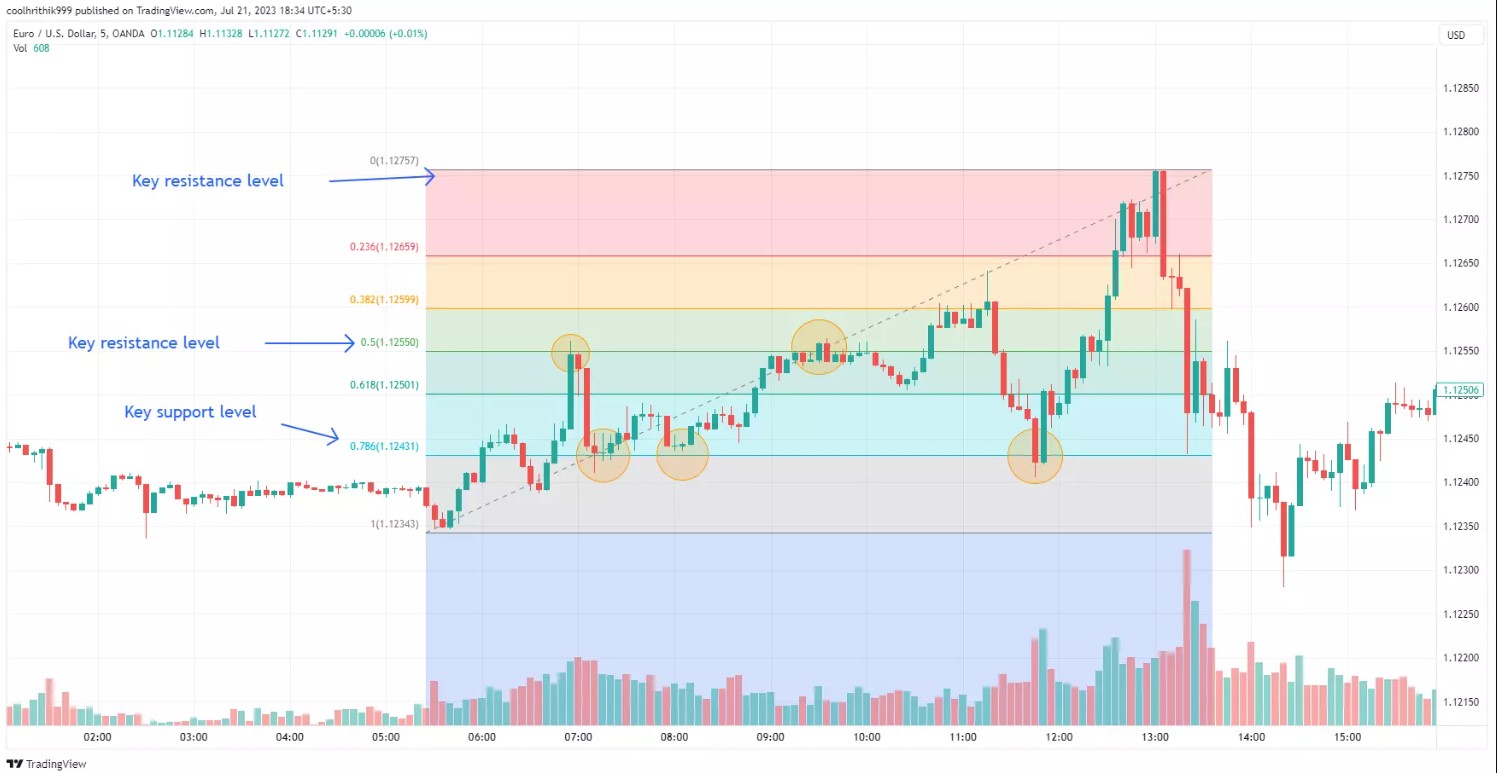
Fibonacci Retracement
Fibonacci retracement levels are horizontal lines based on key Fibonacci ratios (23.6%, 38.2%, 50%, 61.8%, etc.) that indicate potential support and resistance levels. These levels are often used to predict areas where price might reverse, especially after significant market moves.
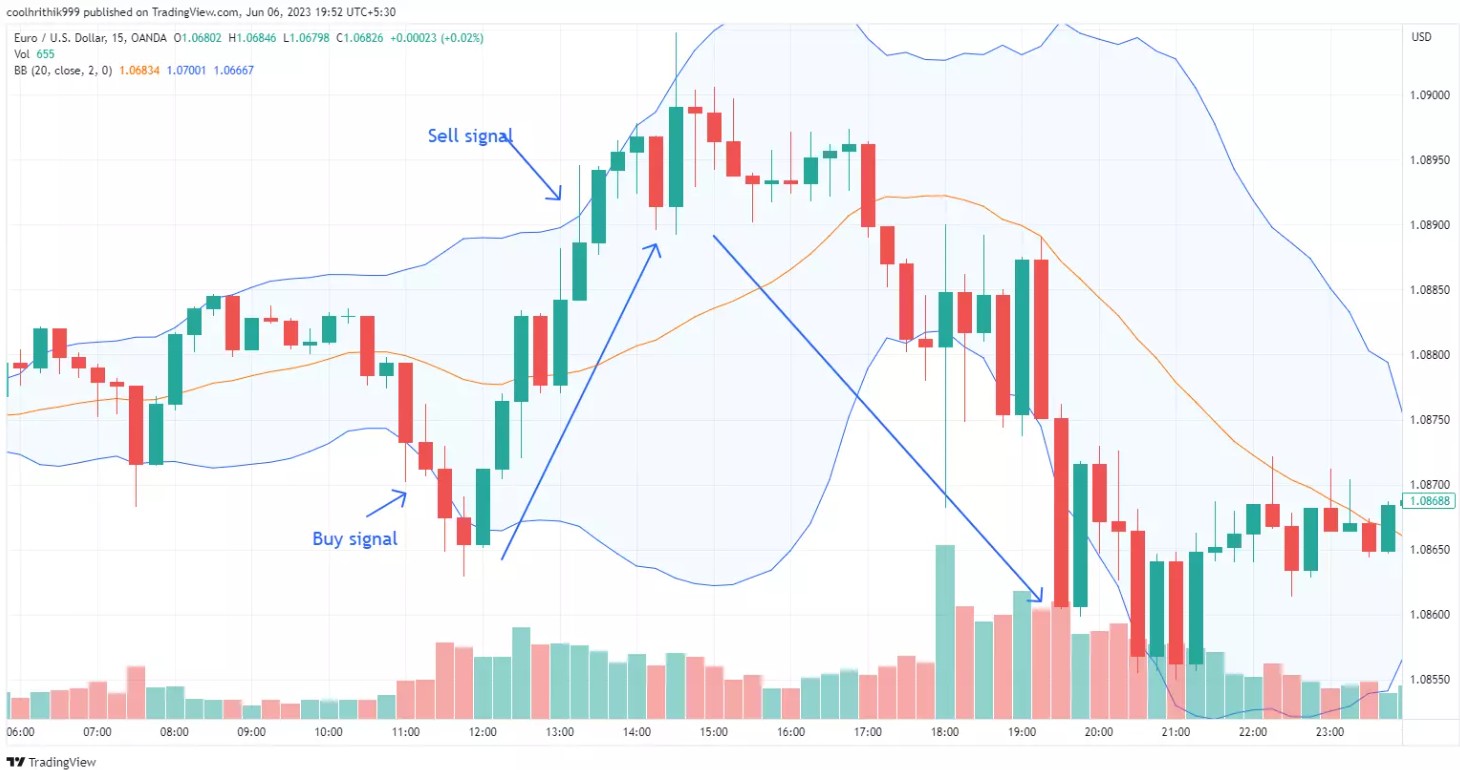
Bollinger Bands
Bollinger Bands consist of a moving average (middle band) and two standard deviation lines (upper and lower bands). When prices move near the upper band, the market might be overbought; when near the lower band, it could be oversold. This indicator measures price volatility and helps traders identify overextended conditions.
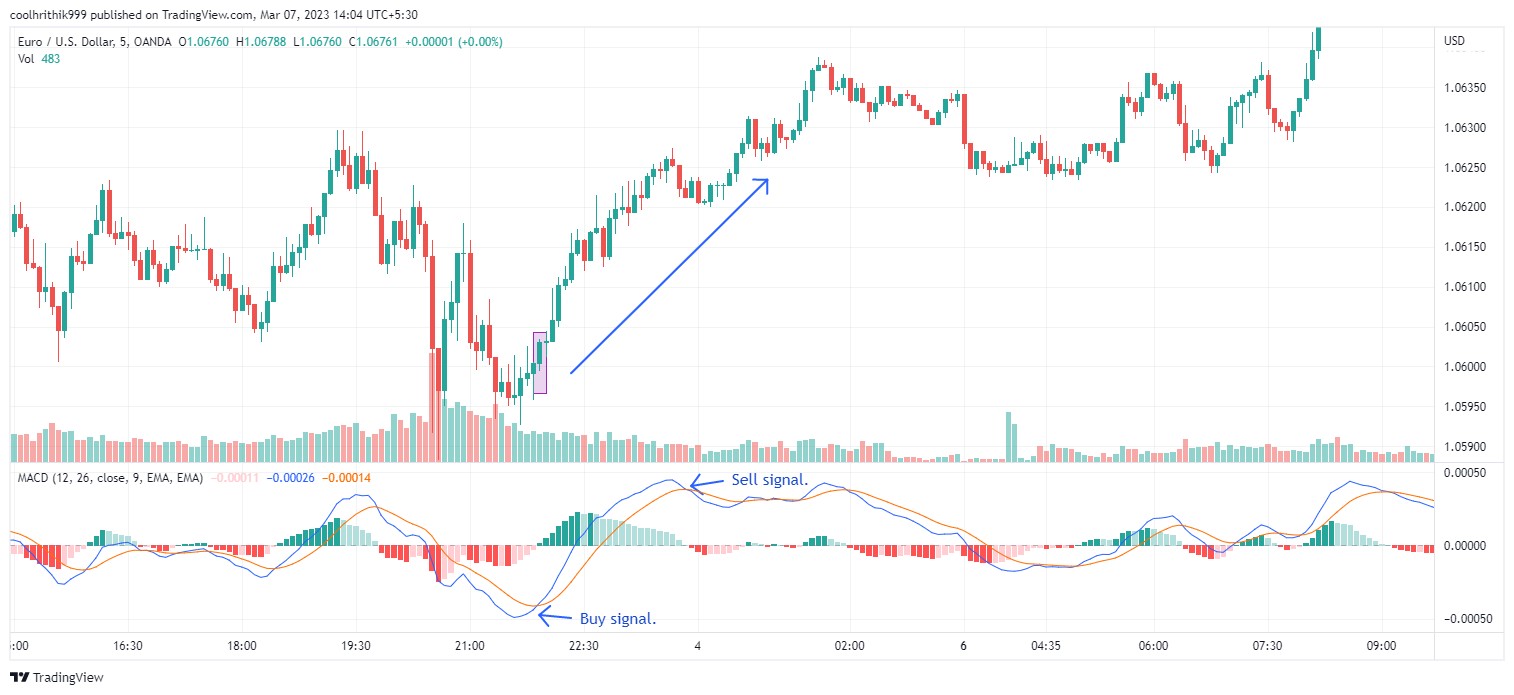
MACD (Moving Average Convergence Divergence)
The MACD combines two moving averages of different lengths to show the strength, direction, and duration of a trend. It is particularly useful for identifying potential buy or sell opportunities when the MACD line crosses the signal line, or when divergence appears between the MACD and the price.
By combining these indicators, traders can gain a comprehensive understanding of market conditions and make more informed trading decisions. However, it is essential to use them in conjunction with other tools, price action analysis, and risk management strategies for optimal results.
Definition of overbought and oversold indicators
Overbought and oversold indicators are technical tools used by traders to assess whether an asset’s price is unjustifiably high (overbought) or excessively low (oversold). These indicators help traders anticipate potential price reversals, allowing them to make buy or sell decisions. Examples include RSI, Stochastic Oscillator, and Bollinger Bands.
Importance of overbought and oversold indicators in trading
Understanding overbought and oversold conditions is critical for effective trading. These indicators enable traders to:
Spot when the market’s losing steam. These tools, like RSI or Stochastic, are great for understanding when the market might be stretched too thin. An overbought or oversold reading usually means the market has moved too far too quickly and could be due for a pullback. But don’t jump in based on these signals alone—always look for other signs, like price action or another indicator, to confirm that the reversal is real.
See the full picture. Beginners often use these indicators on their own, but combining them with volume analysis can give you a better understanding. For example, if an overbought condition is followed by falling volume, it might signal that the trend is weakening, even though the price hasn't moved yet. Look for these volume divergences to help you spot a more reliable reversal.
Take short-term or long-term trades. These indicators work well for short-term trading, but they can be misleading in longer-term trends. In a strong bull market, for example, an overbought reading can last for quite a while without any reversal. Similarly, in a bear market, the market can stay oversold for longer than you'd expect. Understanding this helps you manage your expectations and trade with more clarity.
Time your trades better. While these indicators are often used to predict reversals, they’re also great for fine-tuning your entry and exit points. For instance, if the market’s been dropping hard and hits an oversold condition, that could be a good time to buy. Or, if there’s been a long rally and the market’s overbought, it might be time to exit. Knowing how to read these signals in context keeps you from getting in too late or out too early.
Understand market sentiment to add more context to your analysis. These indicators are most effective when you understand the broader market mood. In a bullish market, an overbought reading doesn’t always mean a reversal is near—it might just mean the rally is getting stronger. Similarly, if the market sentiment is bearish, an oversold reading might just mean a short-term bounce. By keeping an eye on sentiment, you can avoid misinterpreting the signals and making decisions that go against the market trend.
What is overbought?
Overbought levels refer to a situation where the price of an asset has experienced a consistent and significant upward movement, leading to a price that surpasses its actual value. This phenomenon is often associated with various financial instruments, such as stocks, options, Forex, and commodities, and it plays a crucial role in deter mining market conditions and predicting future trends.
When a stock is deemed overbought, it suggests that market participants have been aggressively buying the asset, causing its price to surge beyond its fundamental worth. However, this steep ascent cannot continue indefinitely, and a point of maturity or extremity is reached where traders perceive the asset as excessively expensive. At this juncture, it is highly likely that a pullback will occur, causing the price to decline to a more reasonable level.
What is oversold?
Conversely, oversold levels occur when the price of an asset experiences a significant and sustained decline, leading to a value that is lower than its actual worth. Like overbought conditions, oversold situations are observed across various financial markets, including stocks, options, Forex, and commodities.
An oversold stock indicates that market participants have been heavily selling the asset, causing its price to plummet below its intrinsic value. This scenario implies that the short-term declines are likely to be exhausted soon, creating a potential opportunity for a price rebound or rally.
| Parameter | Overbought | Oversold |
|---|---|---|
| Definition | Securities are trading above their fair value | Securities are trading below their intrinsic value |
| Price Movement | Upward or bullish momentum | Downward or bearish momentum |
| Caused By | Intense buying of a security | Excessive selling of stock |
| Major Triggers | Positive news or optimistic buyer sentiments | Negative information or pessimistic seller sentiments |
| Relative Strength Index (RSI) | RSI reading of 70 or higher | RSI reading of 30 or lower |
| Stochastic Oscillator | Stochastic Oscillator above 80 points | Stochastic Oscillator below 20 points |
| Indicates | Potential period of price decline or pullback | Potential market rally or price rebound |
How to use the Stochastic Oscillator
The Stochastic Oscillator, developed by George C. Lane in the 1950s, is a momentum metric used by analysts and traders to predict potential reversals. It compares the most recent closing price to the range for a given period, typically 14 days. The Stochastic Oscillator is a valuable tool for traders to assess overbought and oversold conditions in the financial markets. It is a range-bound indicator, meaning its values always fall between 0 and 100.
Overbought conditions
When the Stochastic Oscillator reading climbs above 80, it is considered to be in the overbought range. This suggests that the asset's price has experienced a significant and rapid upward movement, potentially making it vulnerable to a pullback or price correction. Traders should be cautious and consider potential selling opportunities in this scenario.

Oversold conditions
Conversely, when the Stochastic oscillator reading falls below 20, it indicates an oversold condition. This implies that the asset's price has endured a substantial and swift downward movement, presenting an opportunity for a potential price rebound. Traders may see this as a signal to explore buying opportunities or taking long positions.
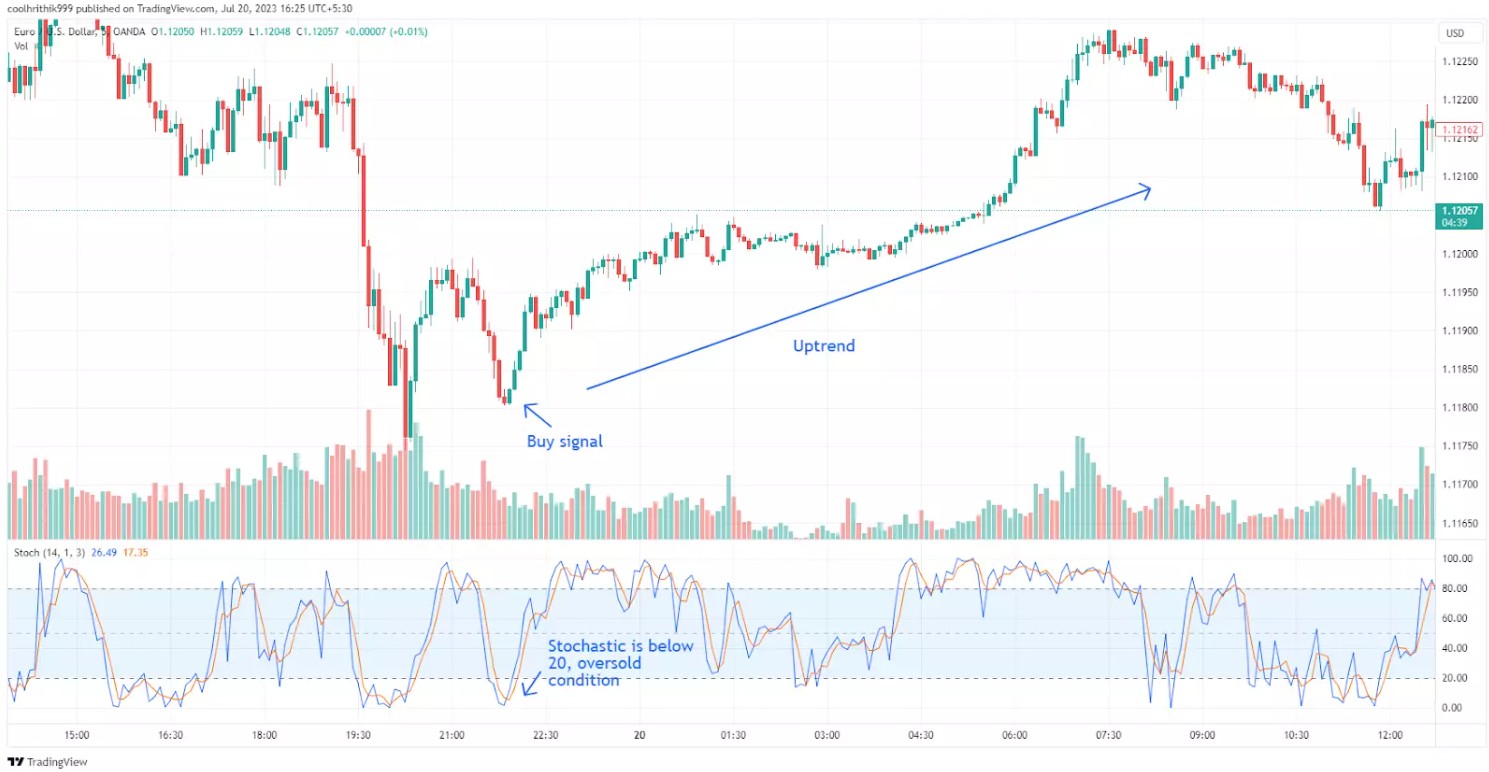
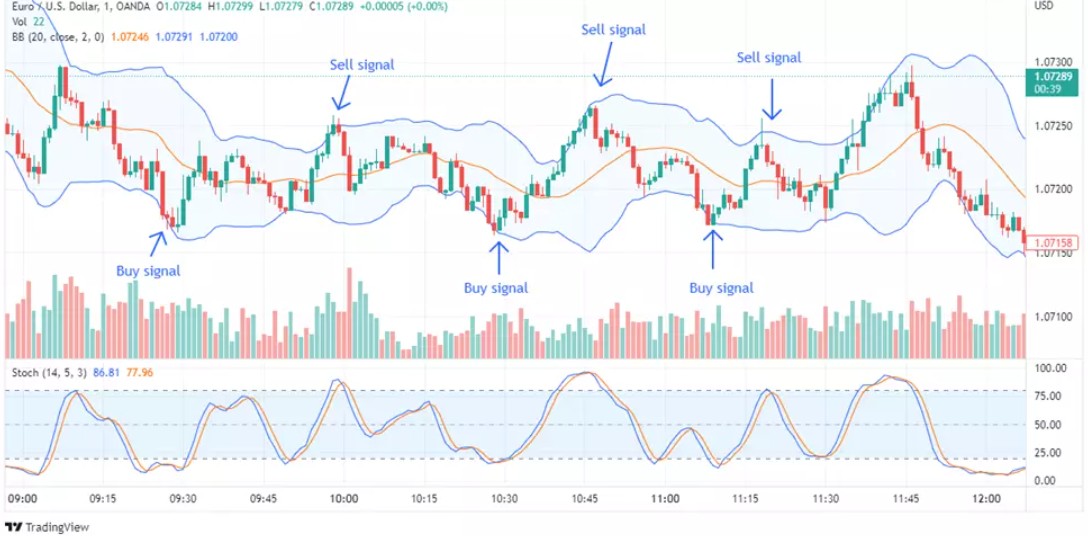
It is important to note that while the Stochastic oscillator gives reasonable insights into overbought and oversold conditions, using it alone may lead to false entry signals. So, experts suggest combining it with other confirmatory tools to take trades. Following is an example of using a Stochastic oscillator in confluence with bollinger bands.
How to use RSI to identify overbought and oversold conditions
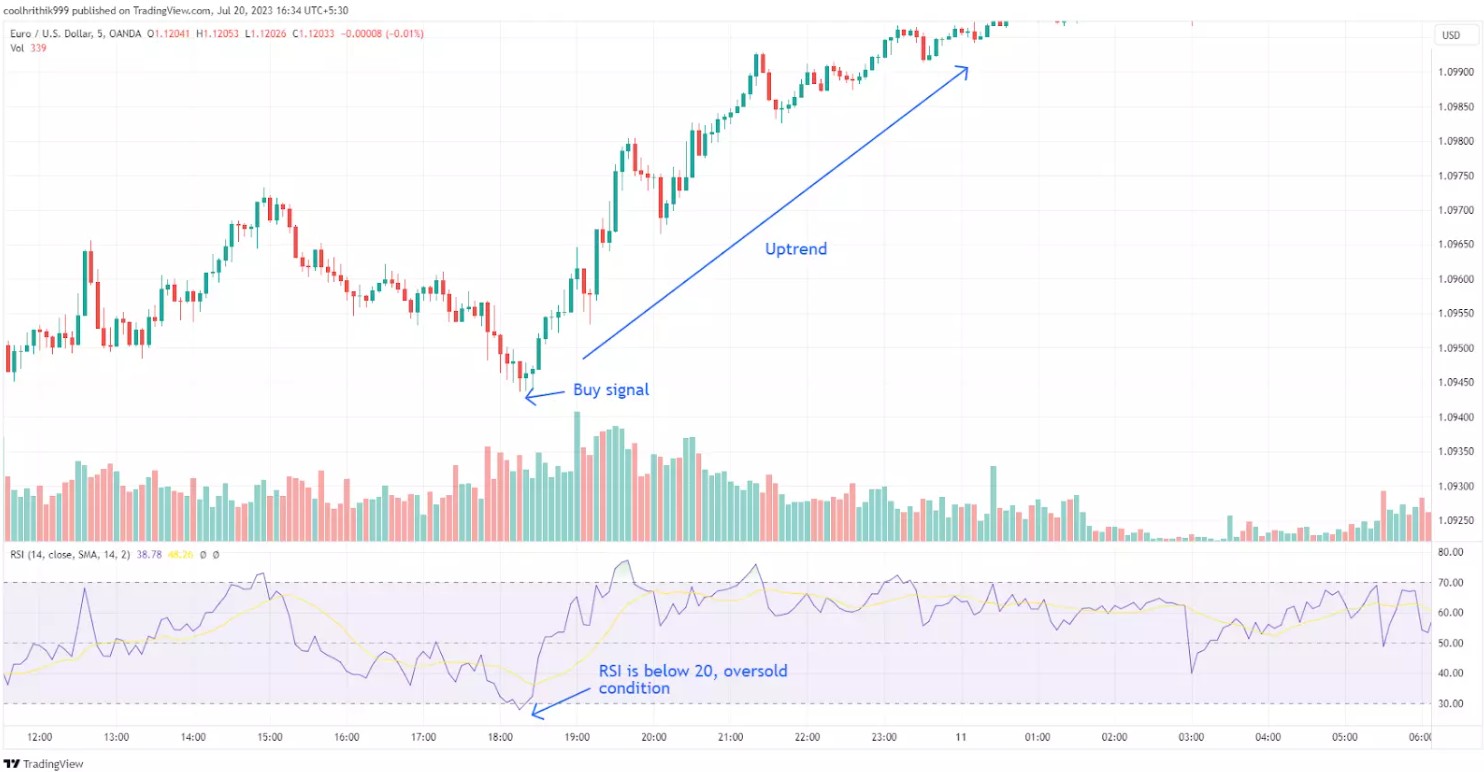
The Relative Strength Index (RSI) is a powerful momentum oscillator used to assess overbought and oversold conditions in trading assets. It compares the magnitude of recent gains to losses and presents its findings as a line graph oscillating between 0 and 100. Understanding how RSI divergence works and interpreting its signals correctly can significantly enhance trading strategies.
Overbought conditions
When the RSI approaches or surpasses the 70 mark, it indicates that the asset is overbought. This suggests that there has been an excessive buying pressure, potentially leading to a trend reversal or a slowdown in price movement. Traders may consider this a signal to sell or take profits.

Oversold conditions
When the RSI approaches or falls below the 30 mark, it signals that the asset is oversold. This implies an abundance of selling pressure, which could lead to a trend reversal or a slowdown in downward movement. Traders may see this as an opportunity to buy or take long positions.
Stochastic Oscillator vs RSI: when to use
When it comes to effectively using overbought and oversold indicators, understanding the differences between the Stochastic Oscillator and the RSI can be important as each indicator has unique characteristics that make them more suitable for specific market conditions.
Calculation method
The Stochastic Oscillator calculates its values based on the relationship between the closing price and the high-low range over a specified period. In contrast, the RSI assesses recent gains and losses to present its readings.
Range of values
Both oscillators have a scale ranging from 0 to 100, but their interpretations of overbought and oversold conditions differ. For the Stochastic Oscillator, readings above 80 indicate overbought conditions, while readings below 20 suggest oversold conditions. On the other hand, the RSI considers readings above 70 as overbought and readings below 30 as oversold.
Sensitivity to price movements
The Stochastic Oscillator is more responsive to short-term price movements, generating more frequent trading signals compared to the RSI, which tends to produce smoother signals and is better suited for assessing longer-term trends.
Signal generation
Both indicators are valuable for identifying overbought and oversold conditions. However, the RSI offers an additional benefit of detecting divergences, signaling potential trend reversals, and confirming signals from other indicators.
Market conditions
The Stochastic Oscillator excels in ranging or sideways markets, making it a favorable choice when traders seek to capitalize on short-term price fluctuations within established trading ranges. On the other hand, the RSI is often preferred in trending markets, as it helps traders spot potential reversals during broader price movements.
What are the best trading platforms for trading with MA?
The best option is the TradingView platform, which offers hundreds of classic and custom indicators, including many designed for trading with different MA strategies. We have compared several brokers that provide integration with this platform, allowing you to trade directly from TradingView, making the entire process more efficient and seamless.
| Regulation level | Demo | Min. deposit, $ | TradingView | MT4 | MT5 | Avg. EUR/USD Spread | Open an account | |
|---|---|---|---|---|---|---|---|---|
| Tier-1 | Yes | 100 | Yes | No | No | No | Open an account Your capital is at risk. |
|
| Tier-1 | Yes | No | Yes | Yes | Yes | 0,1 | Open an account Your capital is at risk.
|
|
| Tier-1 | Yes | No | Yes | Yes | Yes | 0,15 | Open an account Your capital is at risk. |
|
| Tier-1 | Yes | 100 | Yes | Yes | Yes | 0,2 | Study review | |
| Tier-1 | Yes | No | Yes | No | No | 0,2 | Open an account Your capital is at risk. |
How to trade overbought and oversold levels
To effectively trade overbought and oversold conditions, follow these steps to improve your trading strategy.
Initiate a live trading account or practice with a risk-free demo account
Before engaging in live trading, consider starting with a risk-free demo account to gain experience and confidence in using the indicators and trading strategies without exposing real capital.
Select a market for trading
Choose the financial market that aligns with your trading objectives and preferences, such as stocks, Forex, commodities, or cryptocurrencies, each with its unique characteristics and price behavior.
Utilize the RSI or Stochastic Oscillator to detect overbought and oversold conditions
Employ technical indicators like the Relative Strength Index (RSI) or Stochastic Oscillator and add indicators to MT4 to identify potential overbought and oversold levels in the market. The RSI compares recent gains and losses, while the Stochastic Oscillator analyzes the closing price's relationship with the high-low range, providing valuable insights into potential market reversals.
Determine whether to go long or short
Based on the identified overbought or oversold conditions, make a decision regarding your trading direction. If an asset is overbought, consider short-selling or closing long positions. Conversely, in oversold conditions, contemplate buying or opening long positions.
Combining multiple indicators for confirmation
Using multiple indicators together can enhance the accuracy of your trading strategy. For example:
Combine RSI with Bollinger Bands. Confirm overbought conditions when RSI exceeds 70 and the price crosses the upper Bollinger Band.
Pair MACD with Stochastic Oscillator. Use the MACD’s signal line crossover to validate Stochastic Oscillator signals for trend reversals.
This approach minimizes false signals and provides a broader view of market conditions.
Overlook with overbought and oversold indicators can mislead you in strong trends

One key point many beginners overlook with overbought and oversold indicators like RSI or Stochastic is that they can mislead you in strong trends. In a powerful uptrend, the market can stay in the overbought zone for a long time, giving you a false signal of a reversal. Similarly, in a strong downtrend, the market might stay oversold without bouncing back. The best way to avoid this mistake is to look for confirmation from other tools, like trend lines or moving averages. When you combine overbought/oversold indicators with trend-following tools, you can get a clearer picture of whether a reversal is likely or if the trend will keep pushing forward.
Another advanced tip is to keep an eye out for divergences between the price and the indicator. If price hits a new high (or low), but the overbought or oversold indicator doesn’t, it’s often a sign of weakening momentum and can indicate a reversal. However, not all divergences are the same. A sharp divergence with low volume can be a false signal, while one with increasing volume usually means the reversal is more likely. By paying attention to these signs, you can make smarter decisions and avoid jumping into trades that aren’t backed by strong momentum.
Conclusion
Overbought and oversold indicators are essential tools for traders seeking to identify potential reversal points. By understanding how to use these indicators and combining them for confirmation, traders can improve their strategies and make better decisions. However, it is important to consider their limitations and always complement them with sound risk management practices.
FAQs
What is the overbought indicator?
The overbought indicator refers to a technical condition in the financial markets where the price of an asset has risen significantly and is believed to be trading at a level higher than its intrinsic value. This condition often suggests that the asset is overvalued and may experience a price correction or pullback in the near future.
Is overbought a buy or sell?
When an asset is considered overbought, it is generally considered a signal to sell. This is because the overbought condition indicates that the price has reached an extreme level and is likely to reverse or pull back from its current high. Traders and investors often take this as an opportunity to sell their positions and potentially take profits before the price declines.
Is RSI overbought or oversold?
The Relative Strength Index (RSI) can indicate both overbought and oversold conditions. When the RSI reading is above 70, it is considered overbought, suggesting a potential upcoming price reversal or pullback. Conversely, when the RSI reading falls below 30, it is considered oversold, indicating that the asset's price may have declined too much and could potentially experience a price rebound.
What is the best indicator for RSI?
The RSI is already a standalone indicator that measures the momentum and strength of an asset's price movements. However, some traders may use additional technical indicators in conjunction with the RSI to enhance their analysis. Common complementary indicators include moving averages, Bollinger Bands, or MACD, which can provide further insights and confirmation for potential entry and exit points based on the RSI signals. The choice of the best indicator depends on individual trading strategies and preferences.
Related Articles
Team that worked on the article
Parshwa is a content expert and finance professional possessing deep knowledge of stock and options trading, technical and fundamental analysis, and equity research. As a Chartered Accountant Finalist, Parshwa also has expertise in Forex, crypto trading, and personal taxation. His experience is showcased by a prolific body of over 100 articles on Forex, crypto, equity, and personal finance, alongside personalized advisory roles in tax consultation.
Chinmay Soni is a financial analyst with more than 5 years of experience in working with stocks, Forex, derivatives, and other assets. As a founder of a boutique research firm and an active researcher, he covers various industries and fields, providing insights backed by statistical data. He is also an educator in the field of finance and technology.
As an author for Traders Union, he contributes his deep analytical insights on various topics, taking into account various aspects.
Mirjan Hipolito is a journalist and news editor at Traders Union. She is an expert crypto writer with five years of experience in the financial markets. Her specialties are daily market news, price predictions, and Initial Coin Offerings (ICO).
Cryptocurrency is a type of digital or virtual currency that relies on cryptography for security. Unlike traditional currencies issued by governments (fiat currencies), cryptocurrencies operate on decentralized networks, typically based on blockchain technology.
Risk management in Forex involves strategies and techniques used by traders to minimize potential losses while trading currencies, such as setting stop-loss orders and position sizing, to protect their capital from adverse market movements.
An investor is an individual, who invests money in an asset with the expectation that its value would appreciate in the future. The asset can be anything, including a bond, debenture, mutual fund, equity, gold, silver, exchange-traded funds (ETFs), and real-estate property.
Forex indicators are tools used by traders to analyze market data, often based on technical and/or fundamental factors, to make informed trading decisions.
Fundamental analysis is a method or tool that investors use that seeks to determine the intrinsic value of a security by examining economic and financial factors. It considers macroeconomic factors such as the state of the economy and industry conditions.


-
 Afghanistan
-
 Albania
-
 Algeria
-
 Argentina
-
 Armenia
-
 Australia
-
 Austria
-
 Azerbaijan
-
 Bahamas
-
 Bahrain
-
 Bangladesh
-
 Belgium
-
 Botswana
-
 Brazil
-
 Brunei
-
 Bulgaria
-
 Cambodia
-
 Cameroon
-
 Canada
-
 Chile
Chile
-
 China
China
-
 Colombia
-
 Costa Rica
-
 Cote d'Ivoire
-
 Croatia
-
 Cyprus
-
 Czechia
-
 Denmark
-
 Dominican Republic
-
 Ecuador
-
 Egypt
Egypt
-
 Estonia
-
 Eswatini
-
 Ethiopia
-
 Finland
-
 France
-
 Georgia
-
 Germany
-
 Ghana
Ghana
-
 Greece
-
 Haiti
Haiti
-
 Hong Kong
-
 Hungary
-
 India
India
-
 Indonesia
-
 Iran, Islamic republic
-
 Iraq
Iraq
-
 Ireland
-
 Israel
-
 Italy
Italy
-
 Jamaica
-
 Japan
Japan
-
 Jordan
-
 Kazakhstan
-
 Kenya
Kenya
-
 Korea
Korea
-
 Kuwait
-
 Kyrgyzstan
-
 Laos
Laos
-
 Latvia
-
 Lebanon
-
 Libya
Libya
-
 Lithuania
-
 Luxembourg
-
 Madagascar
-
 Malaysia
-
 Malta
Malta
-
 Mauritius
-
 Mexico
-
 Moldova
-
 Mongolia
-
 Montenegro
-
 Morocco
-
 Mozambique
-
 Myanmar
-
 Namibia
-
 Nepal
Nepal
-
 Netherlands
-
 Nigeria
-
 North Macedonia
-
 Norway
-
 Oman
Oman
-
 Pakistan
-
 Palestine
-
 Papua New Guinea
-
 Peru
Peru
-
 Philippines
-
 Poland
-
 Portugal
-
 Puerto Rico
-
 Qatar
Qatar
-
 Romania
-
 Rwanda
-
 Saudi Arabia
-
 Serbia
-
 Singapore
-
 Slovakia
-
 Slovenia
-
 Somalia
-
 South Africa
-
 Spain
Spain
-
 Sri Lanka
-
 Sweden
-
 Switzerland
-
 Syria
Syria
-
 Taiwan
-
 Tajikistan
-
 Tanzania
-
 Thailand
-
 Trinidad and Tobago
-
 Tunisia
-
 Turkey
-
 UAE
UAE
-
 Uganda
-
 Ukraine
-
 United Kingdom
-
United States
-
 Uzbekistan
-
 Venezuela
-
 Vietnam
-
 Yemen
Yemen
-
 Zambia
-
 Zimbabwe
- Forex
- Crypto
