Bullish And Bearish RSI Divergence


Editorial Note: While we adhere to strict Editorial Integrity, this post may contain references to products from our partners. Here's an explanation for How We Make Money. None of the data and information on this webpage constitutes investment advice according to our Disclaimer.
Bullish and bearish RSI divergence occurs when the RSI indicator and price move in opposite directions:
Bullish divergence. Price forms lower lows, but RSI forms higher lows, signaling potential upward reversal.
Bearish divergence. Price forms higher highs, but RSI forms lower highs, indicating possible downward reversal.
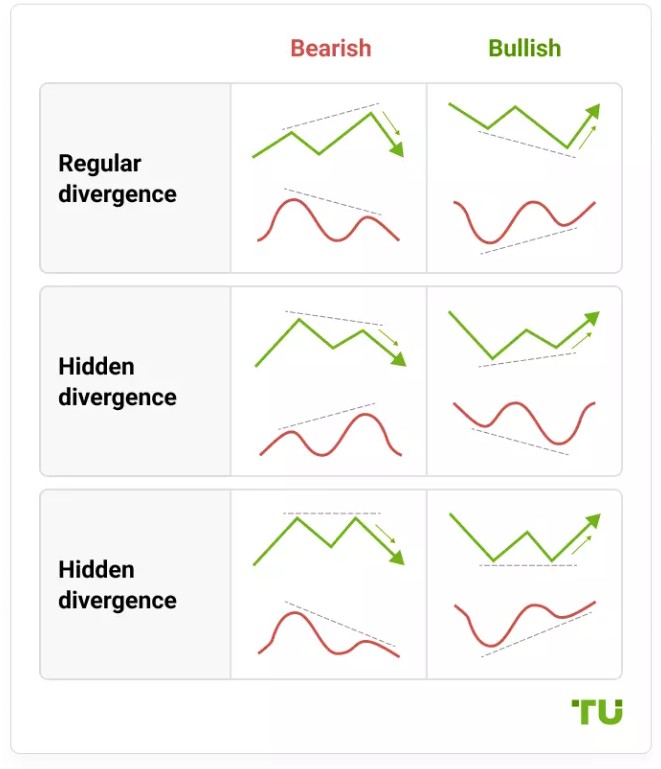
Divergence is widely regarded as one of the most reliable signals generated by oscillators. Regular divergence typically signals an upcoming reversal in price direction, while hidden divergence points to the continuation of an existing trend. However, many new traders find it challenging to spot these signals effectively, despite their strength.
In this guide, we’ll explore key questions to help you master the concept of divergence:
What exactly is divergence, and what are its main types?
How can you draw reference lines and accurately interpret their signals?
How can divergence be integrated into a trading strategy, particularly using the RSI oscillator?
If you’re new to trading, this review is designed to break down these concepts in a clear and actionable way, helping you better understand and apply divergence in your strategies.
Bullish and bearish RSI divergence
A divergence occurs when the price moves in the opposite direction of the indicator. This happens, when the leading indicator “sees” an imminent price reversal, while the price moves in the “old” direction by inertia. This is possible thanks to the formula of leading indicators that compare the current candles with candles of earlier periods, filtering the intermediate sections. Therefore, divergence is usually sought on higher timeframes and on long sections.
General rules for drawing a divergence:
The lines indicating a divergence are drawn exclusively on extremes. If there is a divergence, but the indicator is moving up/down without clear extremes, the signal is considered weak. The sharper the extreme, the better.
It is desirable for the first extreme of the indicator to be in the overbought/oversold zone.
It is desirable for the angle of convergence/divergence between the price and the oscillator to be as big as possible.
The reference lines are drawn on the extremes of the candle body, not the extremes of shadows.
Oscillators are used to search for divergences. They are considered to be leading indicators, because they signal about possible price movement direction and its change earlier. Also, they are drawn under the price chart, which is convenient from the visual standpoint.
The best indicators for divergence include RSI, Stochastic, CCI and MACD. A combination of two oscillators can be used to confirm the signal, for example RSI and Stochastic – they are similar in essence, but differ by the calculation formula. In the following examples, we review divergence using the RSI indicator.
There are several types of divergences:
Class A are clear divergences/convergences. They are quickly found on the chart visually and are considered as reliable signals. These include bullish and bearish divergences.
Class B are weak divergences/convergences, with extremes of the indicator on different levels, and price extremes practically on one level.
Class C are weak divergences/convergences, with extremes of the indicator practically on the same level and price extreme on different levels.
Bullish and bearish divergences
Bullish divergence is called convergence, and bearish – divergence.
Rules for drawing:
Bullish divergence is drawn on the price and RSI lows. The price lows are moving down, and the RSI lows are moving up.
Bearish divergence is drawn on the price and RSI highs. The price highs are moving up, and the RSI highs are moving down.
Example 1.
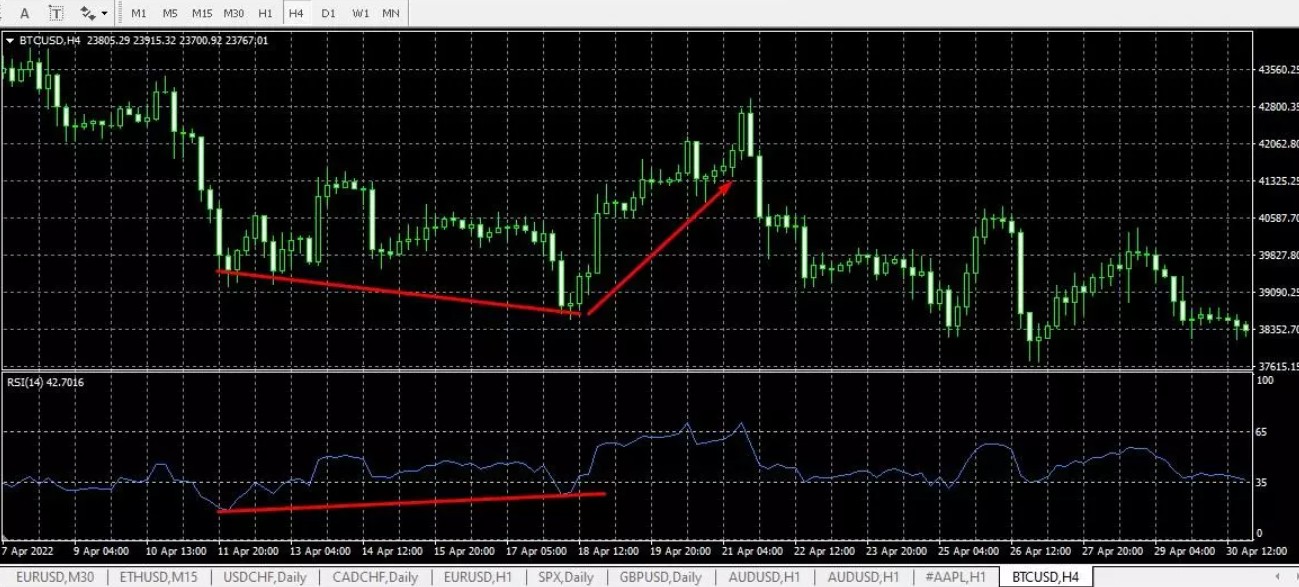
Example of strong bullish divergence of Class A. A convergence is visible on the BTC/USD chart on the timeframe H4. The price lows are decreasing, RSI (14) lows are growing. A strengthening signal is the first RSI low near the level of 20, i.e. in the oversold zone. The fact that the oscillator bounces off this level speaks about the growing buyers’ power.
Example 2.
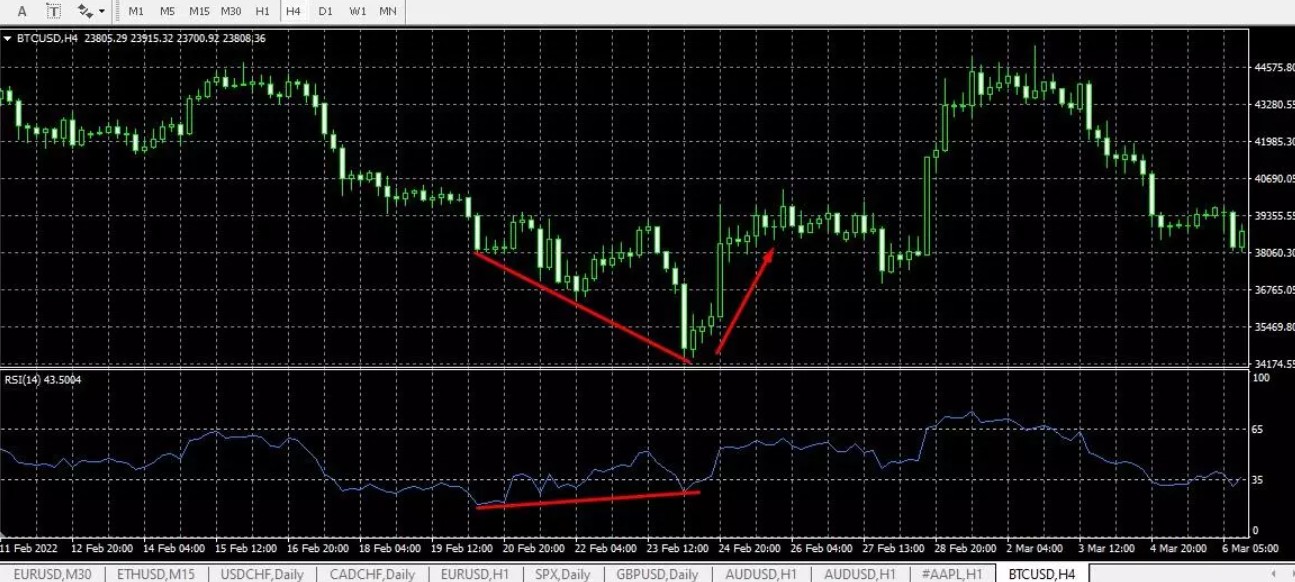
Here, the signal is even stronger. RSI bounces of the level 30, which can also be considered the edge of the oversold zone, the downward reference line of the price is drawn on the three extremes, the last falling candle has an abnormally long body (the last impulse of bears), the reference lines of the price and indicator have a big angle of convergence.
Example 3.
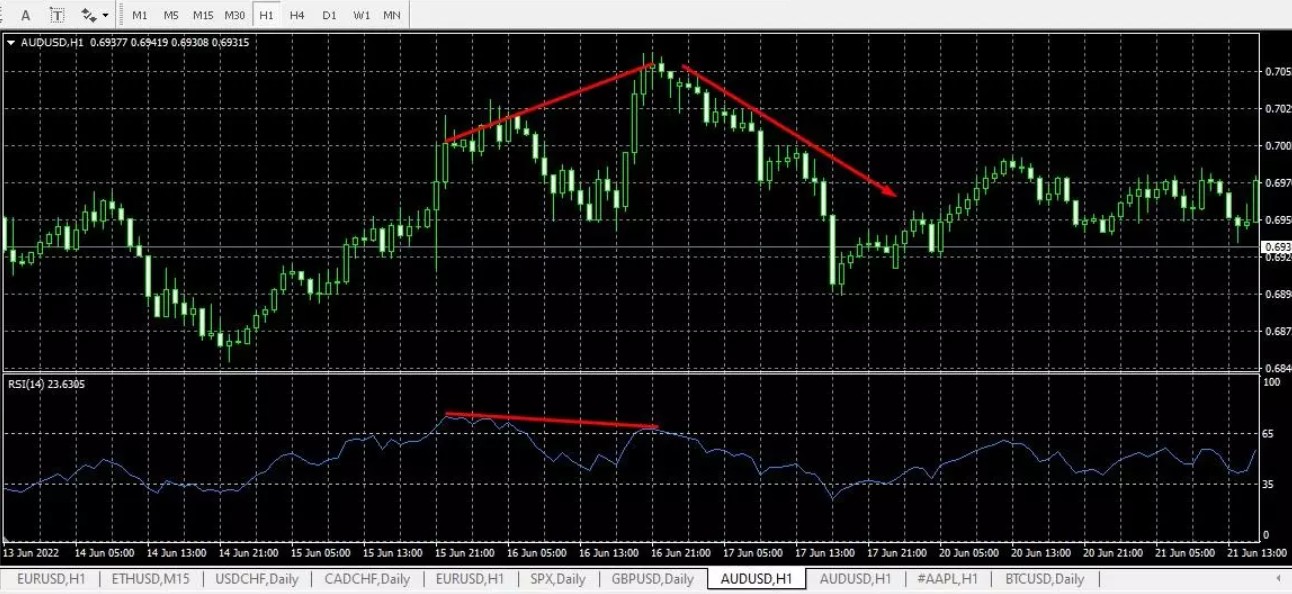
Example of bearish divergence of Class A. The RSI highs are moving downward, but the price highs are moving up at a big angle.
Hidden divergence of RSI
Unlike regular divergence that predicts price reversal, hidden diversion confirms the existing trend:
Hidden bullish diversion is drawn on the price and RSI lows. Price lows are moving up and RSI lows are moving down.
Hidden bearish divergence is drawn on the price and RSI highs. Price highs are moving down and RSI highs are moving up.
There is also an extended RSI divergence. It is similar to the regular one, but provides for a more complex design of extremes and is often mistaken for Class B divergence. Since hidden and extended divergences are rare and difficult to visually identify, novice traders should not try to look for them.
Classic mistakes in searching for RSI divergence
1. Ignoring fundamental factors. Divergence is a technical instrument, the logic of appearance of which can be broken at any moment by a fundamental factor. Regardless of how clear the prediction of price divergence may seem, the price can reverse in the opposite direction at any time.
Tip. If you see a divergence forming, check the economic calendar. If there are key events around (publication of statistics, reports, etc.) that concern your asset, do not rush to react to the signal.
2. Early reaction to divergence. “Wishful thinking”. RSI divergence has clear signs: clear price and indicator extremes located relatively far from each other. You need to learn to see visually. Divergence is often mistaken for increased price volatility.
Tip. Don’t rush to open a position on a signal. If you see a divergence, wait for the signal confirming price reversal, for example, a reversal pattern, price movement away from the trend line or strong support/resistance level.
3. Mistake in combining sections. If you are looking for divergence, the extremes must be within one range. You cannot take RSI extremes on the section from July 29 until September 1, and price extremes – from July 29 until August 15. The example of the mistake is shown below:
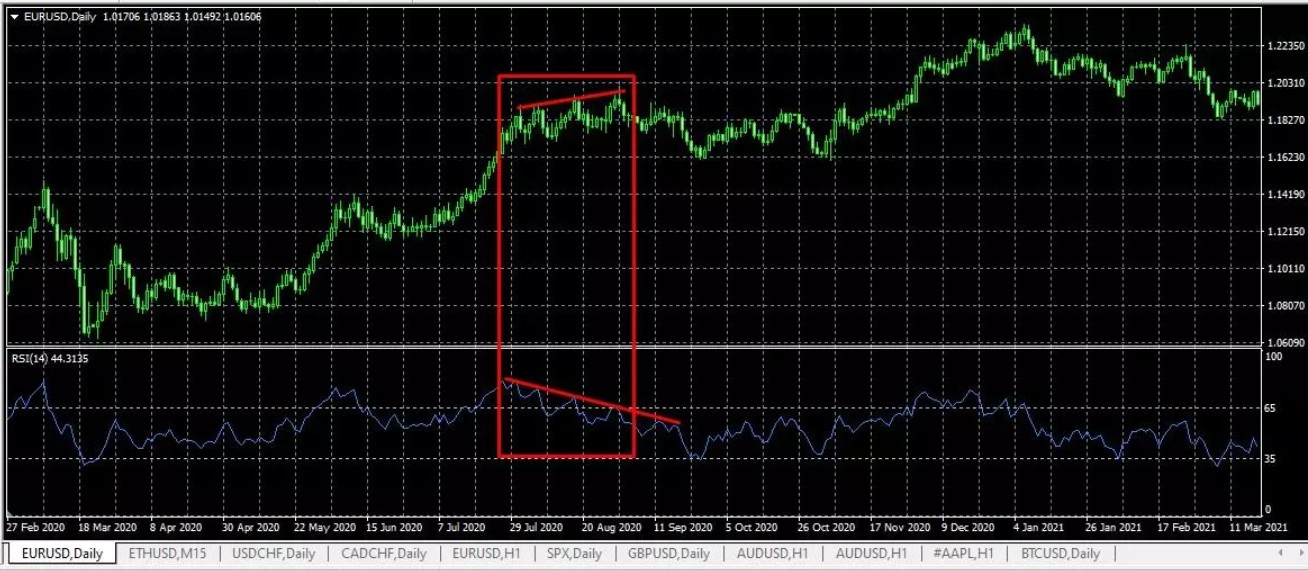
A seemingly strong diversion is an illusion, because if you take the extremes on one section, a diversion of Class B with violation of the mandatory rule of consecutive upward highs. The signal is very weak.
Tip. Look for simultaneous indicator signals in the same section, use additional filters. Don’t try to see something that isn't really there.
4. Not using sophisticated tools. Many traders do not get access to the right tools through their brokers. Getting around this issue is simple; just trade with a good broker. The best brokers offer reliable platforms, competitive spreads, and advanced tools for technical analysis, ensuring traders can efficiently identify and act on divergence signals. Below, we’ve highlighted the top brokers that can help you implement the divergence strategy effectively.
| Min. deposit, $ | Max. leverage | Min Spread EUR/USD, pips | Max Spread EUR/USD, pips | Negative balance protection | Investor protection | Regulation level | Open an account | |
|---|---|---|---|---|---|---|---|---|
| 100 | 1:300 | 0,5 | 0,9 | Yes | €20,000 £85,000 SGD 75,000 | Tier-1 | Open an account Your capital is at risk. |
|
| No | 1:500 | 0,5 | 1,5 | Yes | £85,000 €20,000 €100,000 (DE) | Tier-1 | Open an account Your capital is at risk.
|
|
| No | 1:200 | 0,1 | 0,5 | Yes | £85,000 SGD 75,000 $500,000 | Tier-1 | Open an account Your capital is at risk. |
|
| 100 | 1:50 | 0,7 | 1,2 | Yes | £85,000 | Tier-1 | Study review | |
| No | 1:30 | 0,2 | 0,8 | Yes | $500,000 £85,000 | Tier-1 | Open an account Your capital is at risk. |
How to learn divergence strategy?
You can learn to see divergence, but it generally comes with experience. In order to learn to see divergence, install a line price chart – the lines are better perceived visually. And zoom out.
Custom indicators are another way to look for divergence. It could be either a combined indicator or an add-on. DivergenceViewer_AD is an example of an add-on for MT4. It is added to the platform as a regular indicator. In the settings, the type of the basic instrument is specified (RSI, CCI, Momentum, Stochastic, etc.), which will be used to determine divergences. Also the maximum duration of a divergence is specified.
Examples of combined indicators for searching for divergences: DTosc 2.06 Multi RSI, MFI+RSI Divergence TT, Adaptable_RSI + smoothing + divergence 2.
Example of a trading strategy with RSI divergence
In the trading strategies we are using as an example, Stochastic, which is also used for searching for overbought and oversold zones, is used as an additional filter. Currency pair – EUR/USD, timeframe – H4. On this timeframe, a late entry is allowed, confirmed by several signals. 4-5 candles are enough for profit.
We analyze the chart and look for a divergence.
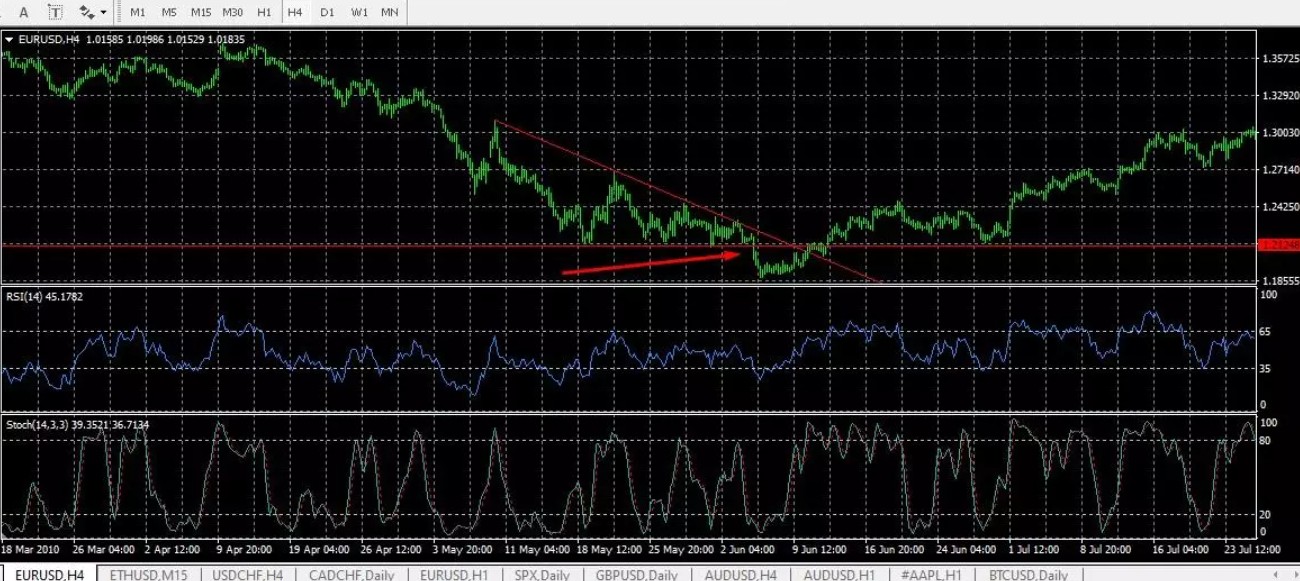
The chart shows a long-term downward trend, which should end sooner or later. The task is to determine the reversal point. Oscillators are used only as confirming instruments.
A strong pattern – Triangle is formed on the chart. It is formed by the horizontal support level, built on three points and the trend line built on four points. There are two ways this figure could continue:
Breakout of the support level down – continuation of a strong downward trend.
Breakout of the trend line up – a new upward trend.
In this case, we see the breakout down.
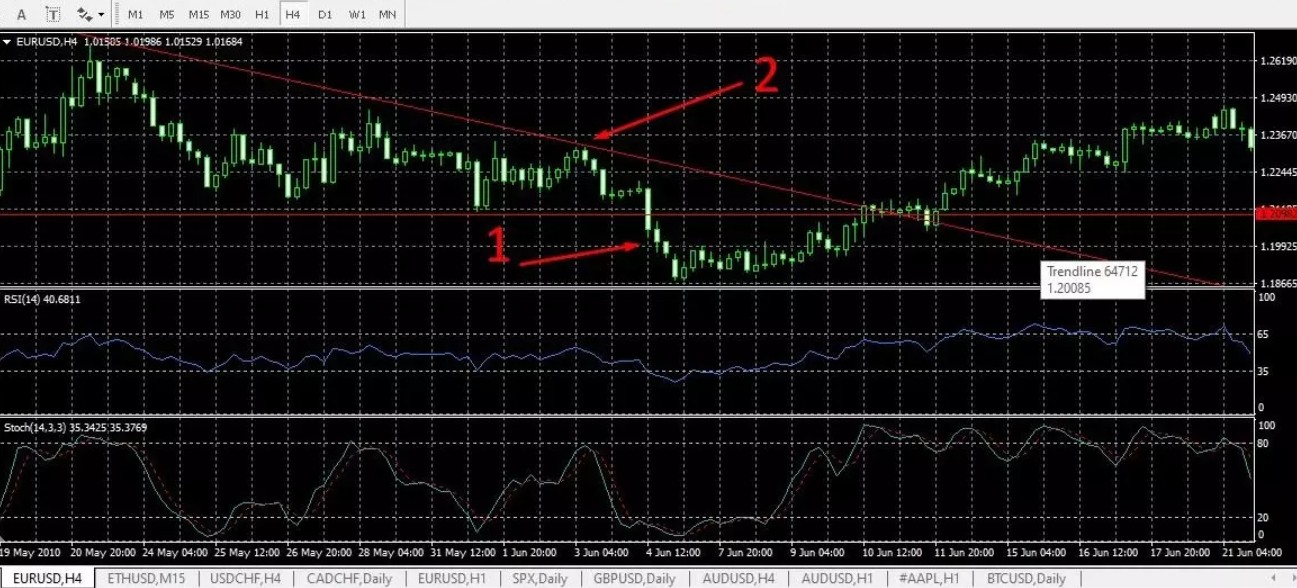
We now look for the signal confirming downward movement, and zoom in.
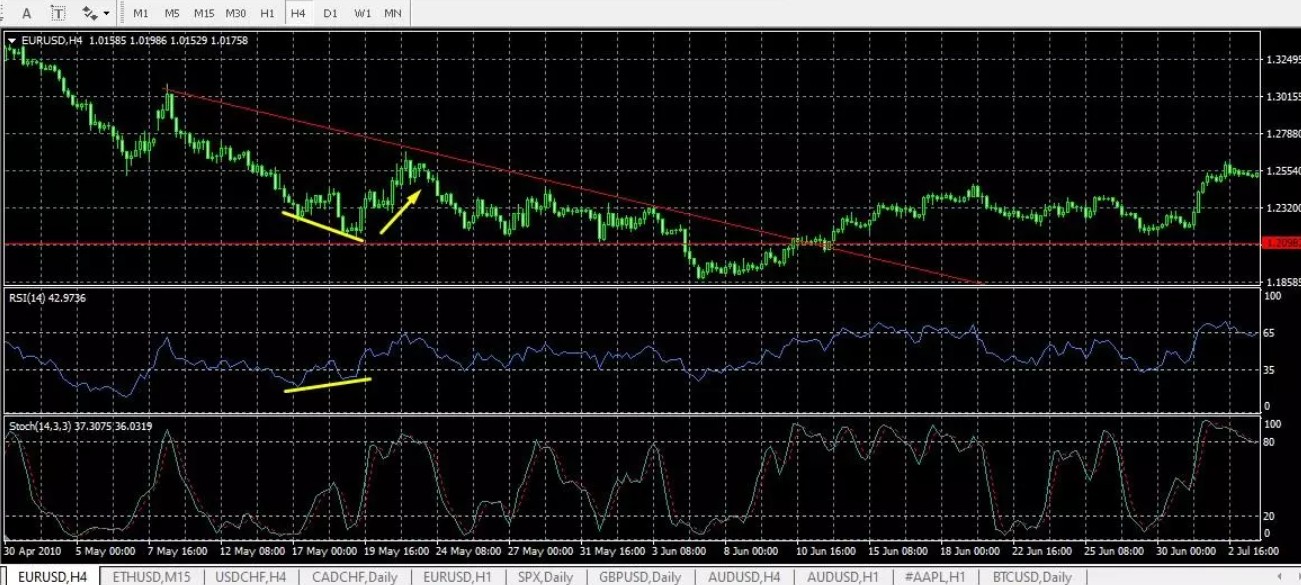
This intermediate screenshot shows a small bullish divergence on a zoomed-in chart. It could be used for a short-term strategy. However, our task is to find a strong long-term signal.
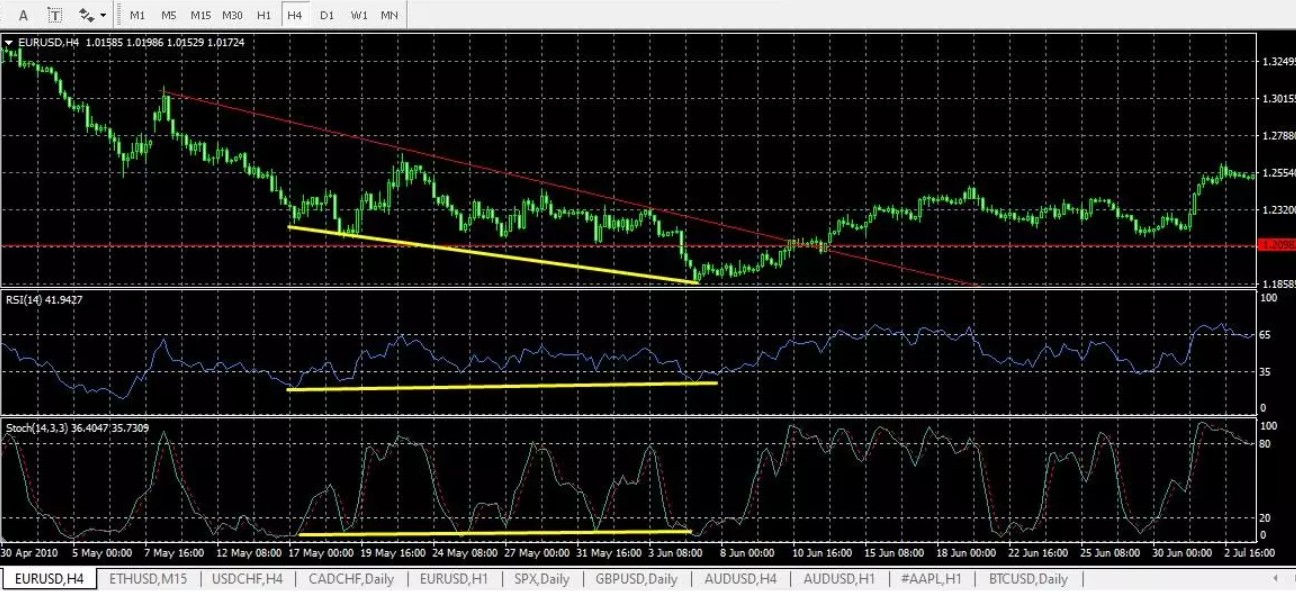
The chart shows an upward RSI movement, insignificant movement of Stochastic and downward price movement. A sign of divergence is seen, but breakout of the Triangle pattern down is the main signal. We open a short position on the next candle after the breakout at point 1 with a stop on the local high (point 2 on the screenshot below).
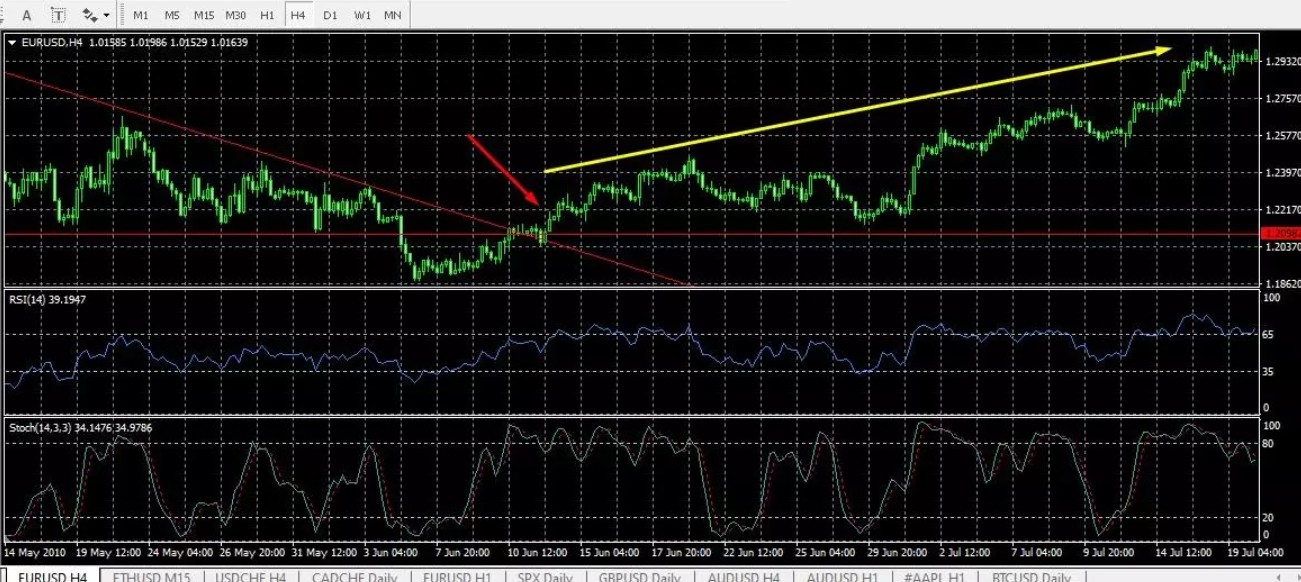
Further development of the situation shows that this trade could have turned out to be unprofitable. The next strong signal is the breakout of the triangle upward. At this point (the red arrow on the screenshot below), we reverse the position towards the upward movement.
Conclusion on this strategy:
Always focus only on main signals. If they strongly contradict the additional signals, make a decision: to risk or not. In this case, the pattern and trend lines are the main signals.
RSI and Stochastic are confirming and signaling instruments. Stochastic showed a weak rise, but it can still be called a confirming signal.
The signals are not always correct. Triangle breakout down turned out to be false. Divergence turned out to be a stronger signal.
Movement of oscillators in the overbought and oversold zones is ignored in long-term strategies.
Also, this example shows that pure RSI divergence is rare. However, even insignificant, visible change of the oscillator extremes with price extremes can give a signal.
Combine RSI divergence with Fibonacci and breakouts for precise trades

Bullish and bearish RSI divergence can change the way you trade when you dig deeper than just seeing it on the chart. Double-check it with a trendline break or volume surge. For example, if you see bullish divergence (higher lows on RSI while the price makes lower lows), wait for the price to break above resistance before entering. This keeps you from falling for false signals, especially in messy markets.
Another smart trick is to spot divergence near important Fibonacci levels like 61.8% or 78.6%. These often match with big price reversals. For bearish divergence, see if the price is struggling near a key Fibonacci resistance while RSI makes lower highs. This makes your trade setup stronger and gives you a better chance to catch a big move. Always check divergence on different timeframes to stay accurate and avoid early trades.
Conclusion
Divergence, especially with RSI, is a valuable tool for spotting potential reversals and continuing trends. When combined with other indicators and thorough market analysis, it can become even more reliable. Beginners should focus on practicing with straightforward examples, while experienced traders can enhance their strategies using tailored tools. Understanding divergence enables traders to make well-informed decisions and capitalize on market opportunities.
FAQs
Is divergence a strong signal?
Divergence is a highly reliable signal when identified correctly, with proper attention to indicator extremes and the angle of their inclination. However, external factors like market news can influence price movements, either confirming or invalidating the signal.
Why is it best to use RSI for searching for divergences?
RSI is one of the most precise indicators, designed to identify trend reversal zones effectively. Its simplicity and accuracy make it a top choice, alongside alternatives like Stochastic and MACD.
How do I use RSI divergence in trading strategies?
When RSI indicates divergence or convergence with price, it often signals a potential reversal. Confirmation comes from patterns or trend indicators, helping traders spot new trends early.
What are the instruments for searching for a divergence?
Instruments for searching for divergence include visual analysis, where traders manually identify divergence on H1 timeframes for better clarity. Custom indicators can also be used, offering automated detection of divergence but sometimes providing false signals. Additionally, comprehensive trading platforms with built-in divergence detection features, often available through subscriptions, can streamline the process.
Related Articles
Team that worked on the article
Igor is an experienced finance professional with expertise across various domains, including banking, financial analysis, trading, marketing, and business development. Over the course of his career spanning more than 18 years, he has acquired a diverse skill set that encompasses a wide range of responsibilities. As an author at Traders Union, he leverages his extensive knowledge and experience to create valuable content for the trading community.
Chinmay Soni is a financial analyst with more than 5 years of experience in working with stocks, Forex, derivatives, and other assets. As a founder of a boutique research firm and an active researcher, he covers various industries and fields, providing insights backed by statistical data. He is also an educator in the field of finance and technology.
As an author for Traders Union, he contributes his deep analytical insights on various topics, taking into account various aspects.
Mirjan Hipolito is a journalist and news editor at Traders Union. She is an expert crypto writer with five years of experience in the financial markets. Her specialties are daily market news, price predictions, and Initial Coin Offerings (ICO).
Volatility refers to the degree of variation or fluctuation in the price or value of a financial asset, such as stocks, bonds, or cryptocurrencies, over a period of time. Higher volatility indicates that an asset's price is experiencing more significant and rapid price swings, while lower volatility suggests relatively stable and gradual price movements.
An investor is an individual, who invests money in an asset with the expectation that its value would appreciate in the future. The asset can be anything, including a bond, debenture, mutual fund, equity, gold, silver, exchange-traded funds (ETFs), and real-estate property.
Uptrend is a market condition in which prices are generally rising. Uptrends can be identified by using moving averages, trendlines, and support and resistance levels.
Forex leverage is a tool enabling traders to control larger positions with a relatively small amount of capital, amplifying potential profits and losses based on the chosen leverage ratio.
Swing trading is a trading strategy that involves holding positions in financial assets, such as stocks or forex, for several days to weeks, aiming to profit from short- to medium-term price swings or "swings" in the market. Swing traders typically use technical and fundamental analysis to identify potential entry and exit points.


-
 Afghanistan
-
 Albania
-
 Algeria
-
 Argentina
-
 Armenia
-
 Australia
-
 Austria
-
 Azerbaijan
-
 Bahamas
-
 Bahrain
-
 Bangladesh
-
 Belgium
-
 Botswana
-
 Brazil
-
 Brunei
-
 Bulgaria
-
 Burma
Burma
-
 Cambodia
-
 Cameroon
-
 Canada
-
 Chile
Chile
-
 China
China
-
 Colombia
-
 Costa Rica
-
 Cote d'Ivoire
-
 Croatia
-
 Cyprus
-
 Czech Republic
-
 Denmark
-
 Dominican Republic
-
 Ecuador
-
 Egypt
Egypt
-
 Estonia
-
 Eswatini
-
 Ethiopia
-
 Finland
-
 France
-
 Georgia
-
 Germany
-
 Ghana
Ghana
-
 Greece
-
 Haiti
Haiti
-
 Hong Kong
-
 Hungary
-
 India
India
-
 Indonesia
-
 Iran, Islamic republic
-
 Iraq
Iraq
-
 Ireland
-
 Israel
-
 Italy
Italy
-
 Jamaica
-
 Japan
Japan
-
 Jordan
-
 Kazakhstan
-
 Kenya
Kenya
-
 Korea
Korea
-
 Kuwait
-
 Kyrgyzstan
-
 Laos
Laos
-
 Latvia
-
 Lebanon
-
 Libyan Arab Jamahiriya
-
 Lithuania
-
 Luxembourg
-
 Macedonia
-
 Madagascar
-
 Malaysia
-
 Malta
Malta
-
 Mauritius
-
 Mexico
-
 Moldova
-
 Mongolia
-
 Montenegro
-
 Morocco
-
 Mozambique
-
 Namibia
-
 Nepal
Nepal
-
 Netherlands
-
 Nigeria
-
 Norway
-
 Oman
Oman
-
 Pakistan
-
 Palestine
-
 Papua New Guinea
-
 Peru
Peru
-
 Philippines
-
 Poland
-
 Portugal
-
 Puerto Rico
-
 Qatar
Qatar
-
 Romania
-
 Rwanda
-
 Saudi Arabia
-
 Serbia
-
 Singapore
-
 Slovakia
-
 Slovenia
-
 Somalia
-
 South Africa
-
 Spain
Spain
-
 Sri Lanka
-
 Sweden
-
 Switzerland
-
 Syrian Arab Republic
-
 Taiwan
-
 Tajikistan
-
 Tanzania, United Republic Of
-
 Thailand
-
 Trinidad and Tobago
-
 Tunisia
-
 Turkey
-
 UAE
UAE
-
 Uganda
-
 Ukraine
-
 United Kingdom
-
United States
-
 Uzbekistan
-
 Venezuela
-
 Vietnam
-
 Yemen
Yemen
-
 Zambia
-
 Zimbabwe
- Forex
- Crypto
