How To Use Donchian Channels To Spot Real Breakouts


Editorial Note: While we adhere to strict Editorial Integrity, this post may contain references to products from our partners. Here's an explanation for How We Make Money. None of the data and information on this webpage constitutes investment advice according to our Disclaimer.
Donchian Channels track the highest and lowest price levels over a chosen period to visualize where real pressure is building. Rather than chasing breakout candles, smart traders use these channels to spot when price hovers near the edges — indicating momentum is growing. Donchian is best used to measure breakout potential and confirm price strength, not just signal entries.
Donchian Channels are not for chasing breakout candles. They are for figuring out what really matters as a breakout. When charts get messy, this tool helps by tracking where price has stretched the most over a given period. But the real trick is not waiting for price to hit the edge — it is watching how long it stays near it. If price keeps pressing against the upper band without pulling back, that shows energy is building. In this article, we will take a detailed look into the Donchian indicator, talking about its origin, calculation, and key trading strategies.
Introduction to Donchian channels
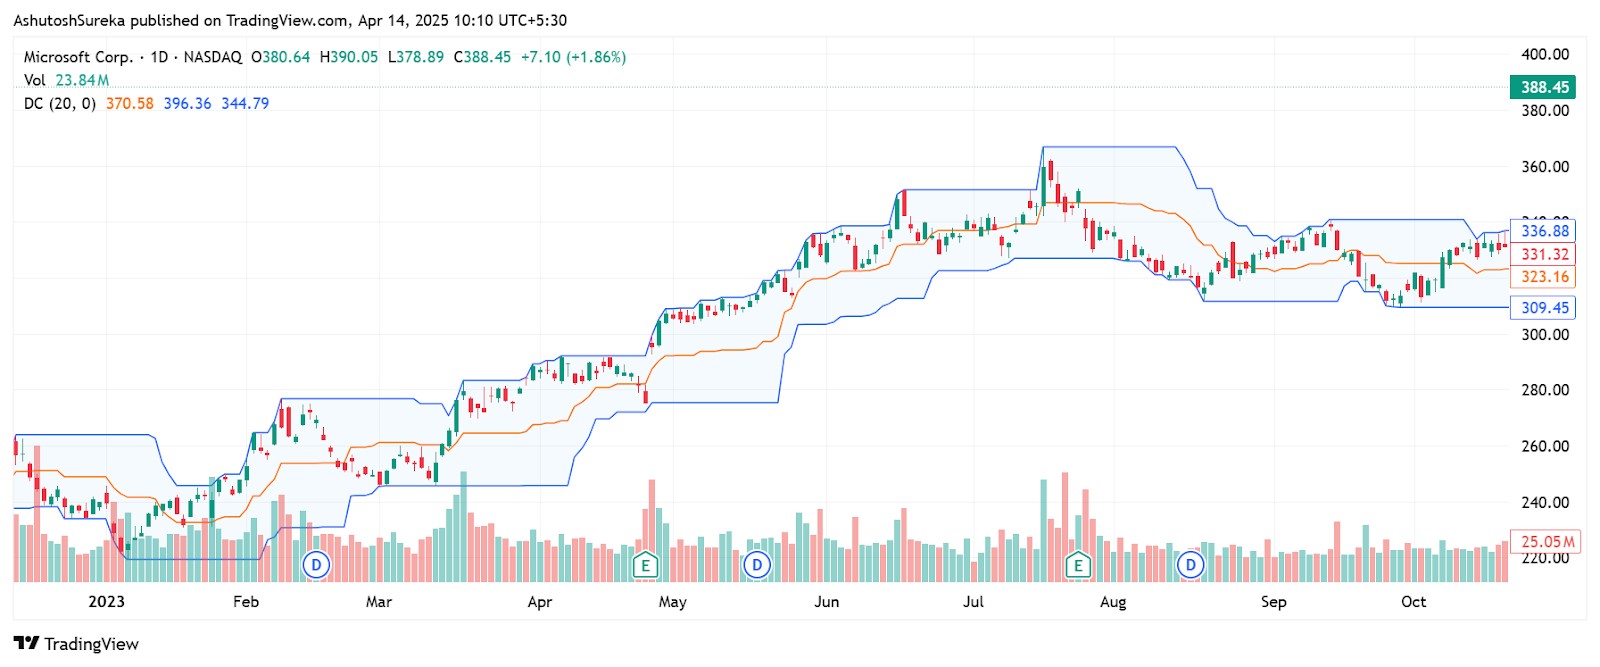
Donchian channels are a trend-following indicator that shows the highest high and the lowest low over a set period, forming an upper and lower boundary around price. This creates a visual channel on the chart that expands or contracts based on volatility. When price breaks above or below the channel, it often signals a shift in market sentiment.
Traders use Donchian channels to spot breakouts, confirm trends, and set stop-loss or entry levels. The indicator works well in trending markets and helps avoid noise in sideways price action. Its simplicity makes it a favorite among traders who prefer clean, rule-based setups.
What Donchian channels show
The upper band marks the highest price over the selected period.
The lower band marks the lowest price during the same period.
The channel width expands in volatile markets and contracts during calm periods.
Breakouts above or below the bands often suggest strong market movement.
Origin and development of Donchian channels
Donchian channels were developed by Richard Donchian, often called the father of trend following. A pioneer in systematic trading, he created these channels in the mid-20th century to bring structure to breakout strategies.
Why they were developed
Donchian wanted a simple tool to define trend direction and trade entries.
He created the channels as part of a rule-based strategy focused on breakouts from recent highs or lows.
His approach laid the groundwork for many modern trend-following systems.
How they became popular
Richard Donchian’s 4-week rule became widely used among futures traders.
His work influenced traders like the Turtle Traders, who used channel breakouts to enter trades.
The indicator became a go-to tool for spotting volatility and timing trend-based trades.
Why they’re still used today
Clear breakout signals with minimal clutter.
Adaptable across timeframes and markets.
Works well in combination with momentum or volume indicators.
Understanding the components of Donchian channels
Donchian channels are made up of just three key components, but together they help traders identify trend direction, breakouts, and volatility shifts. The indicator draws a simple channel that wraps around the price, adjusting automatically based on recent highs and lows over a chosen period.
The three main components
Upper band
This line marks the highest high over a defined period — commonly 20 periods.
It acts as dynamic resistance during an uptrend.
When price breaks above this line, it may signal the start of bullish momentum.
Lower band
This line shows the lowest low over the same number of periods.
It works as dynamic support in a downtrend.
A break below it may indicate rising selling pressure or trend reversal.
Middle line (optional)
This line is the average of the upper and lower bands.
Some platforms include it, others do not.
It can help traders see the median price and midpoint of the range.
How the channel behaves
The wider the channel, the more volatile the market.
A narrow channel means low volatility and potential for an upcoming breakout.
Channel breakouts are often used as entry signals in trend-following strategies.
Understanding the Donchian channels formula
The Donchian channels formula is straightforward and easy to understand. It calculates the highest and lowest prices over a specific period and draws two lines around the price to form a channel. This helps traders see recent price extremes and prepare for breakouts or reversals.
The basic formula
Donchian channels use just three values. The default lookback period is usually 20 candles, but you can change it based on your trading style.
Upper band = Highest high over N periods
Lower band = Lowest low over N periods
Middle line (optional) = (Upper band + Lower band) ÷ 2
These values are recalculated with each new candle, which means the channel adjusts automatically as price changes.
What the formula tells you
If the upper band is rising, recent highs are getting higher — this suggests bullish pressure.
If the lower band is falling, recent lows are dropping — this signals bearish pressure.
A narrow range between the bands shows price is consolidating and may break out soon.
A wide range suggests strong volatility or a trending move.
How to set up Donchian channels
Donchian channels are available on most trading platforms and are easy to apply. Once added to the chart, the indicator automatically draws upper and lower bands based on recent highs and lows. You can leave the default settings or adjust the parameters depending on your trading style.
Access the indicator
Adding the Donchian channels to your chart is fast and straightforward.
How to do it
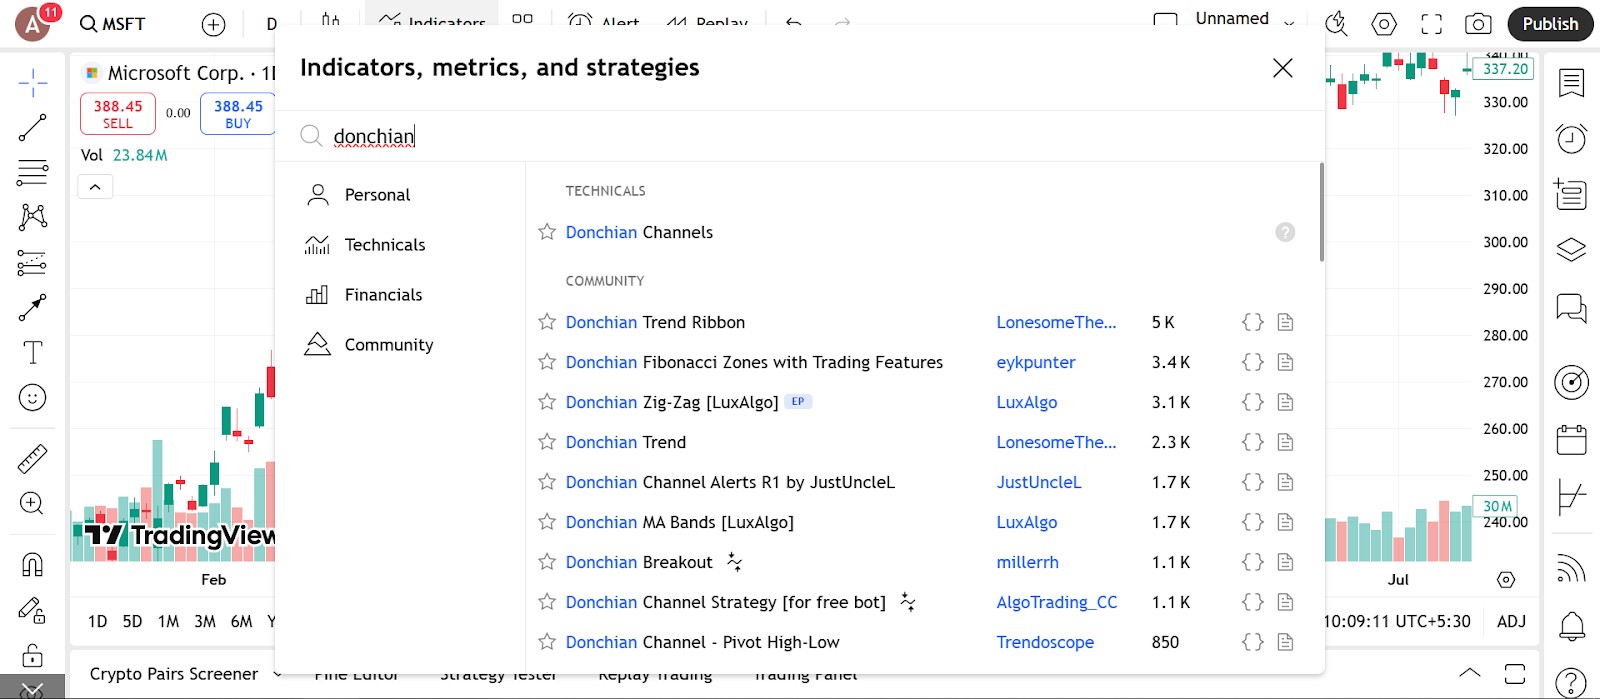
Open the indicators menu in your charting platform.
Type Donchian channels in the search bar.
Click to apply it. The line will appear below your main chart in a separate pane.
Where it’s available
Pre-installed on MetaTrader 4 and 5, TradingView, ThinkorSwim, and most other charting tools.
No external downloads or plug-ins are required.
Configure the parameters
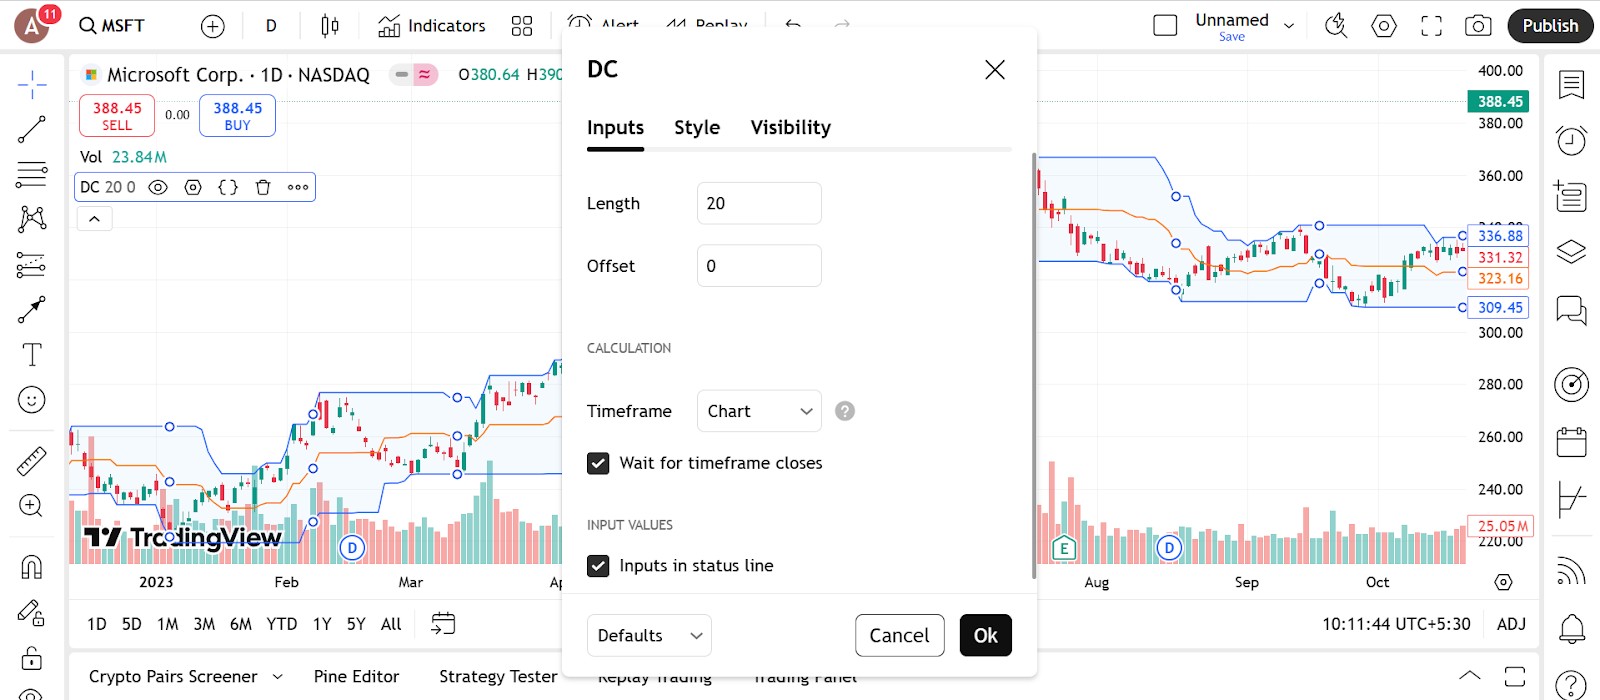
Most platforms allow you to change the period setting and customize how the channel looks visually.
What you can change
Lookback period
The default is usually 20 periods. You can reduce it for quicker signals or increase it to smooth out volatility.Line color and thickness
Change the color of the bands to match your chart theme.
Make the lines thicker or thinner depending on visibility preferences.
Middle line visibility
Some platforms let you toggle the center line on or off.
This line shows the average of the upper and lower bands.
Setup tips
Start with the default 20-period setting to get a feel for how it works.
Adjust only if you need more or fewer signals based on your trading timeframe.
Use in conjunction with price action tools for more convincing confirmation.
Trading strategies using Donchian channels
Donchian channels are great for spotting breakout opportunities and staying with strong trends. Because they track the highest and lowest prices over a set period, they give you clear boundaries to trade around. Here are four practical ways traders use Donchian channels to time their entries and exits.
Breakout entry strategy
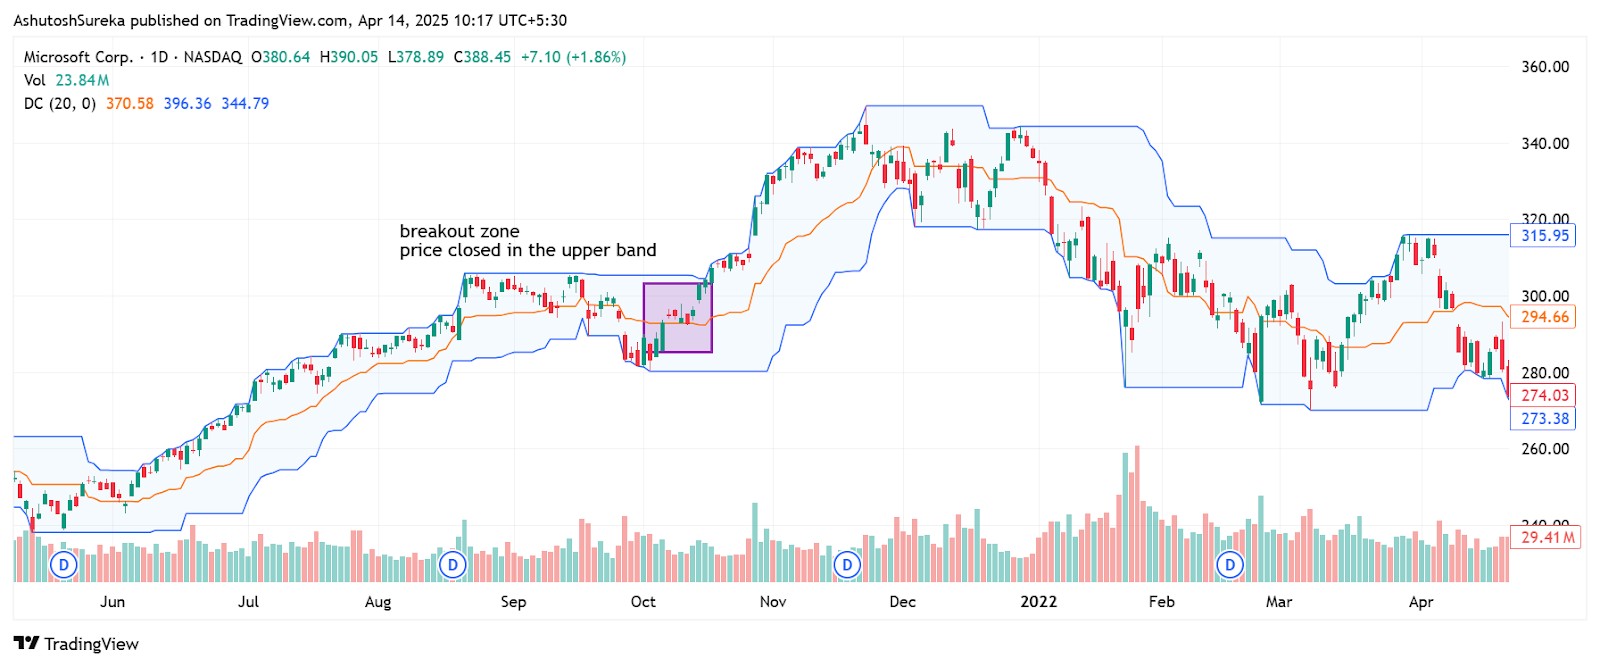
This is the most popular way to use Donchian channels — buying when price breaks above the upper band or selling when it drops below the lower band.
How to apply it
Wait for price to close above the upper band for a buy signal.
Wait for the price to close below the lower band for a sell signal.
Use a trailing stop just inside the channel to manage risk.
Works best in markets with strong direction or momentum.
Why it helps
Clear rules for when to enter.
Let the market confirm its strength before you act.
Reduces emotional, guess-based trades.
Trend-following strategy
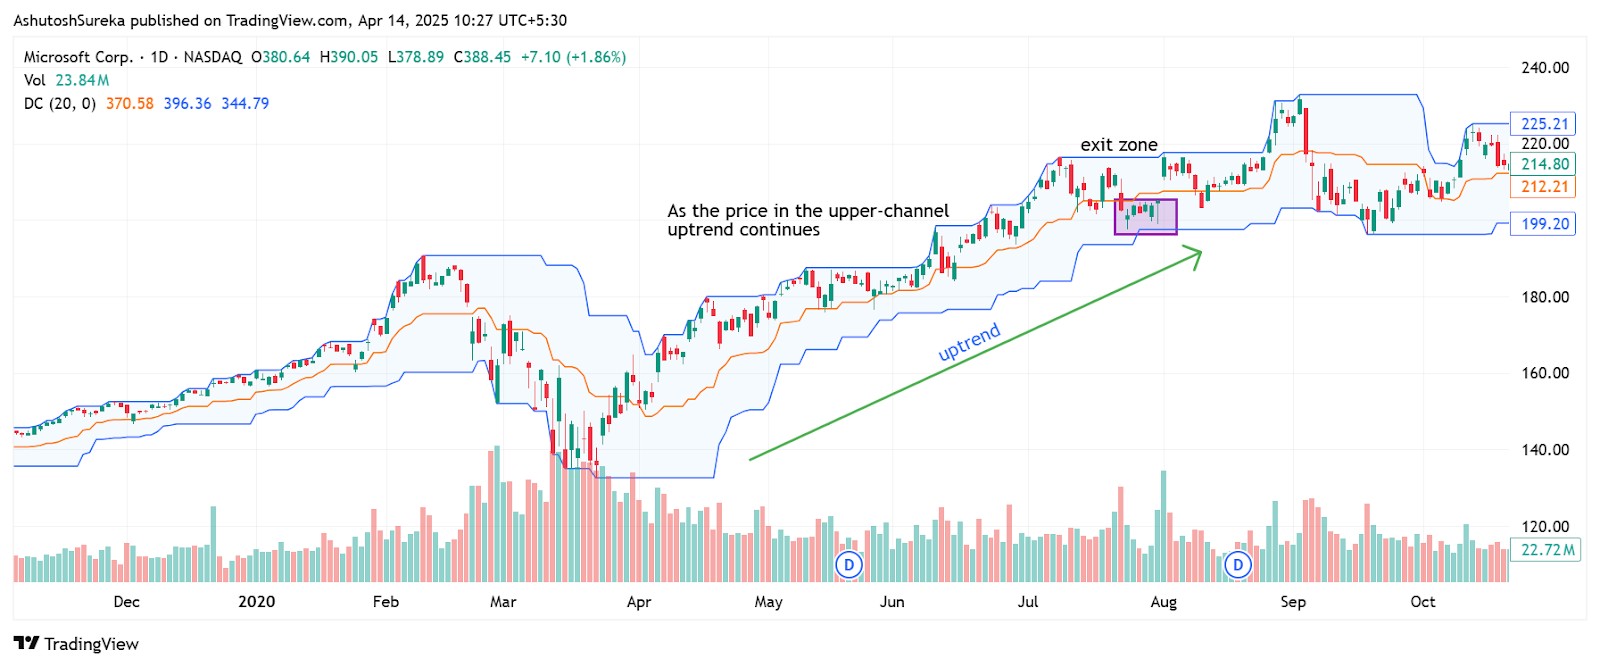
Use the Donchian channel to stay in a trend and avoid exiting too early.
How to apply it
Enter on a breakout as described above.
Stay in the trade as long as price stays outside the channel or near the band.
Exit only when price re-enters the channel or breaks the opposite side.
Can be paired with a moving average to help confirm the trend.
Why it helps
Keeps you in winning trades longer.
Avoids jumping out at the first pullback.
Ideal for medium to long-term setups.
Mean reversion inside the channel
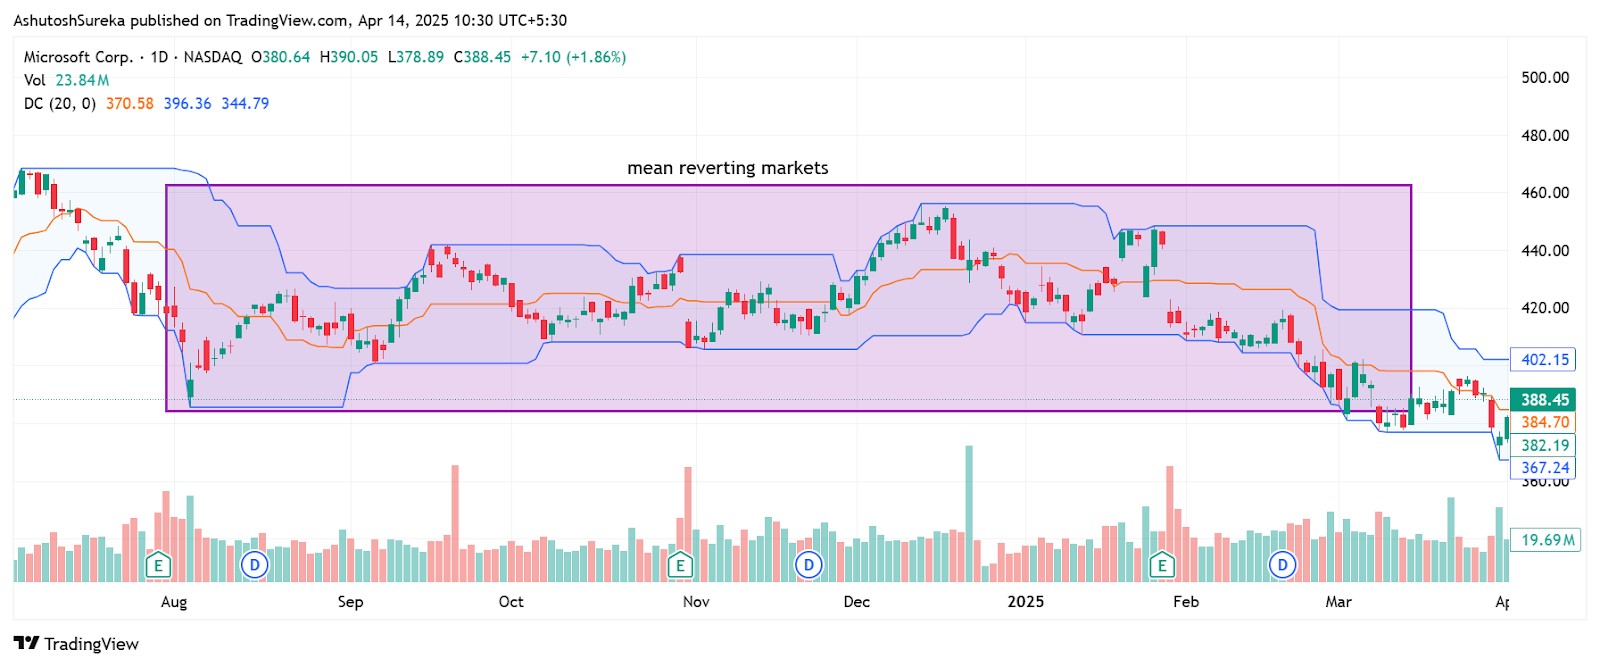
This approach works well in ranging markets, where price keeps bouncing between the bands.
How to apply it
Expect price to approach the upper band in a sideways market.
Sell when price shows rejection near the top band.
Buy when price bounces near the lower band.
Use a tight stop just outside the band and a target near the opposite band.
Why it helps
Takes advantage of repeated support and resistance levels.
Good for short-term setups in quiet markets.
Keeps risk small and trades frequent.
Donchian plus volume confirmation
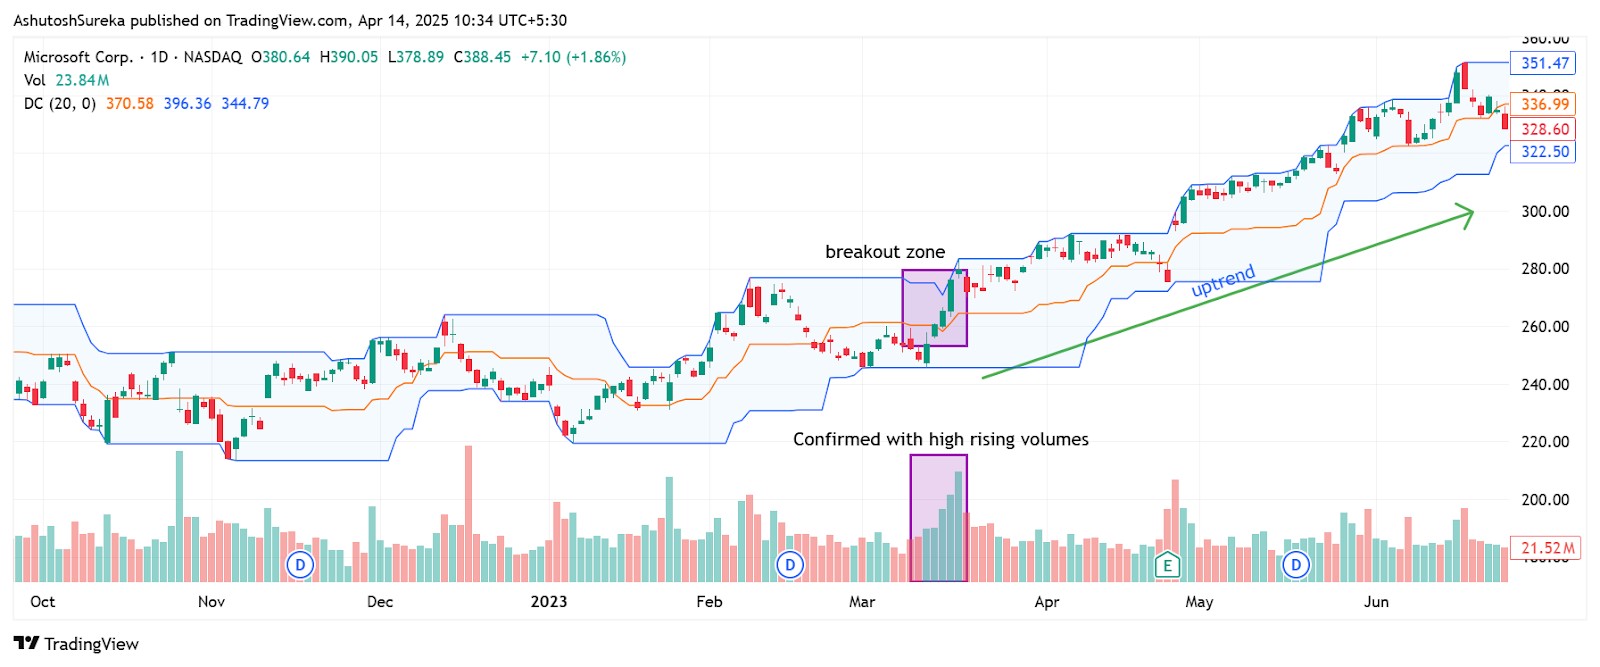
Add volume to filter your breakout entries and avoid false signals.
How to apply it
Watch for a breakout above or below the channel.
Confirm that volume increases with the breakout.
If volume is flat or weak, stay out.
If volume jumps, consider entering with a tighter stop.
Why it helps
Confirms that real traders are behind the move.
Avoids weak breakouts that fizzle quickly.
Adds more weight to your setup.
If your trading style depends on multiple technical indicators, choosing a broker that offers platforms like TradingView, MT5, or cTrader can greatly simplify your workflow. These platforms are packed with advanced charting tools and indicators that cater to nearly every trading strategy. In the comparison table below, you’ll find leading brokers that support these platforms, making it easier for you to evaluate and pick the one that fits your needs best.
| Currency pairs | Crypto | Stocks | Min. deposit, $ | Max. leverage | TradingView | MT5 | cTrader | Regulation | TU overall score | Open an account | |
|---|---|---|---|---|---|---|---|---|---|---|---|
| 90 | Yes | Yes | No | 1:500 | Yes | Yes | Yes | ASIC, FCA, DFSA, BaFin, CMA, SCB, CySec | 7.17 | Open an account Your capital is at risk.
|
|
| 52 | Yes | Yes | 25 | 1:1000 | No | Yes | Yes | MISA, FSC (Mauritius) | 8.2 | Open an account Your capital is at risk. |
|
| 70 | Yes | Yes | 100 | 1:500 | No | Yes | Yes | FCA, CYSEC, FSCA, SCB, FSA (Seychelles) | 7.9 | Open an account Your capital is at risk. |
|
| 56 | Yes | Yes | 50 | 1:1000 | No | Yes | Yes | CySEC, FSC (Mauritius), SVG FSA | 7.87 | Open an account Your capital is at risk. |
|
| 61 | Yes | Yes | 200 | 1:500 | Yes | Yes | Yes | ASIC, CySEC, and FSA | 7.46 | Open an account Your capital is at risk. |
Why trust us
We at Traders Union have analyzed financial markets for over 14 years, evaluating brokers based on 250+ transparent criteria, including security, regulation, and trading conditions. Our expert team of over 50 professionals regularly updates a Watch List of 500+ brokers to provide users with data-driven insights. While our research is based on objective data, we encourage users to perform independent due diligence and consult official regulatory sources before making any financial decisions.
Learn more about our methodology and editorial policies.
Pros and cons of Donchian channels
- Pros
- Cons
Clear breakout signals. The channels make it easy to see when price is breaking out of recent highs or lows. This helps traders react to fresh moves without second-guessing or overthinking the setup.
Good for trend following. You can stay with strong trends by letting the channel guide your exits. As long as price stays outside the bands, the move is likely to continue, helping you avoid early exits.
Works across all timeframes. Donchian channels can be applied to any chart — from 5-minute to daily. That makes them flexible for scalpers, swing traders, and long-term investors alike.
Adapts to volatility. The channel expands during volatile periods and contracts when the market is calm. This helps you understand market rhythm and adjust your strategy accordingly.
Lags in sideways markets. In flat conditions, the channel often gives poor signals. Breakouts may fail quickly, leading to false entries and whipsaws.
Does not predict reversals. The indicator reacts to price — it doesn’t forecast. A breakout might just be temporary noise, especially without confirmation from volume or trend strength.
No standalone entry or exit rules. Donchian channels show levels, but they don’t tell you when to pull the trigger. You’ll need price action, candlestick patterns, or other indicators for full context.
Sensitive to period setting. A short period gives fast signals but more noise. A longer setting is smoother but slower to react. Choosing the right setting depends on your trading style.
Use Donchian like a pressure gauge not a breakout signal

A lot of traders use Donchian like an alarm. Price hits the top and they jump in. But the smart read comes before the breakout. The trick is to watch how price behaves inside the bands. If it keeps coiling and the bands start to tighten, the market is calming down but pressure is rising. Breakouts from these tight spots usually explode. You do not need to wait for the line to break clean. The setup gives it away early. The shape of the channel says more than the breakout bar ever will.
Another thing that gets overlooked is how the channel width shows you the mood. If the bands widen but price stalls, the move might be stretched. But if the trend continues and the channel stays wide, that means the trend still has support. This is how you stay in a winning trade without second-guessing. Donchian does not help you time the top or bottom. It lets you hold through the noise and stay in that zone where most gains happen.
Conclusion
Donchian Channels are not about trying to time exact entries. They help you find where price is heating up and how it reacts at the edge. If you stop chasing the breakout and start reading the area around it, you will find cleaner trades and stay in the move longer. The way the bands stretch or tighten can tell you more than the candles. Use Donchian to help shape your view of the trade, not to box you into a rule. The breakout matters less than the pressure that built it. And knowing when to lean in versus chasing after makes all the difference.
FAQs
How do Donchian channels differ from Bollinger Bands?
Donchian Channels plot the highest high and lowest low over a set period, focusing purely on price range. Bollinger Bands use a moving average and standard deviation, adjusting dynamically to volatility.
Do Donchian channels work on all asset classes?
Yes, Donchian Channels can be used across all asset classes including stocks, forex, commodities, and crypto. They are effective for spotting breakouts and trend boundaries.
Can I use Donchian channels for day trading?
Yes, Donchian Channels are useful for day trading as they help identify breakout points and short-term trend momentum. Lower timeframes like 5 or 15 minutes work well with this tool.
Which indicators can I combine with Donchian channels?
Momentum indicators like RSI or MACD, and volume-based tools like OBV or Chaikin Oscillator, complement Donchian Channels by confirming breakout strength and filtering false signals.
Related Articles
Team that worked on the article
Anton Kharitonov is an active trader and analyst. He employs both short- and long-term trading strategies, primarily based on fundamental factors, supported by technical indicators and intermarket analysis. Anton trades major and minor currency pairs, while his primary focus is on oil futures and index CFDs.
As a financial expert and analyst at Traders Union since 2013, Anton performs thorough internal broker evaluations, referred to as “test drives.” He examines website and account interfaces, client support, software stability, deposit and withdrawal processing speed, legal documentation, and additional broker services such as VPS, affiliate programs, contests, bonuses, and training programs.
New knowledge is the key to expanding our horizons and unlocking new opportunities. Every step in learning, every new understanding empowers us become better, smarter, and stronger. Knowledge provides an advantage, enabling informed decisions, confident actions, and forward momentum. In a changing world, only those who embrace learning and adaptation can truly thrive.
Based on these evaluations, Anton prepares expert reports on the operation of Forex, stock, binary options, and cryptocurrency exchanges.
Chinmay Soni is a financial analyst with more than 5 years of experience in working with stocks, Forex, derivatives, and other assets. As a founder of a boutique research firm and an active researcher, he covers various industries and fields, providing insights backed by statistical data. He is also an educator in the field of finance and technology.
As an author for Traders Union, he contributes his deep analytical insights on various topics, taking into account various aspects.
Mirjan Hipolito is a journalist and news editor at Traders Union. She is an expert crypto writer with five years of experience in the financial markets. Her specialties are daily market news, price predictions, and Initial Coin Offerings (ICO).
Day trading involves buying and selling financial assets within the same trading day, with the goal of profiting from short-term price fluctuations, and positions are typically not held overnight.
Swing trading is a trading strategy that involves holding positions in financial assets, such as stocks or forex, for several days to weeks, aiming to profit from short- to medium-term price swings or "swings" in the market. Swing traders typically use technical and fundamental analysis to identify potential entry and exit points.
Index in trading is the measure of the performance of a group of stocks, which can include the assets and securities in it.
Cryptocurrency is a type of digital or virtual currency that relies on cryptography for security. Unlike traditional currencies issued by governments (fiat currencies), cryptocurrencies operate on decentralized networks, typically based on blockchain technology.
An investor is an individual, who invests money in an asset with the expectation that its value would appreciate in the future. The asset can be anything, including a bond, debenture, mutual fund, equity, gold, silver, exchange-traded funds (ETFs), and real-estate property.


-
 Afghanistan
-
 Albania
-
 Algeria
-
 Argentina
-
 Armenia
-
 Australia
-
 Austria
-
 Azerbaijan
-
 Bahamas
-
 Bahrain
-
 Bangladesh
-
 Belgium
-
 Botswana
-
 Brazil
-
 Brunei
-
 Bulgaria
-
 Burma
Burma
-
 Cambodia
-
 Cameroon
-
 Canada
-
 Chile
Chile
-
 China
China
-
 Colombia
-
 Costa Rica
-
 Cote d'Ivoire
-
 Croatia
-
 Cyprus
-
 Czech Republic
-
 Denmark
-
 Dominican Republic
-
 Ecuador
-
 Egypt
Egypt
-
 Estonia
-
 Eswatini
-
 Ethiopia
-
 Finland
-
 France
-
 Georgia
-
 Germany
-
 Ghana
Ghana
-
 Greece
-
 Haiti
Haiti
-
 Hong Kong
-
 Hungary
-
 India
India
-
 Indonesia
-
 Iran, Islamic republic
-
 Iraq
Iraq
-
 Ireland
-
 Israel
-
 Italy
Italy
-
 Jamaica
-
 Japan
Japan
-
 Jordan
-
 Kazakhstan
-
 Kenya
Kenya
-
 Korea
Korea
-
 Kuwait
-
 Kyrgyzstan
-
 Laos
Laos
-
 Latvia
-
 Lebanon
-
 Libyan Arab Jamahiriya
-
 Lithuania
-
 Luxembourg
-
 Macedonia
-
 Madagascar
-
 Malaysia
-
 Malta
Malta
-
 Mauritius
-
 Mexico
-
 Moldova
-
 Mongolia
-
 Montenegro
-
 Morocco
-
 Mozambique
-
 Namibia
-
 Nepal
Nepal
-
 Netherlands
-
 Nigeria
-
 Norway
-
 Oman
Oman
-
 Pakistan
-
 Palestine
-
 Papua New Guinea
-
 Peru
Peru
-
 Philippines
-
 Poland
-
 Portugal
-
 Puerto Rico
-
 Qatar
Qatar
-
 Romania
-
 Rwanda
-
 Saudi Arabia
-
 Serbia
-
 Singapore
-
 Slovakia
-
 Slovenia
-
 Somalia
-
 South Africa
-
 Spain
Spain
-
 Sri Lanka
-
 Sweden
-
 Switzerland
-
 Syrian Arab Republic
-
 Taiwan
-
 Tajikistan
-
 Tanzania, United Republic Of
-
 Thailand
-
 Trinidad and Tobago
-
 Tunisia
-
 Turkey
-
 UAE
UAE
-
 Uganda
-
 Ukraine
-
 United Kingdom
-
United States
-
 Uzbekistan
-
 Venezuela
-
 Vietnam
-
 Yemen
Yemen
-
 Zambia
-
 Zimbabwe
- Forex
- Crypto
