
+7.18% for Jupiter — volatility spikes after mobile upgrade and technical breakout

Jupiter (JUP) is trading at $0.2016, above the MA-20 ($0.1931), but still below the MA-50 ($0.2256) and MA-200 ($0.4017), which highlights short-term bullish momentum against a persistent medium- and long-term downward trend.
 0.2088
0.2193
0.2088
0.2193
Highlights
- Jupiter has launched Mobile V3, a professional trading app that enables token trading, analytics, and discovery directly within the mobile platform.
- Mobile V3 offers swap fees reportedly up to ten times lower than other competing mobile trading platforms, positioning Jupiter as a cost leader.
- The rollout features a redesigned interface, profit-and-loss tracking, multi-tab support, and maintains Jupiter’s strength in Solana DEX aggregation through seamless API integration.
Feature-rich mobile app launch drives strategic positioning for Jupiter
Jupiter has launched Mobile V3, a fully native professional trading mobile terminal that enables users to trade, analyze, and discover tokens directly within the mobile app, featuring swap fees reportedly up to ten times lower than other competing mobile trading platforms. The rollout introduces a redesigned user interface, profit-and-loss tracking, and multi-tab support, supporting Jupiter’s ongoing strategy to unify analytics and trading functions within a single mobile environment. The platform also maintains its leadership in Solana DEX aggregation, with continued integration through major platform APIs.
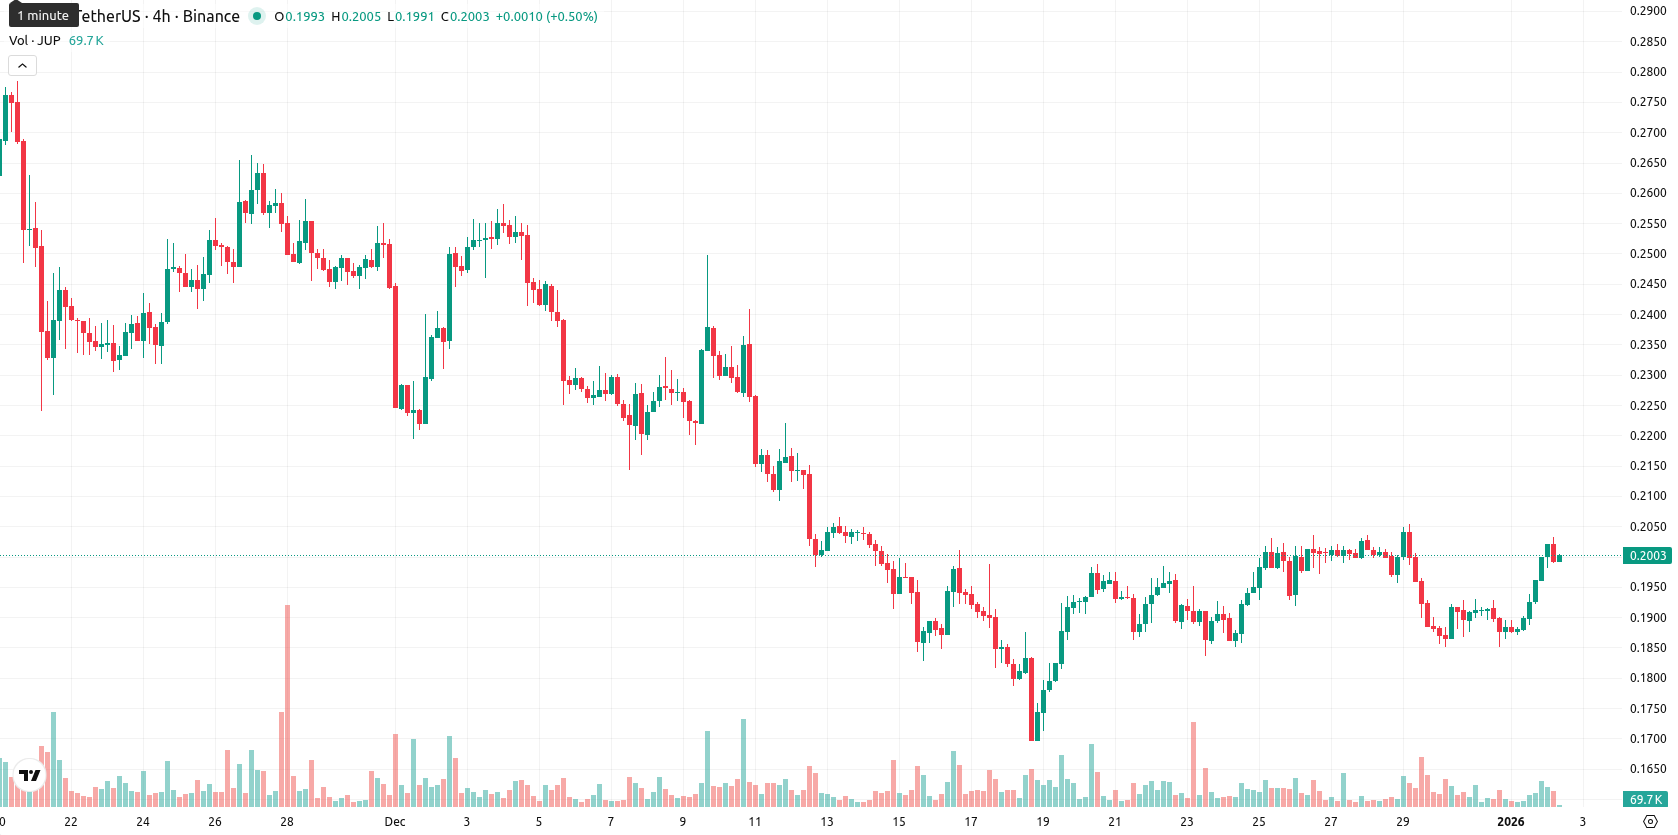
Waning momentum and overbought signals raise short-term reversal risk
The nearest dynamic support for JUP is the Ichimoku Kijun level at $0.2097, which acts as immediate resistance, with further resistance located at the MA-50. Momentum indicators signal mixed short-term dynamics: D1 MACD and ADX suggest waning momentum and a possible short-term pullback, while oscillators give divergent signals — Stoch RSI is overbought at 100.0, RSI stands at 45.4 showing weakness, but Bull/Bear Power (BBP) indicates strong intraday buying pressure. JUP opened with a clear positive gap and is trading near the top of today's range, having climbed 7.18%, underlining high volatility and strong upside pressure after the open. Most intraday signals confirm active buying, but overbought readings and a softening trend highlight risks of a short-term reversal or slowdown.
Bearish momentum expected to dominate within narrow consolidation range
For the next five trading days, JUP's expected price band is set at $0.1839 – $0.2217, capturing typical volatility relative to the current $0.2016 level. There is a very low probability (less than 20%) of a further price increase, while a decrease is more likely due to persistent weekly sell signals from momentum and moving averages. The baseline scenario is for consolidation in a sideways range between $0.19 and $0.22, with the price remaining below the Kijun level. A clear bullish scenario would require a breakout above $0.2256, while a bearish case could see JUP slipping under $0.19 toward lower recent supports.
Previously it was reported that Jupiter (JUP) continues to trade below all major moving averages, with the asset exhibiting persistent bearish momentum as confirmed by daily MACD, ADX, and RSI signals, while holding near the lower end of a tight range. Downside risk remains elevated in the short term, with resistance at the Ichimoku Kijun level ($0.2139) and limited immediate support, as indicators suggest further selling pressure and a narrow volatility band constraining rebound prospects.








-
 Afghanistan
-
 Albania
-
 Algeria
-
 Angola
-
 Argentina
-
 Armenia
-
 Australia
-
 Austria
-
 Azerbaijan
-
 Bahamas
-
 Bahrain
-
 Bangladesh
-
 Belarus
-
 Belgium
-
 Bolivia
-
 Botswana
-
 Brazil
-
 Brunei
-
 Bulgaria
-
 Cambodia
-
 Cameroon
-
 Canada
-
 Chile
Chile
-
 China
China
-
 Colombia
-
 Congo
Congo
-
 Costa Rica
-
 Cote d'Ivoire
-
 Croatia
-
 Cuba
Cuba
-
 Cyprus
-
 Czechia
-
 DR Congo
-
 Denmark
-
 Dominican Republic
-
 Ecuador
-
 Egypt
Egypt
-
 El Salvador
-
 Estonia
-
 Eswatini
-
 Ethiopia
-
 Finland
-
 France
-
 Georgia
-
 Germany
-
 Ghana
Ghana
-
 Greece
-
 Haiti
Haiti
-
 Hong Kong
-
 Hungary
-
 India
India
-
 Indonesia
-
 Iran, Islamic republic
-
 Iraq
Iraq
-
 Ireland
-
 Israel
-
 Italy
Italy
-
 Jamaica
-
 Japan
Japan
-
 Jordan
-
 Kazakhstan
-
 Kenya
Kenya
-
 Korea
Korea
-
 Kuwait
-
 Kyrgyzstan
-
 Laos
Laos
-
 Latvia
-
 Lebanon
-
 Lesotho
-
 Libya
Libya
-
 Lithuania
-
 Luxembourg
-
 Madagascar
-
 Malaysia
-
 Malta
Malta
-
 Mauritius
-
 Mexico
-
 Moldova
-
 Mongolia
-
 Montenegro
-
 Morocco
-
 Mozambique
-
 Myanmar
-
 Namibia
-
 Nepal
Nepal
-
 Netherlands
-
 New Zealand
-
 Nigeria
-
 North Macedonia
-
 Norway
-
 Oman
Oman
-
 Pakistan
-
 Palestine
-
 Panama
-
 Papua New Guinea
-
 Paraguay
-
 Peru
Peru
-
 Philippines
-
 Poland
-
 Portugal
-
 Puerto Rico
-
 Qatar
Qatar
-
 Reunion
-
 Romania
-
 Rwanda
-
 Saudi Arabia
-
 Serbia
-
 Singapore
-
 Slovakia
-
 Slovenia
-
 Somalia
-
 South Africa
-
 Spain
Spain
-
 Sri Lanka
-
 Sweden
-
 Switzerland
-
 Syria
Syria
-
 Taiwan
-
 Tajikistan
-
 Tanzania
-
 Thailand
-
 Trinidad and Tobago
-
 Tunisia
-
 Turkey
-
 UAE
UAE
-
 Uganda
-
 Ukraine
-
 United Kingdom
-
United States
-
 Uruguay
-
 Uzbekistan
-
 Venezuela
-
 Vietnam
-
 Yemen
Yemen
-
 Zambia
-
 Zimbabwe
- Forex
- Crypto











