
+8.84% for Ethena — momentum pushes ENA toward resistance zone

Ethena (ENA) is trading above its MA-20 ($0.2109) but remains just below the MA-50 ($0.2441), with the MA-200 ($0.4457) well overhead. This positioning signals ongoing short-term strength but with medium- and long-term resistance still intact.
Highlights
- ENA is trading above its MA-20 at $0.2109 but remains just below MA-50 at $0.2441, indicating short-term strength with medium-term resistance.
- Momentum indicators are mixed as MACD signals strong sell and oscillators like Stoch RSI and CCI show overbought conditions, warning of a potential near-term pause.
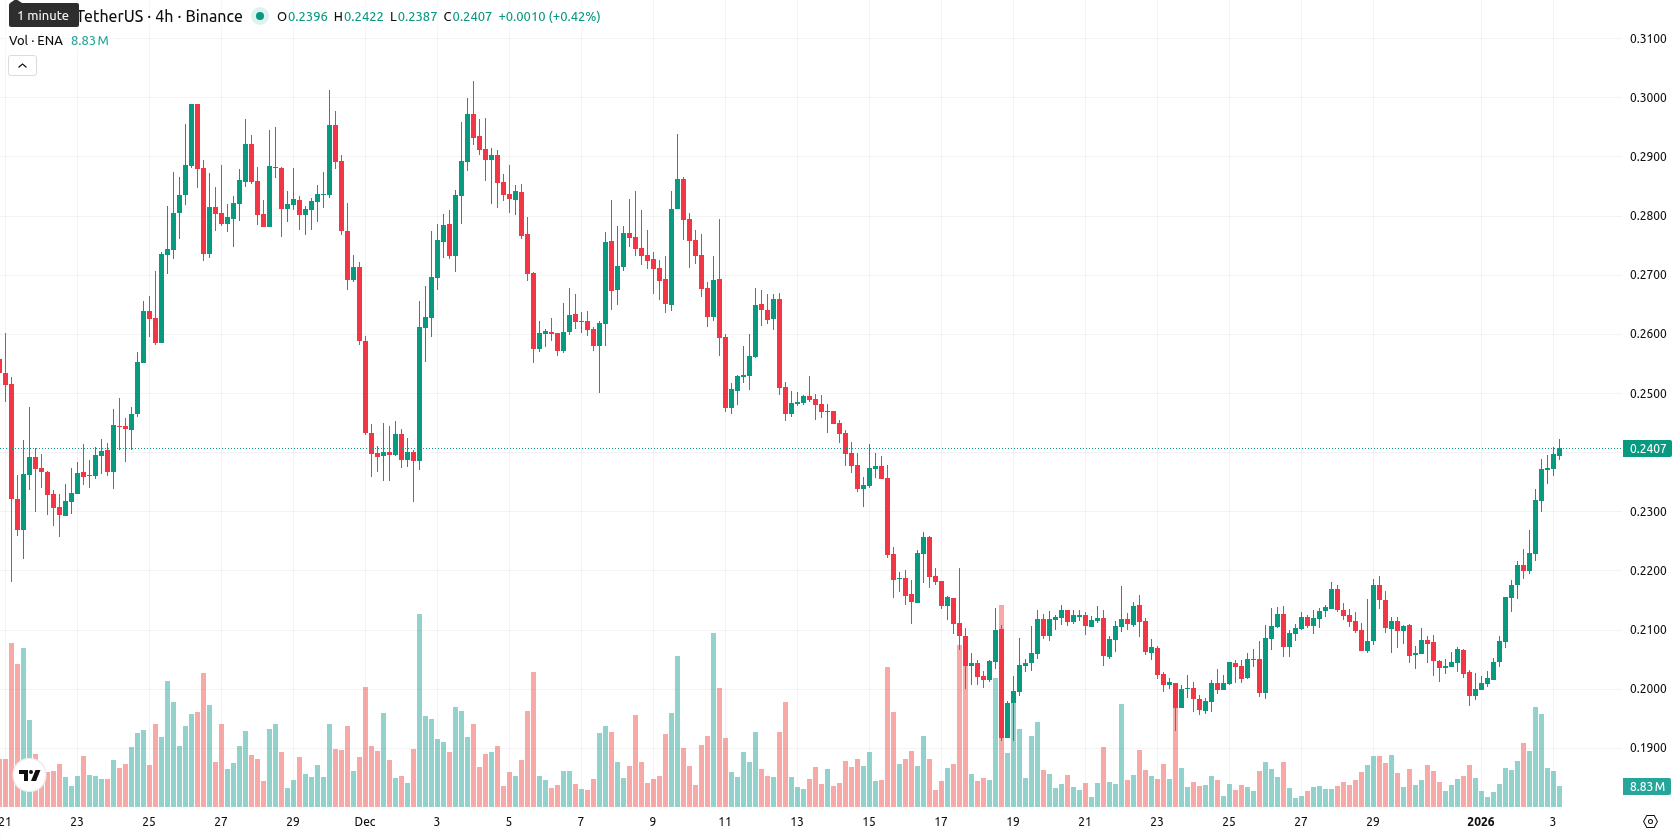
- With ENA up 8.84% today and trading within a tight $0.236–$0.2415 range, a move above $0.2424 could rally further, while a drop below $0.2386 may renew downside pressure.
Mixed momentum as resistance tests buyer conviction
Kijun at $0.2424 and the MA-50 mark the nearest resistance, while $0.2194 – $0.2210 stands as support. Momentum readings on the daily chart are mixed: MACD signals strong sell, diverging from an ADX that points to continued seller dominance but with waning trend strength. Both RSI and BBP indicate moderate buyer pressure, while Stoch RSI and CCI highlight overbought conditions, suggesting a possible near-term pause or rotation. The Awesome Oscillator is neutral and does not reinforce current trends. ENA is up 8.84% today, with no gap between the previous close and open, now trading near the high of its tight $0.236 – $0.2415 session range. Volatility has been moderate, and the intraday tone shows persistent strength toward highs, but with oscillators signaling caution against further immediate upside.
Limited upside as consolidation scenario dominates
Over the next five trading days, ENA is expected to oscillate between $0.2386 and $0.2421. The probability of further price gains is very low (less than 20%), making additional declines or sideway movement more likely. The baseline scenario is for the price to consolidate within the tight corridor identified. A bullish breakout above $0.2424 – $0.2441 could activate momentum toward higher resistance levels, while a bearish move below $0.2386 would expose the asset to renewed downside pressure.
Previously it was reported that Ethena (ENA) is exhibiting near-term bullishness, trading above its 20-day moving average but still below longer-term averages, reflecting upward momentum within an overall pressured trend. Momentum indicators remain mixed—with intraday buyer strength and overbought signals contrasting against bearish daily MACD and ADX readings—while resistance is seen near the MA-50 and support emerges around recent session lows.


-
 Afghanistan
-
 Albania
-
 Algeria
-
 Angola
-
 Argentina
-
 Armenia
-
 Australia
-
 Austria
-
 Azerbaijan
-
 Bahamas
-
 Bahrain
-
 Bangladesh
-
 Belarus
-
 Belgium
-
 Bolivia
-
 Botswana
-
 Brazil
-
 Brunei
-
 Bulgaria
-
 Cambodia
-
 Cameroon
-
 Canada
-
 Chile
Chile
-
 China
China
-
 Colombia
-
 Congo
Congo
-
 Costa Rica
-
 Cote d'Ivoire
-
 Croatia
-
 Cuba
Cuba
-
 Cyprus
-
 Czechia
-
 DR Congo
-
 Denmark
-
 Dominican Republic
-
 Ecuador
-
 Egypt
Egypt
-
 El Salvador
-
 Estonia
-
 Eswatini
-
 Ethiopia
-
 Finland
-
 France
-
 Georgia
-
 Germany
-
 Ghana
Ghana
-
 Greece
-
 Haiti
Haiti
-
 Hong Kong
-
 Hungary
-
 India
India
-
 Indonesia
-
 Iran, Islamic republic
-
 Iraq
Iraq
-
 Ireland
-
 Israel
-
 Italy
Italy
-
 Jamaica
-
 Japan
Japan
-
 Jordan
-
 Kazakhstan
-
 Kenya
Kenya
-
 Korea
Korea
-
 Kuwait
-
 Kyrgyzstan
-
 Laos
Laos
-
 Latvia
-
 Lebanon
-
 Lesotho
-
 Libya
Libya
-
 Lithuania
-
 Luxembourg
-
 Madagascar
-
 Malaysia
-
 Malta
Malta
-
 Mauritius
-
 Mexico
-
 Moldova
-
 Mongolia
-
 Montenegro
-
 Morocco
-
 Mozambique
-
 Myanmar
-
 Namibia
-
 Nepal
Nepal
-
 Netherlands
-
 New Zealand
-
 Nigeria
-
 North Macedonia
-
 Norway
-
 Oman
Oman
-
 Pakistan
-
 Palestine
-
 Panama
-
 Papua New Guinea
-
 Paraguay
-
 Peru
Peru
-
 Philippines
-
 Poland
-
 Portugal
-
 Puerto Rico
-
 Qatar
Qatar
-
 Reunion
-
 Romania
-
 Rwanda
-
 Saudi Arabia
-
 Serbia
-
 Singapore
-
 Slovakia
-
 Slovenia
-
 Somalia
-
 South Africa
-
 Spain
Spain
-
 Sri Lanka
-
 Sweden
-
 Switzerland
-
 Syria
Syria
-
 Taiwan
-
 Tajikistan
-
 Tanzania
-
 Thailand
-
 Trinidad and Tobago
-
 Tunisia
-
 Turkey
-
 UAE
UAE
-
 Uganda
-
 Ukraine
-
 United Kingdom
-
United States
-
 Uruguay
-
 Uzbekistan
-
 Venezuela
-
 Vietnam
-
 Yemen
Yemen
-
 Zambia
-
 Zimbabwe
- Forex
- Crypto
