
BNB slips toward $606.70 with downside confirmed by negative MACD and strong ADX trend – weekly forecast

Binance Coin (BNB) is trading at $606.70, which is below its weekly MA-20 at $617.90, MA-50 at $758.50, and MA-200 at $903.40. Over the past week, the asset declined sharply, closing lower both in absolute terms and as a percentage, signaling persistent bearish pressure and a strong position below major moving averages.
 583.17
584.64
583.17
584.64
Highlights
- BNB trades at $606.70, below its MA-20 at $617.90, MA-50 at $758.50, and MA-200 at $903.40, indicating multi-timeframe selling pressure.
- Momentum indicators including a strong sell MACD, high ADX of 47.0, and oversold RSI and Stochastic RSI confirm a pronounced bearish trend.
- BNB is expected to consolidate between $585 and $630, with a breakdown below $585 likely to accelerate losses given prevailing sell signals.
Expansion in Europe offsets compliance risks amid US regulatory scrutiny
Several U.S. Senate Democrats have called on the Department of Justice and Treasury to investigate Binance over alleged sanctions violations related to crypto transfers involving Iranian entities, with Senator Richard Blumenthal highlighting an inquiry into about $1.7 billion in transactions. Lawmakers are expressing concerns about Binance's compliance protocols and the effectiveness of prior agreements with U.S. regulators. Meanwhile, Binance's selection of Greece as its European headquarters signals ongoing expansion in the region.
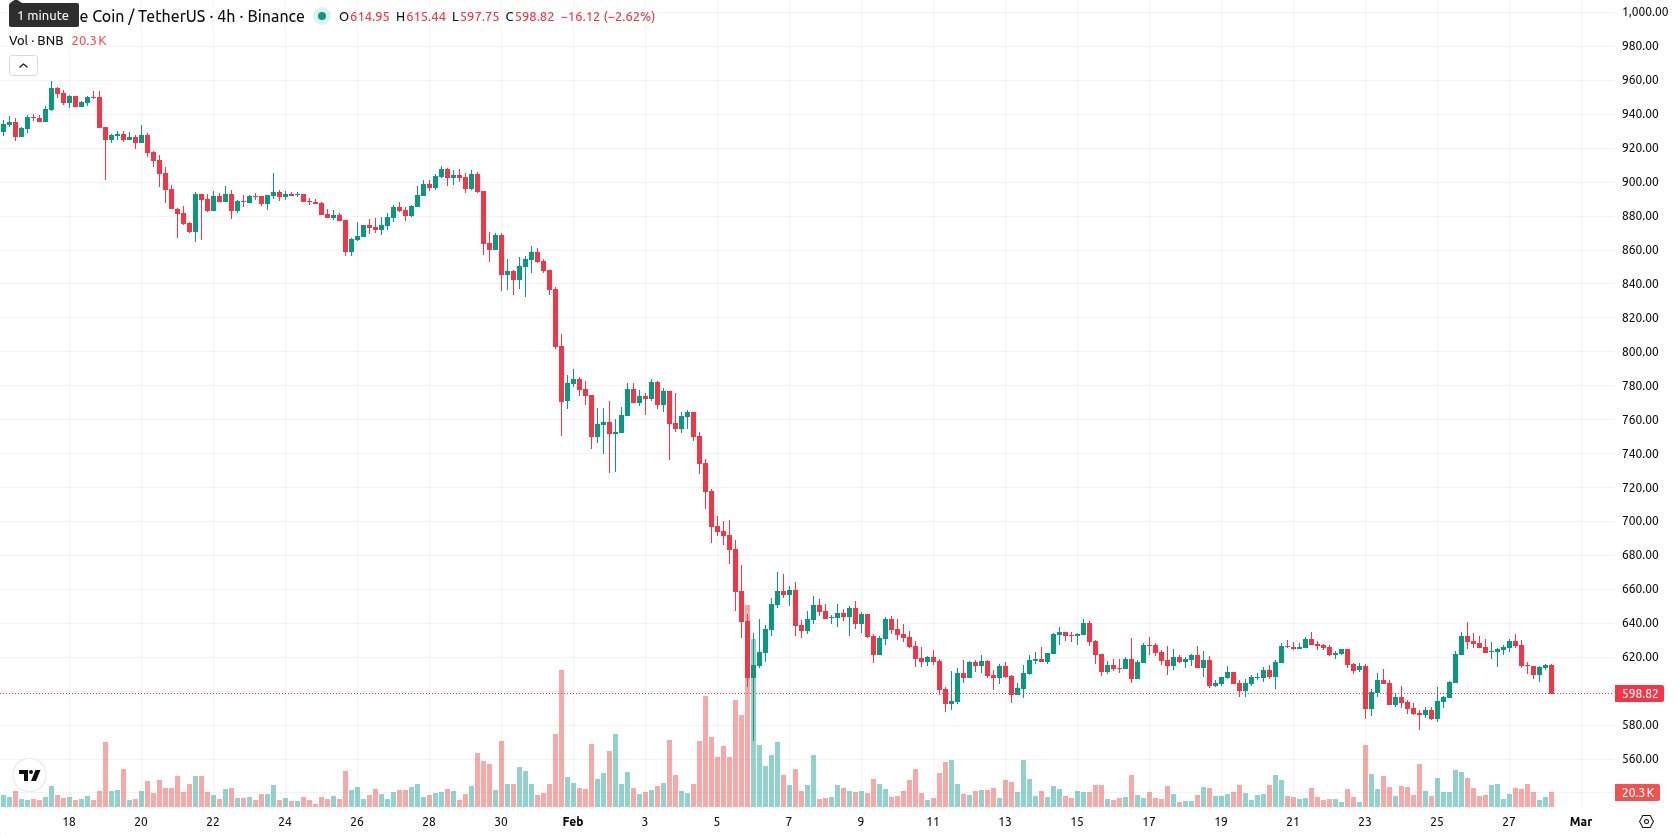
Momentum indicators reinforce extended downside trend this week
Weekly technicals confirm strong downside momentum, with BNB positioned below all major weekly moving averages and the nearest dynamic resistance seen at the Ichimoku Kijun level of $676.90. The MACD on the weekly chart is on a strong sell, while the ADX at 47.0 indicates a powerful downward trend. Both RSI and Stochastic RSI on the weekly timeframe point to oversold conditions, the CCI is neutral, and the Bull/Bear Power shows some buyer activity but confirms sellers remain in control. The Awesome Oscillator is negative, supporting the bearish trend.
Range-bound outlook as dominant selling pressure curbs rebound prospects
For the next week, consolidation between $585 and $630 appears most likely, with less than a 20% chance of a sustained price rebound. If the price rebounds above $630, a bullish scenario may develop, but dominant bearish indicators suggest a deeper move below $585 if sellers accelerate. Upside remains limited by resistance near $676.90, and prevailing trend strength favors sellers, making a downside extension the more probable scenario.
Previously it was reported that Binance Coin is trading with a steady bearish bias, remaining below its short- and long-term moving averages and encountering resistance near $630 amidst cautious sentiment. Technical signals, including an RSI at 41.3, reflect ongoing seller pressure, with the short-term range seen between key support at $590 and resistance at $630.









-
 Afghanistan
-
 Albania
-
 Algeria
-
 Angola
-
 Argentina
-
 Armenia
-
 Australia
-
 Austria
-
 Azerbaijan
-
 Bahamas
-
 Bahrain
-
 Bangladesh
-
 Belarus
-
 Belgium
-
 Bolivia
-
 Botswana
-
 Brazil
-
 Brunei
-
 Bulgaria
-
 Cambodia
-
 Cameroon
-
 Canada
-
 Chile
Chile
-
 China
China
-
 Colombia
-
 Congo
Congo
-
 Costa Rica
-
 Cote d'Ivoire
-
 Croatia
-
 Cuba
Cuba
-
 Cyprus
-
 Czechia
-
 DR Congo
-
 Denmark
-
 Dominican Republic
-
 Ecuador
-
 Egypt
Egypt
-
 El Salvador
-
 Estonia
-
 Eswatini
-
 Ethiopia
-
 Finland
-
 France
-
 Georgia
-
 Germany
-
 Ghana
Ghana
-
 Greece
-
 Haiti
Haiti
-
 Hong Kong
-
 Hungary
-
 India
India
-
 Indonesia
-
 Iran, Islamic republic
-
 Iraq
Iraq
-
 Ireland
-
 Israel
-
 Italy
Italy
-
 Jamaica
-
 Japan
Japan
-
 Jordan
-
 Kazakhstan
-
 Kenya
Kenya
-
 Korea
Korea
-
 Kuwait
-
 Kyrgyzstan
-
 Laos
Laos
-
 Latvia
-
 Lebanon
-
 Lesotho
-
 Libya
Libya
-
 Lithuania
-
 Luxembourg
-
 Madagascar
-
 Malaysia
-
 Malta
Malta
-
 Mauritius
-
 Mexico
-
 Moldova
-
 Mongolia
-
 Montenegro
-
 Morocco
-
 Mozambique
-
 Myanmar
-
 Namibia
-
 Nepal
Nepal
-
 Netherlands
-
 New Zealand
-
 Nigeria
-
 North Macedonia
-
 Norway
-
 Oman
Oman
-
 Pakistan
-
 Palestine
-
 Panama
-
 Papua New Guinea
-
 Paraguay
-
 Peru
Peru
-
 Philippines
-
 Poland
-
 Portugal
-
 Puerto Rico
-
 Qatar
Qatar
-
 Reunion
-
 Romania
-
 Rwanda
-
 Saudi Arabia
-
 Serbia
-
 Singapore
-
 Slovakia
-
 Slovenia
-
 Somalia
-
 South Africa
-
 Spain
Spain
-
 Sri Lanka
-
 Sweden
-
 Switzerland
-
 Syria
Syria
-
 Taiwan
-
 Tajikistan
-
 Tanzania
-
 Thailand
-
 Trinidad and Tobago
-
 Tunisia
-
 Turkey
-
 UAE
UAE
-
 Uganda
-
 Ukraine
-
 United Kingdom
-
United States
-
 Uruguay
-
 Uzbekistan
-
 Venezuela
-
 Vietnam
-
 Yemen
Yemen
-
 Zambia
-
 Zimbabwe
- Forex
- Crypto











