
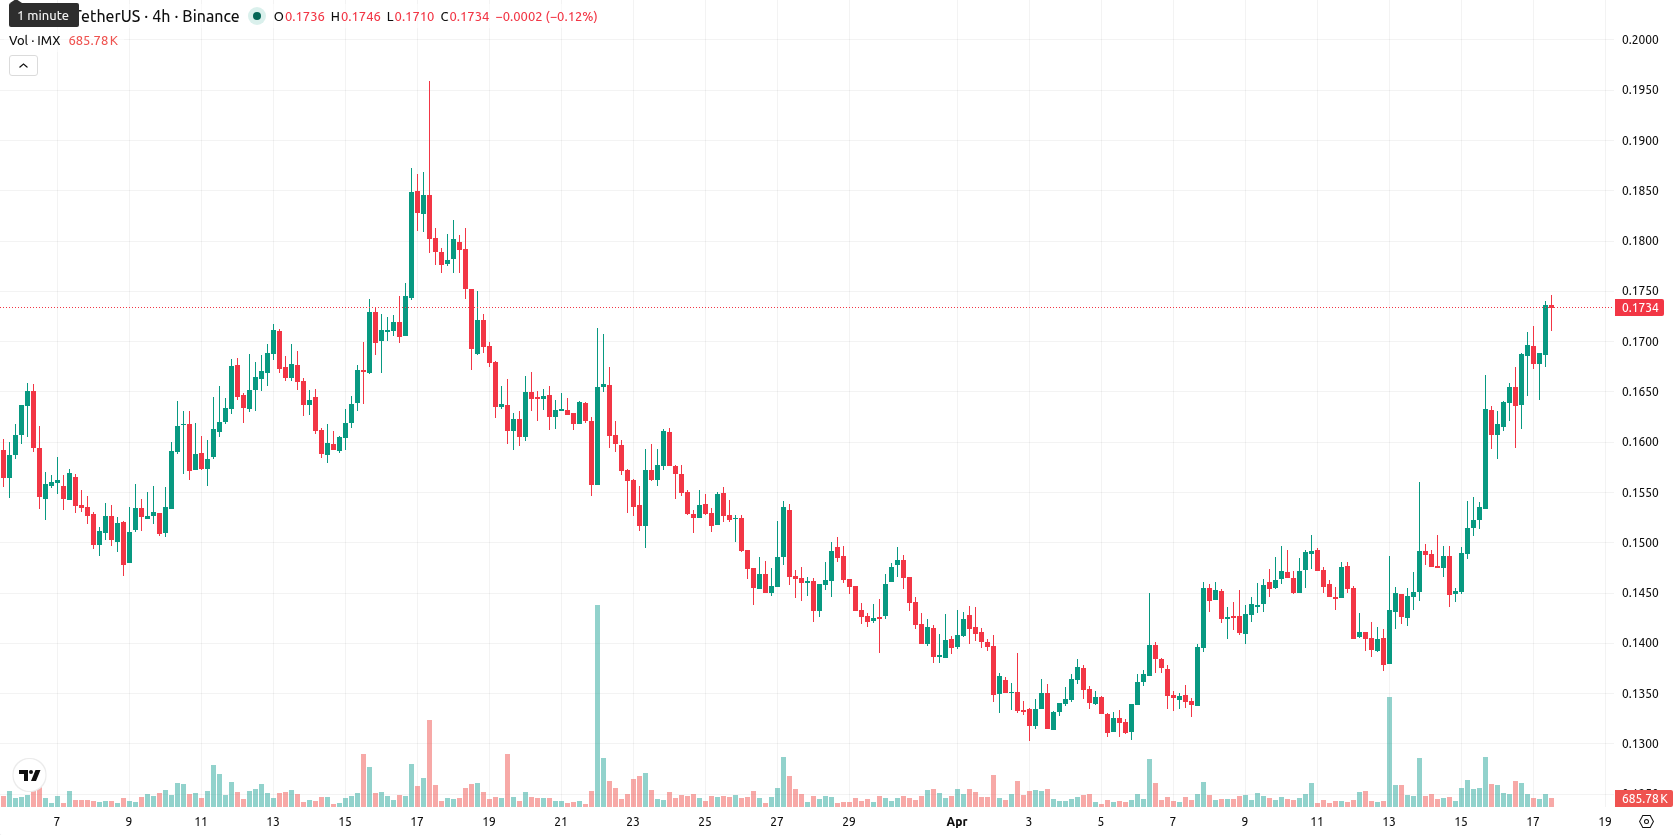
Rapid rally sends Immutable X sharply higher for a second day

Immutable X (IMX) is trading at $0.1731, positioned above the SMA-20 ($0.1435) and SMA-50 ($0.1539), but well below the SMA-200 ($0.2941). This alignment signals short- and medium-term bullish momentum, with longer-term charts still showing prior seller pressure; immediate support stands at the Ichimoku Kijun level of $0.1508, given it is below the current price.
Highlights
- IMX is exhibiting short- and medium-term bullish momentum, trading above key moving averages despite remaining below its long-term trend level.
- Momentum indicators present a mixed picture with intraday overbought signals and neutral trend dynamics, suggesting a risk of losing upward momentum.
- For the coming week, IMX is expected to consolidate within a $0.165 to $0.185 corridor, with a bearish weekly outlook and limited probability of further gains.
Overbought conditions persist as momentum turns mixed
Momentum indicators show a mixed picture: MACD and ADX on D1 are neutral, suggesting trend uncertainty, but RSI (63.4) is still in buy territory while CCI (265.7) and Stoch RSI (100) signal persistent overbought conditions. BBP remains positive, indicating buyer dominance intraday. The session began with a gap up (previous close $0.1609, open $0.1695); the price now trades at the high side of today’s range ($0.1642 – $0.1746) after a daily gain of 7.58%. Volatility has been moderate to high, with strong upward tone and little apparent retracement, though overbought signals highlight a potential loss in upside momentum if buyers waver.
Lower breakout risk increases as weekly indicators turn bearish
For the coming week, a price corridor defined by typical volatility is set at $0.165 to $0.185, reflecting the recent rally while avoiding deviation of more than ±10% from the latest price. Based on W1 indicator readings (all bearish: RSI, ADX, MACD, and MA-50), there is a very low probability (less than 20%) of further price increases, with declines more likely. The baseline scenario is consolidation between $0.165 and $0.185. A bullish break above $0.185 may target $0.19 – $0.195 but faces resistance from longer-term moving averages, while failure of support at $0.165 exposes downside toward the mid-$0.16 zone or lower as weekly sellers regain control.
In a recent review, technical analysis highlighted persistent downside pressure and the lack of bullish signals for Immutable X. The current alignment of short- and medium-term moving averages above price, coupled with overbought intraday readings, introduces the risk of a swift retracement if the $0.165 support level fails, making it a critical threshold for traders to monitor this week.


-
 Afghanistan
-
 Albania
-
 Algeria
-
 Angola
-
 Argentina
-
 Armenia
-
 Australia
-
 Austria
-
 Azerbaijan
-
 Bahamas
-
 Bahrain
-
 Bangladesh
-
 Belarus
-
 Belgium
-
 Bolivia
-
 Botswana
-
 Brazil
-
 Brunei
-
 Bulgaria
-
 Cambodia
-
 Cameroon
-
 Canada
-
 Chile
Chile
-
 China
China
-
 Colombia
-
 Congo
Congo
-
 Costa Rica
-
 Cote d'Ivoire
-
 Croatia
-
 Cuba
Cuba
-
 Cyprus
-
 Czechia
-
 DR Congo
-
 Denmark
-
 Dominican Republic
-
 Ecuador
-
 Egypt
Egypt
-
 El Salvador
-
 Estonia
-
 Eswatini
-
 Ethiopia
-
 Finland
-
 France
-
 Georgia
-
 Germany
-
 Ghana
Ghana
-
 Greece
-
 Haiti
Haiti
-
 Hong Kong
-
 Hungary
-
 India
India
-
 Indonesia
-
 Iran, Islamic republic
-
 Iraq
Iraq
-
 Ireland
-
 Israel
-
 Italy
Italy
-
 Jamaica
-
 Japan
Japan
-
 Jordan
-
 Kazakhstan
-
 Kenya
Kenya
-
 Korea
Korea
-
 Kuwait
-
 Kyrgyzstan
-
 Laos
Laos
-
 Latvia
-
 Lebanon
-
 Lesotho
-
 Libya
Libya
-
 Lithuania
-
 Luxembourg
-
 Madagascar
-
 Malaysia
-
 Malta
Malta
-
 Mauritius
-
 Mexico
-
 Moldova
-
 Mongolia
-
 Montenegro
-
 Morocco
-
 Mozambique
-
 Myanmar
-
 Namibia
-
 Nepal
Nepal
-
 Netherlands
-
 New Zealand
-
 Nigeria
-
 North Macedonia
-
 Norway
-
 Oman
Oman
-
 Pakistan
-
 Palestine
-
 Panama
-
 Papua New Guinea
-
 Paraguay
-
 Peru
Peru
-
 Philippines
-
 Poland
-
 Portugal
-
 Puerto Rico
-
 Qatar
Qatar
-
 Reunion
-
 Romania
-
 Rwanda
-
 Saudi Arabia
-
 Serbia
-
 Singapore
-
 Slovakia
-
 Slovenia
-
 Somalia
-
 South Africa
-
 Spain
Spain
-
 Sri Lanka
-
 Sweden
-
 Switzerland
-
 Syria
Syria
-
 Taiwan
-
 Tajikistan
-
 Tanzania
-
 Thailand
-
 Trinidad and Tobago
-
 Tunisia
-
 Turkey
-
 UAE
UAE
-
 Uganda
-
 Ukraine
-
 United Kingdom
-
United States
-
 Uruguay
-
 Uzbekistan
-
 Venezuela
-
 Vietnam
-
 Yemen
Yemen
-
 Zambia
-
 Zimbabwe
- Forex
- Crypto
