
Polygon slides as price lingers below MA-20 resistance at $0.1048: weekly outlook

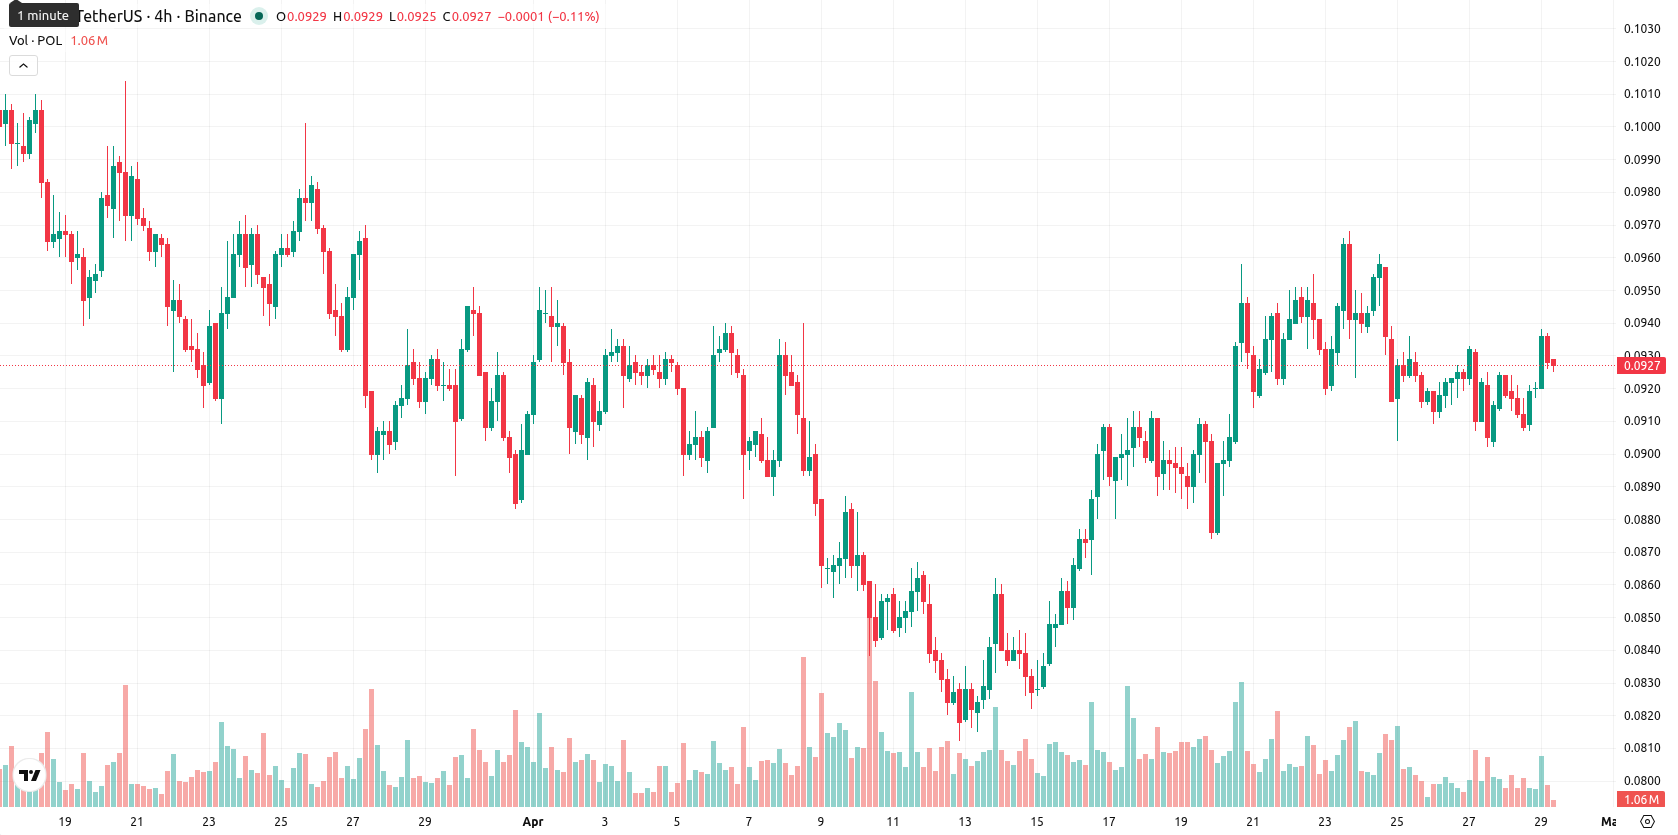
Polygon (POL) is trading at $0.0928, remaining below both its weekly MA-20 ($0.1048) and MA-50 ($0.1665), signaling sustained medium- and long-term downside pressure. Over the past week, POL declined by $0.0022 (2.32%) and is situated in the lower band of its weekly price range.
Highlights
- POL remains under sustained selling pressure, trading below key moving averages and lacking signs of technical recovery.
- Momentum indicators confirm a bearish trend, with oversold conditions and weak trend strength limiting immediate rebound prospects.
- Next week's price likely ranges between $0.0879 and $0.0919, with downside risk toward $0.0812 if support breaks.
Bearish momentum prevails as technical signals confirm sustained downside
Weekly technical analysis continues to indicate strong bearish momentum on the W1 chart. The MA-20 acts as immediate resistance while the Ichimoku Kijun at $0.1371 remains distant and out of play. The MACD signals a strong sell; ADX is weak but points lower, and the RSI sits at 37.4, reflecting oversold conditions. Stochastic RSI is at 93.07, indicating a temporary overbought stretch within this downtrend, while CCI at -73.37 and persistent seller dominance per Bull/Bear Power align with continued downside. The Awesome Oscillator fails to establish a clear trend, and weekly volatility stands at 7.32%.
Neutral to bearish bias as indicators flag narrow range and low breakout risk
The outlook for POL over the next 7 days is neutral to bearish, with price expected to fluctuate between $0.0879 and $0.0919. A sideways movement within this corridor is the baseline scenario, as none of the major W1 indicators (RSI, ADX, MACD, CCI) support a rebound. While a move above $0.0920 could trigger a short-term test of $0.0950, the probability of an upside break remains under 20%. If the lower bound at $0.0879 is breached, further declines toward the $0.0812 long-term low become likely.
Earlier, analysts noted that Polygon was experiencing persistent bearish momentum despite new liquidity initiatives, with upside potential limited by technical resistance. The latest weekly data reinforces this view, and traders should watch for sustained closes above the MA-20 as an early signal of a potential sentiment shift.


-
 Afghanistan
-
 Albania
-
 Algeria
-
 Angola
-
 Argentina
-
 Armenia
-
 Australia
-
 Austria
-
 Azerbaijan
-
 Bahamas
-
 Bahrain
-
 Bangladesh
-
 Belarus
-
 Belgium
-
 Bolivia
-
 Botswana
-
 Brazil
-
 Brunei
-
 Bulgaria
-
 Cambodia
-
 Cameroon
-
 Canada
-
 Chile
Chile
-
 China
China
-
 Colombia
-
 Congo
Congo
-
 Costa Rica
-
 Cote d'Ivoire
-
 Croatia
-
 Cuba
Cuba
-
 Cyprus
-
 Czechia
-
 DR Congo
-
 Denmark
-
 Dominican Republic
-
 Ecuador
-
 Egypt
Egypt
-
 El Salvador
-
 Estonia
-
 Eswatini
-
 Ethiopia
-
 Finland
-
 France
-
 Georgia
-
 Germany
-
 Ghana
Ghana
-
 Greece
-
 Haiti
Haiti
-
 Hong Kong
-
 Hungary
-
 India
India
-
 Indonesia
-
 Iran, Islamic republic
-
 Iraq
Iraq
-
 Ireland
-
 Israel
-
 Italy
Italy
-
 Jamaica
-
 Japan
Japan
-
 Jordan
-
 Kazakhstan
-
 Kenya
Kenya
-
 Korea
Korea
-
 Kuwait
-
 Kyrgyzstan
-
 Laos
Laos
-
 Latvia
-
 Lebanon
-
 Lesotho
-
 Libya
Libya
-
 Lithuania
-
 Luxembourg
-
 Madagascar
-
 Malaysia
-
 Malta
Malta
-
 Mauritius
-
 Mexico
-
 Moldova
-
 Mongolia
-
 Montenegro
-
 Morocco
-
 Mozambique
-
 Myanmar
-
 Namibia
-
 Nepal
Nepal
-
 Netherlands
-
 New Zealand
-
 Nigeria
-
 North Macedonia
-
 Norway
-
 Oman
Oman
-
 Pakistan
-
 Palestine
-
 Panama
-
 Papua New Guinea
-
 Paraguay
-
 Peru
Peru
-
 Philippines
-
 Poland
-
 Portugal
-
 Puerto Rico
-
 Qatar
Qatar
-
 Reunion
-
 Romania
-
 Rwanda
-
 Saudi Arabia
-
 Serbia
-
 Singapore
-
 Slovakia
-
 Slovenia
-
 Somalia
-
 South Africa
-
 Spain
Spain
-
 Sri Lanka
-
 Sweden
-
 Switzerland
-
 Syria
Syria
-
 Taiwan
-
 Tajikistan
-
 Tanzania
-
 Thailand
-
 Trinidad and Tobago
-
 Tunisia
-
 Turkey
-
 UAE
UAE
-
 Uganda
-
 Ukraine
-
 United Kingdom
-
United States
-
 Uruguay
-
 Uzbekistan
-
 Venezuela
-
 Vietnam
-
 Yemen
Yemen
-
 Zambia
-
 Zimbabwe
- Forex
- Crypto
