
Binance Coin price prediction: $736.16 resistance in focus as BNB climbs 7.33%

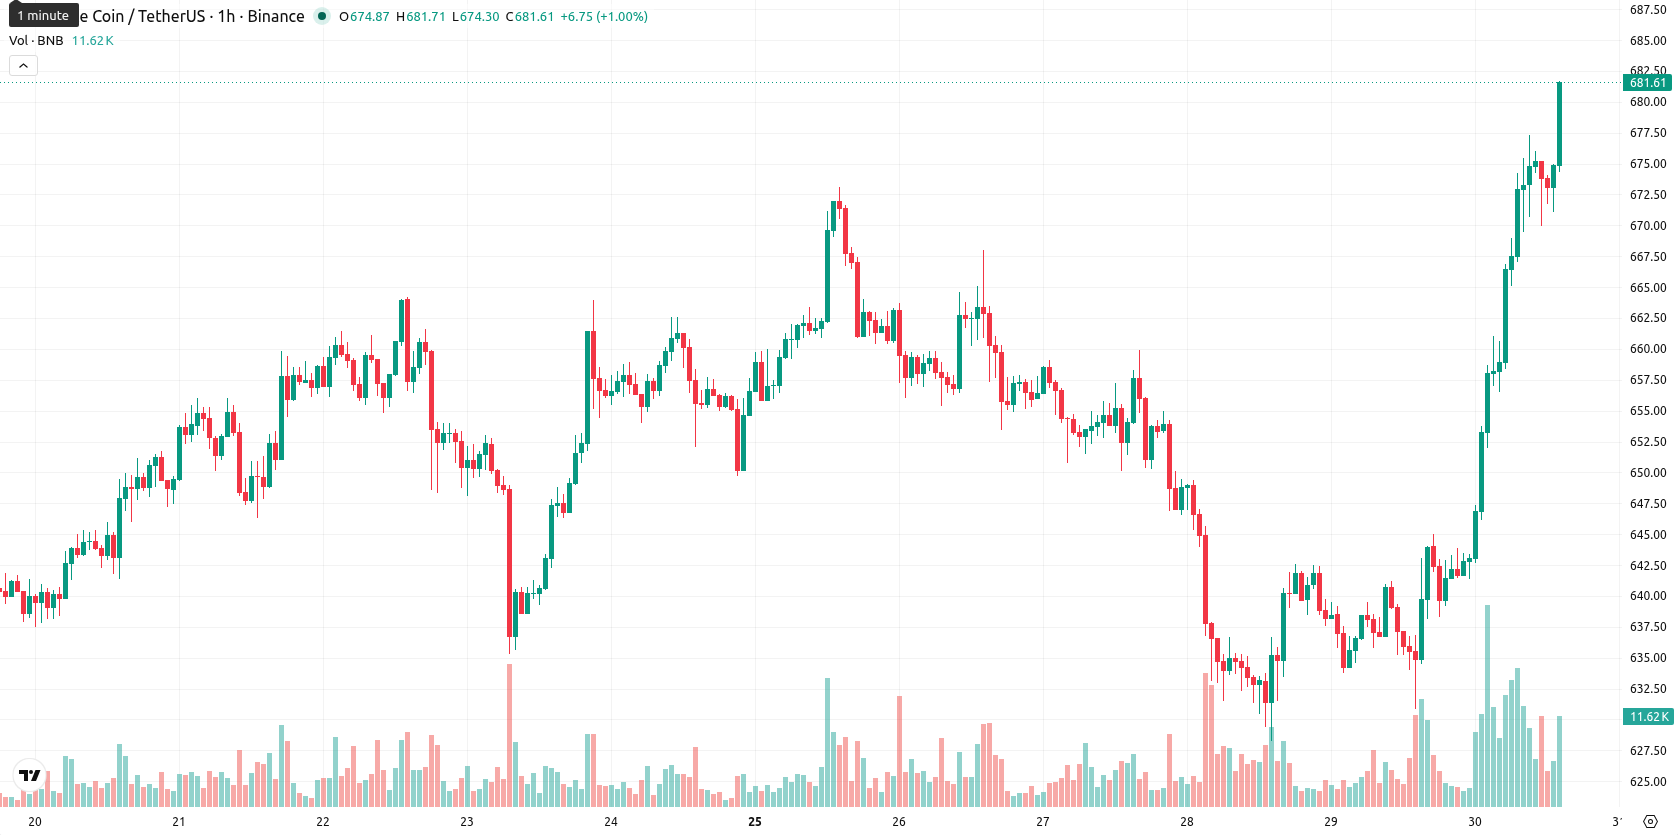
Binance Coin (BNB) is trading at $679.84, gaining $46.44 or 7.33% today. The asset remains well above its short- and medium-term moving averages but continues to trade below its longer-term trend levels.
Highlights
- VanEck launched the first U.S.-listed spot ETF for Binance Coin on Nasdaq, expanding regulated BNB access to U.S. investors.
- Institutional demand is targeted with physical asset backing, third-party custody, and potential future staking, enhancing BNB's market legitimacy.
- BNB trades in a short-term uptrend but faces overextended momentum and likely consolidates between $660 and $700 in the near term.
ETF launch expands U.S. access and fuels institutional inflows
VanEck’s official launch of the first U.S.-listed spot ETF for Binance Coin (BNB) on the Nasdaq marks a pivotal step in expanding the asset’s regulated availability to U.S. investors. The ETF’s structure, with physical backing held in cold storage by Anchorage Digital Bank and an initial $1.02 million in assets, directly addresses institutional requirements for transparency and security, unlocking new channels for capital inflow. By enabling mainstream brokerage access, this development is viewed as a key catalyst for increased demand and improved market legitimacy for BNB, with the future possibility of staking offering added institutional appeal.
Resistance at SMA-200 as momentum signals risk of mean reversion
SMA-20 at $655.56 and SMA-50 at $639.18 offer immediate and intermediate-term reference levels, while the SMA-200 at $736.16 remains the next major resistance overhead. The Ichimoku Kijun is positioned at $656.28, solidifying a near-term support zone. On the momentum side, the daily MACD prints a pronounced buy signal, yet trending strength is weak per the ADX. Oscillator readings, including RSI, CCI, and Stoch RSI, sit close to or inside oversold territory, raising the risk of short-term mean reversion. Meanwhile, intraday BBP levels continue to indicate pronounced seller dominance, and price action exhibits a persistent bias toward session highs.
Consolidation favored as overextension tempers breakout prospects
Looking ahead over the next five trading days, BNB is expected to fluctuate within a volatility band of $660 to $700, reflecting heightened recent price swings. With daily momentum appearing overextended, the likelihood of further substantial upside is limited to less than 20%, favoring scenarios of sideways consolidation or a moderate pullback. A sustained breakout above $700 could prompt new resistance clustering near that level, while any move below $660 may trigger a deeper correction, though more substantial long-term support is situated around the SMA-200.
Previously it was reported that VanEck launched the first U.S.-listed spot ETF for Binance Coin, expanding regulated access to BNB for mainstream investors. With BNB’s recent price action and current technical setup suggesting a period of consolidation, traders should monitor the $660 to $700 band as the primary volatility range in the days ahead.


-
 Afghanistan
-
 Albania
-
 Algeria
-
 Angola
-
 Argentina
-
 Armenia
-
 Australia
-
 Austria
-
 Azerbaijan
-
 Bahamas
-
 Bahrain
-
 Bangladesh
-
 Belarus
-
 Belgium
-
 Bolivia
-
 Botswana
-
 Brazil
-
 Brunei
-
 Bulgaria
-
 Cambodia
-
 Cameroon
-
 Canada
-
 Chile
Chile
-
 China
China
-
 Colombia
-
 Congo
Congo
-
 Costa Rica
-
 Cote d'Ivoire
-
 Croatia
-
 Cuba
Cuba
-
 Cyprus
-
 Czechia
-
 DR Congo
-
 Denmark
-
 Dominican Republic
-
 Ecuador
-
 Egypt
Egypt
-
 El Salvador
-
 Estonia
-
 Eswatini
-
 Ethiopia
-
 Finland
-
 France
-
 Georgia
-
 Germany
-
 Ghana
Ghana
-
 Greece
-
 Haiti
Haiti
-
 Hong Kong
-
 Hungary
-
 India
India
-
 Indonesia
-
 Iran, Islamic republic
-
 Iraq
Iraq
-
 Ireland
-
 Israel
-
 Italy
Italy
-
 Jamaica
-
 Japan
Japan
-
 Jordan
-
 Kazakhstan
-
 Kenya
Kenya
-
 Korea
Korea
-
 Kuwait
-
 Kyrgyzstan
-
 Laos
Laos
-
 Latvia
-
 Lebanon
-
 Lesotho
-
 Libya
Libya
-
 Lithuania
-
 Luxembourg
-
 Madagascar
-
 Malaysia
-
 Malta
Malta
-
 Mauritius
-
 Mexico
-
 Moldova
-
 Mongolia
-
 Montenegro
-
 Morocco
-
 Mozambique
-
 Myanmar
-
 Namibia
-
 Nepal
Nepal
-
 Netherlands
-
 New Zealand
-
 Nigeria
-
 North Macedonia
-
 Norway
-
 Oman
Oman
-
 Pakistan
-
 Palestine
-
 Panama
-
 Papua New Guinea
-
 Paraguay
-
 Peru
Peru
-
 Philippines
-
 Poland
-
 Portugal
-
 Puerto Rico
-
 Qatar
Qatar
-
 Reunion
-
 Romania
-
 Rwanda
-
 Saudi Arabia
-
 Serbia
-
 Singapore
-
 Slovakia
-
 Slovenia
-
 Somalia
-
 South Africa
-
 Spain
Spain
-
 Sri Lanka
-
 Sweden
-
 Switzerland
-
 Syria
Syria
-
 Taiwan
-
 Tajikistan
-
 Tanzania
-
 Thailand
-
 Trinidad and Tobago
-
 Tunisia
-
 Turkey
-
 UAE
UAE
-
 Uganda
-
 Ukraine
-
 United Kingdom
-
United States
-
 Uruguay
-
 Uzbekistan
-
 Venezuela
-
 Vietnam
-
 Yemen
Yemen
-
 Zambia
-
 Zimbabwe
- Forex
- Crypto
