
Persistent selling keeps Sei on the back foot near $0.0454 support

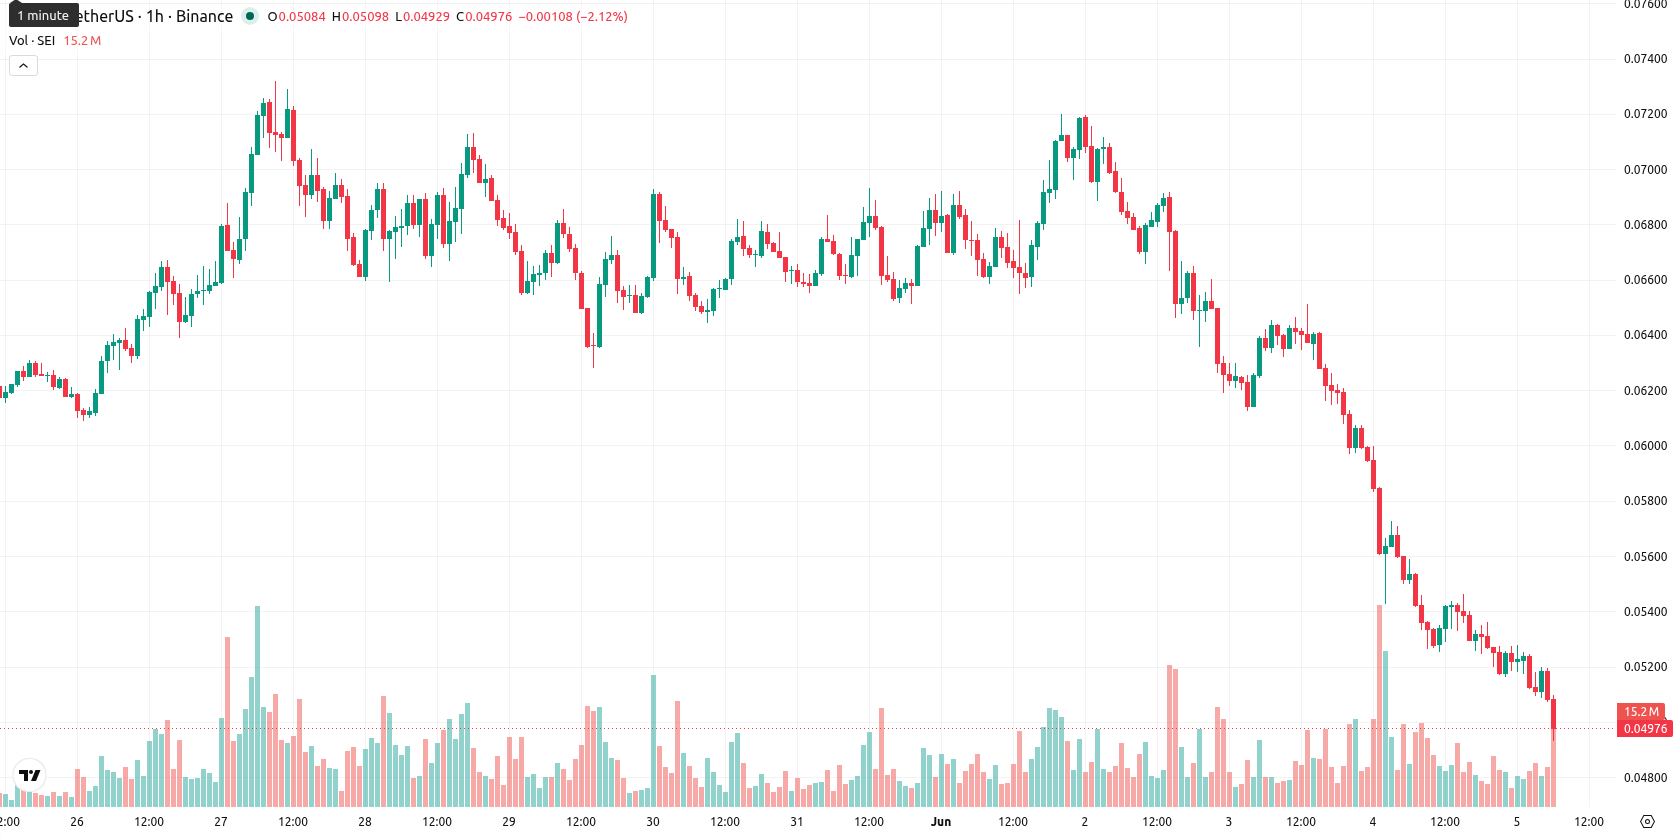
Sei (SEI) is trading at $0.05 after falling 10.22% on the day, with the price positioned below its key moving averages. The asset remains under short- and long-term average levels, indicating downward momentum.
Highlights
- SEI/USD faces strong bearish momentum, trading below major moving averages under heightened selling pressure.
- Momentum and oscillator signals confirm excessive downside, with technicals showing oversold conditions and sustained negative sentiment.
- Expected price range for the next 2–3 days is $0.0454 to $0.0546, with continued downside favored and reversal prospects minimal.
Downside momentum builds with oversold signals across indicators
On the h1 timeframe, SEI/USD is trading below the MA-20 at $0.0527 and the MA-50 at $0.0572, and remains under the long-term MA-200 at $0.0862. The Ichimoku Kijun level at $0.0540 is acting as immediate resistance. MACD and ADX are both on strong sell signals, with RSI at 29.115 and Stochastic RSI also in strong sell territory. Commodity Channel Index readings are deep in oversold, while Bull/Bear Power (BBP) points to strong seller control. Awesome Oscillator is neutral, not confirming the prevailing trend.
Downside risk heightened as breakout triggers remain key
For the next 2–3 trading days, the expected range for SEI/USD is $0.0454 to $0.0546, representing a volatility band relative to current levels. The probability of an upward move is very low, with further downside risk classified as very high; the scenario of a reversal appears unlikely. The most likely outcome is for price action to remain range-bound unless a breakout occurs above the Kijun resistance or below the lower support, which would then trigger a move toward the projected extremes.
Earlier, analysts noted that Sei was experiencing sustained bearish momentum, with technical indicators highlighting strong selling pressure. The latest signals reinforce this outlook, indicating that downside risks remain elevated and that traders should closely observe for any breakout beyond the defined range, as this could trigger a sharp directional move.


-
 Afghanistan
-
 Albania
-
 Algeria
-
 Angola
-
 Argentina
-
 Armenia
-
 Australia
-
 Austria
-
 Azerbaijan
-
 Bahamas
-
 Bahrain
-
 Bangladesh
-
 Belarus
-
 Belgium
-
 Bolivia
-
 Botswana
-
 Brazil
-
 Brunei
-
 Bulgaria
-
 Cambodia
-
 Cameroon
-
 Canada
-
 Chile
Chile
-
 China
China
-
 Colombia
-
 Congo
Congo
-
 Costa Rica
-
 Cote d'Ivoire
-
 Croatia
-
 Cuba
Cuba
-
 Cyprus
-
 Czechia
-
 DR Congo
-
 Denmark
-
 Dominican Republic
-
 Ecuador
-
 Egypt
Egypt
-
 El Salvador
-
 Estonia
-
 Eswatini
-
 Ethiopia
-
 Finland
-
 France
-
 Georgia
-
 Germany
-
 Ghana
Ghana
-
 Greece
-
 Haiti
Haiti
-
 Hong Kong
-
 Hungary
-
 India
India
-
 Indonesia
-
 Iran, Islamic republic
-
 Iraq
Iraq
-
 Ireland
-
 Israel
-
 Italy
Italy
-
 Jamaica
-
 Japan
Japan
-
 Jordan
-
 Kazakhstan
-
 Kenya
Kenya
-
 Korea
Korea
-
 Kuwait
-
 Kyrgyzstan
-
 Laos
Laos
-
 Latvia
-
 Lebanon
-
 Lesotho
-
 Libya
Libya
-
 Lithuania
-
 Luxembourg
-
 Madagascar
-
 Malaysia
-
 Malta
Malta
-
 Mauritius
-
 Mexico
-
 Moldova
-
 Mongolia
-
 Montenegro
-
 Morocco
-
 Mozambique
-
 Myanmar
-
 Namibia
-
 Nepal
Nepal
-
 Netherlands
-
 New Zealand
-
 Nigeria
-
 North Macedonia
-
 Norway
-
 Oman
Oman
-
 Pakistan
-
 Palestine
-
 Panama
-
 Papua New Guinea
-
 Paraguay
-
 Peru
Peru
-
 Philippines
-
 Poland
-
 Portugal
-
 Puerto Rico
-
 Qatar
Qatar
-
 Reunion
-
 Romania
-
 Rwanda
-
 Saudi Arabia
-
 Serbia
-
 Singapore
-
 Slovakia
-
 Slovenia
-
 Somalia
-
 South Africa
-
 Spain
Spain
-
 Sri Lanka
-
 Sweden
-
 Switzerland
-
 Syria
Syria
-
 Taiwan
-
 Tajikistan
-
 Tanzania
-
 Thailand
-
 Trinidad and Tobago
-
 Tunisia
-
 Turkey
-
 UAE
UAE
-
 Uganda
-
 Ukraine
-
 United Kingdom
-
United States
-
 Uruguay
-
 Uzbekistan
-
 Venezuela
-
 Vietnam
-
 Yemen
Yemen
-
 Zambia
-
 Zimbabwe
- Forex
- Crypto
