
Aave falls 6.19% as total value locked drops sharply

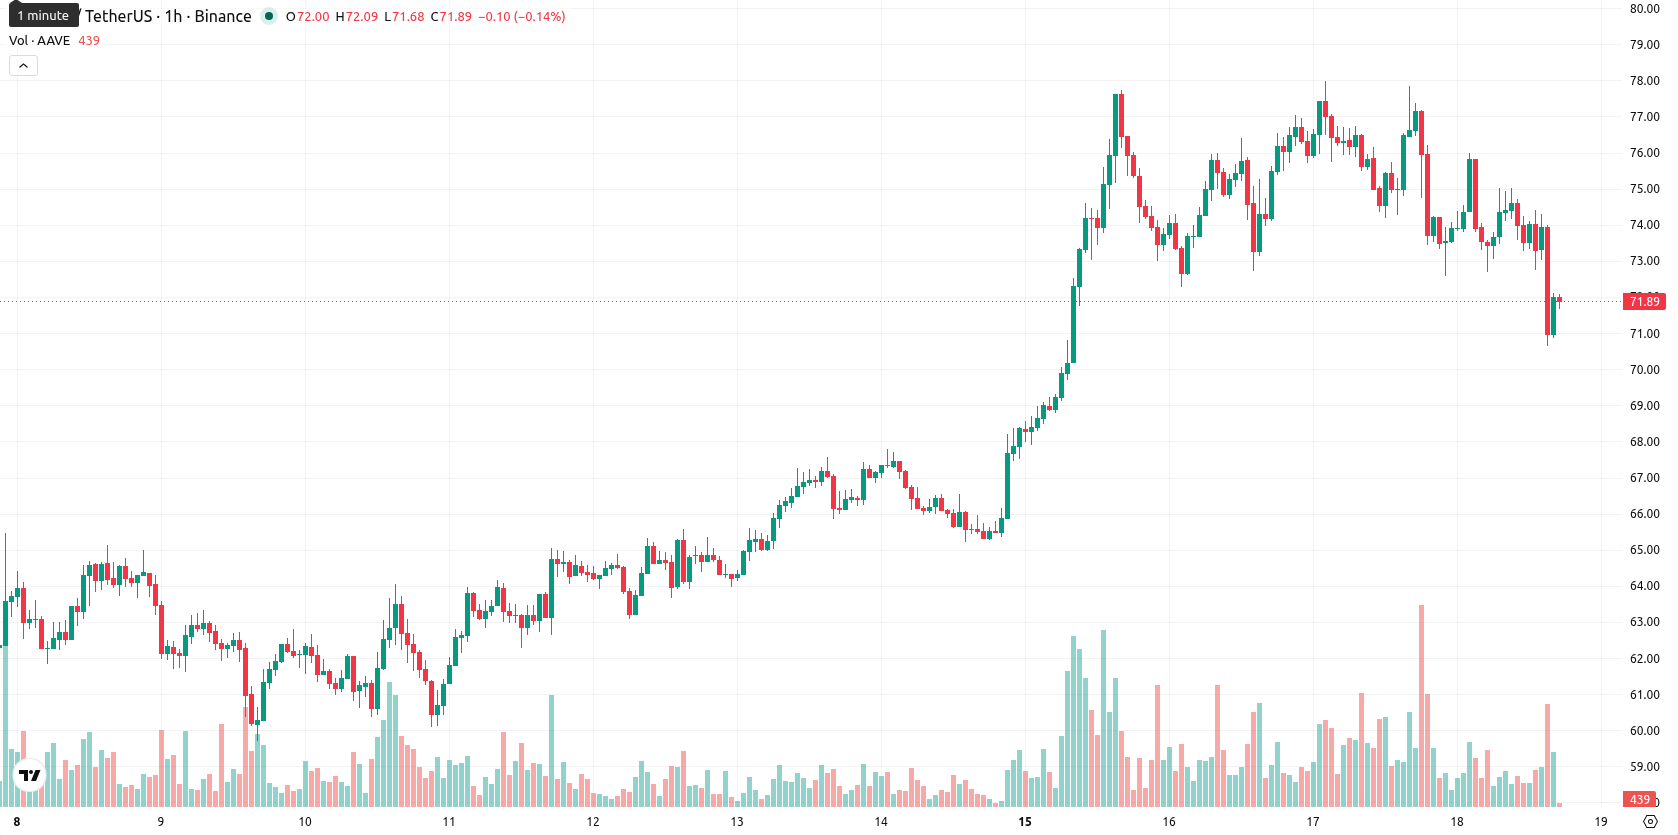
Aave (AAVE) is trading at $71.85 after a sharp 6.19% decline over the past 24 hours, closing near session lows. The asset remains well below its key moving averages, reflecting strong pressure from sellers in the short and medium term.
Highlights
- Aave's total value locked declined sharply from $45 billion in 2025 to $13 billion by June 2026, indicating reduced protocol capital and revenue potential.
- Governance-driven suspension of token buybacks removed a key supply absorption mechanism, intensifying token price pressure despite Aave’s continued user activity and large treasury.
- AAVE trades below major technical benchmarks with bearish momentum; price is expected to fluctuate between $68.52 and $75.18, with downside risk dominant.
TVL contraction and paused buybacks weigh on Aave despite treasury strength
Aave recorded a significant decrease in total value locked, falling from $45 billion in 2025 to approximately $13 billion as of June 2026, which reflects a contraction in active capital and may limit protocol revenue, according to Grayscale Research. The recent pause in token buybacks, pending a governance review, has removed a mechanism that previously absorbed circulating supply and supported the token in adverse markets. Despite these developments, Aave has maintained its position as the leading decentralized lending protocol with substantial treasury reserves and ongoing user activity after market exploits and key contributor departures, based on Grayscale's analysis, though price action has remained under broader selling pressure.
Persistent bearish momentum as key resistance and divergences emerge
On the hourly chart, AAVE/USD is trading below the MA-20 at $73.72 and MA-50 at $74.99, while the daily chart places the asset well under the MA-200 at $121.04. The Ichimoku Kijun on the daily timeframe stands at $74.37, acting as immediate resistance. Momentum readings are weak, with MACD and Awesome Oscillator both signaling Sell, ADX indicating Neutral, and RSI reading 38.52, which also supports a Sell signal. CCI and BBP both confirm oversold conditions and the dominance of sellers, although the Stoch RSI suggests a Strong Buy, highlighting a divergence among indicators and hinting at high volatility conditions.
Downside risk prevails as price consolidates in volatile range
In the near term, AAVE is expected to trade within a volatile band ranging from $68.52 to $75.18 over the next two to three days. The probability of an upward move is currently measured at 32%, while downside risk holds a higher likelihood at 68%. The baseline forecast anticipates sideways movement within this corridor. A break above the $74.37 resistance would be needed to trigger a bullish scenario, while a sustained move below the $68.52 support could drive further losses.
Earlier, analysts noted that Aave stands out as a leading decentralized lending protocol whose investment thesis increasingly depends on sustainable revenue generation and effective value accrual to token holders. Current price action and technical weakness underscore a shift toward heightened volatility, making the $68.52 support a critical level to watch for traders assessing potential downside risk.


Latest AAVE News


-
 Afghanistan
-
 Albania
-
 Algeria
-
 Angola
-
 Argentina
-
 Armenia
-
 Australia
-
 Austria
-
 Azerbaijan
-
 Bahamas
-
 Bahrain
-
 Bangladesh
-
 Belarus
-
 Belgium
-
 Bolivia
-
 Botswana
-
 Brazil
-
 Brunei
-
 Bulgaria
-
 Cambodia
-
 Cameroon
-
 Canada
-
 Chile
Chile
-
 China
China
-
 Colombia
-
 Congo
Congo
-
 Costa Rica
-
 Cote d'Ivoire
-
 Croatia
-
 Cuba
Cuba
-
 Cyprus
-
 Czechia
-
 DR Congo
-
 Denmark
-
 Dominican Republic
-
 Ecuador
-
 Egypt
Egypt
-
 El Salvador
-
 Estonia
-
 Eswatini
-
 Ethiopia
-
 Finland
-
 France
-
 Georgia
-
 Germany
-
 Ghana
Ghana
-
 Greece
-
 Haiti
Haiti
-
 Hong Kong
-
 Hungary
-
 India
India
-
 Indonesia
-
 Iran, Islamic republic
-
 Iraq
Iraq
-
 Ireland
-
 Israel
-
 Italy
Italy
-
 Jamaica
-
 Japan
Japan
-
 Jordan
-
 Kazakhstan
-
 Kenya
Kenya
-
 Korea
Korea
-
 Kuwait
-
 Kyrgyzstan
-
 Laos
Laos
-
 Latvia
-
 Lebanon
-
 Lesotho
-
 Libya
Libya
-
 Lithuania
-
 Luxembourg
-
 Madagascar
-
 Malaysia
-
 Malta
Malta
-
 Mauritius
-
 Mexico
-
 Moldova
-
 Mongolia
-
 Montenegro
-
 Morocco
-
 Mozambique
-
 Myanmar
-
 Namibia
-
 Nepal
Nepal
-
 Netherlands
-
 New Zealand
-
 Nigeria
-
 North Macedonia
-
 Norway
-
 Oman
Oman
-
 Pakistan
-
 Palestine
-
 Panama
-
 Papua New Guinea
-
 Paraguay
-
 Peru
Peru
-
 Philippines
-
 Poland
-
 Portugal
-
 Puerto Rico
-
 Qatar
Qatar
-
 Reunion
-
 Romania
-
 Rwanda
-
 Saudi Arabia
-
 Serbia
-
 Singapore
-
 Slovakia
-
 Slovenia
-
 Somalia
-
 South Africa
-
 Spain
Spain
-
 Sri Lanka
-
 Sweden
-
 Switzerland
-
 Syria
Syria
-
 Taiwan
-
 Tajikistan
-
 Tanzania
-
 Thailand
-
 Trinidad and Tobago
-
 Tunisia
-
 Turkey
-
 UAE
UAE
-
 Uganda
-
 Ukraine
-
 United Kingdom
-
United States
-
 Uruguay
-
 Uzbekistan
-
 Venezuela
-
 Vietnam
-
 Yemen
Yemen
-
 Zambia
-
 Zimbabwe
- Forex
- Crypto
