
Polygon shows mixed movement with oversold readings on RSI and CCI: weekly analysis

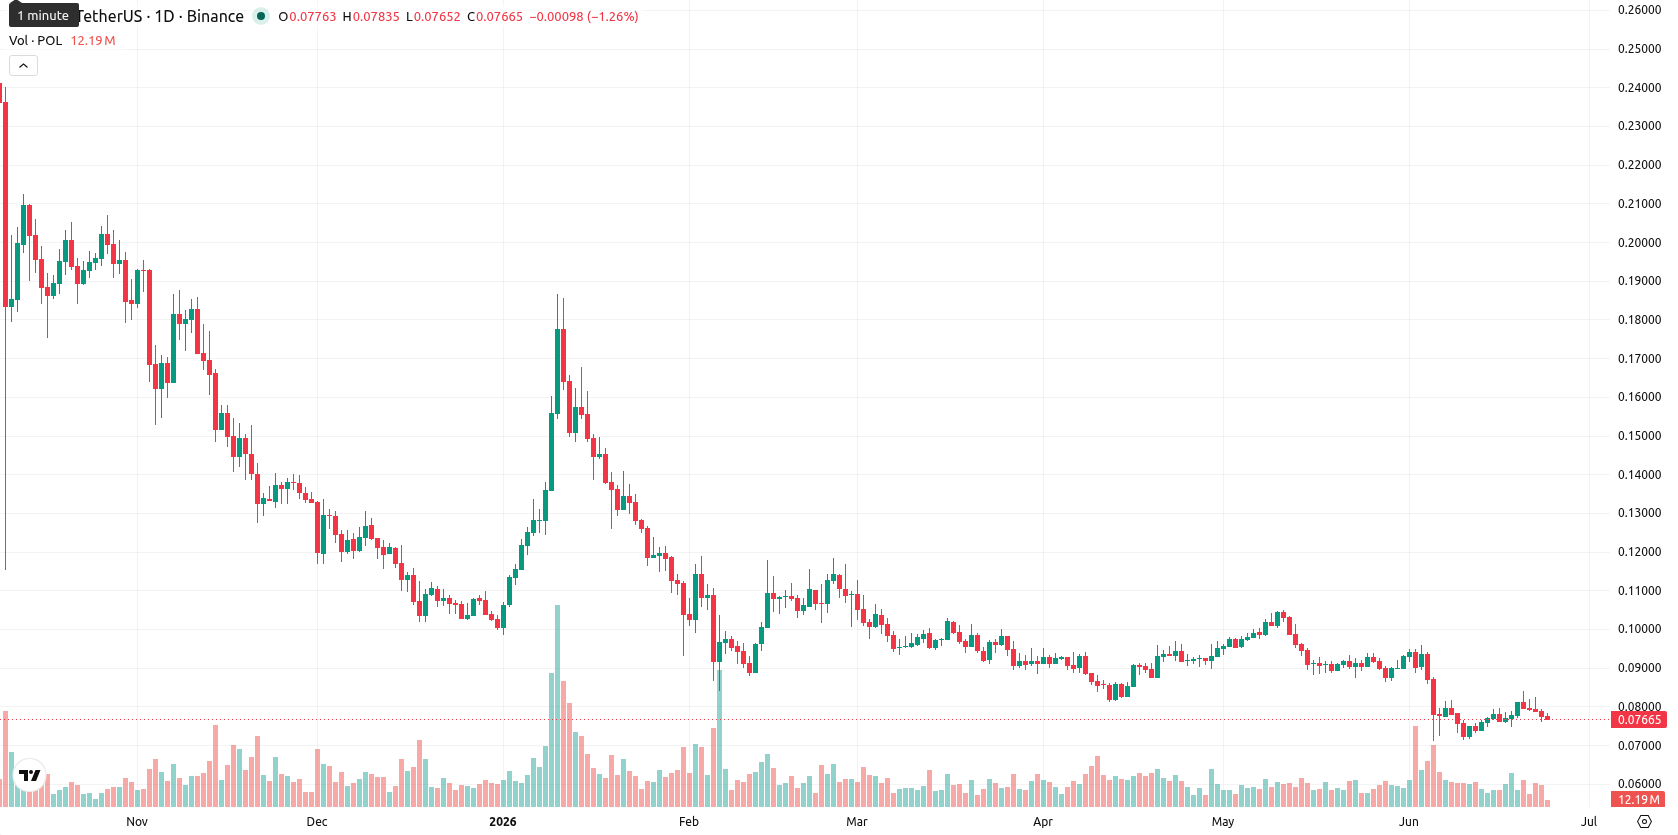
Polygon (POL, formerly MATIC) closed out the week with a minimal gain of $0.0002, representing a 0.22% increase. The asset remains well below both the weekly MA-20 ($0.0918) and MA-50 ($0.1478), signaling persistent downside pressure and consolidation at the lower end of its weekly range.
 0.0853
0.0855
0.0853
0.0855
Highlights
- POL continues to face downward momentum, trading below major moving averages and consolidating near recent lows.
- Technical indicators collectively signal bearish conditions and persistent selling pressure, with most pointing to oversold territory.
- Expected price action remains constrained between $0.0750 and $0.0785 over the next week, with a low probability of an upside breakout.
Bearish momentum affirmed this week as oversold signals deepen
On the weekly chart, POL maintains a bearish setup with price action firmly beneath the MA-20 and MA-50, making $0.0918 the nearest dynamic resistance. Momentum readings remain negative: the weekly MACD issues a strong sell, the ADX confirms ongoing bearish momentum, and both the RSI and CCI point to oversold conditions. Stochastic RSI is neutral but leans toward oversold, while Bull/Bear Power remains negative, highlighting continued seller dominance. The Awesome Oscillator registers as neutral, offering no immediate reversal signal.
Sideways consolidation likely in coming week as rebound odds fade
For the next 7 days, POL is expected to trade between $0.0750 and $0.0785, with volatility likely to remain elevated. The probability of a short-term rebound is very low, as no major weekly indicators suggest buying interest. The most probable scenario is sideways consolidation near the lower end of the recent range. A break above $0.0785 would indicate a weak bullish push, while a move below $0.0750 could trigger further downside continuation.
Previously it was reported that Polygon was exhibiting signs of bullish momentum and ecosystem advancements, with analysts favoring a limited downside scenario in the short term. The latest weekly technicals, however, signal continued bearish pressure and suggest that traders should watch for a sustained break below $0.0750 as an indicator of potential further downside risk.








-
 Afghanistan
-
 Albania
-
 Algeria
-
 Angola
-
 Argentina
-
 Armenia
-
 Australia
-
 Austria
-
 Azerbaijan
-
 Bahamas
-
 Bahrain
-
 Bangladesh
-
 Belarus
-
 Belgium
-
 Bolivia
-
 Botswana
-
 Brazil
-
 Brunei
-
 Bulgaria
-
 Cambodia
-
 Cameroon
-
 Canada
-
 Chile
Chile
-
 China
China
-
 Colombia
-
 Congo
Congo
-
 Costa Rica
-
 Cote d'Ivoire
-
 Croatia
-
 Cuba
Cuba
-
 Cyprus
-
 Czechia
-
 DR Congo
-
 Denmark
-
 Dominican Republic
-
 Ecuador
-
 Egypt
Egypt
-
 El Salvador
-
 Estonia
-
 Eswatini
-
 Ethiopia
-
 Finland
-
 France
-
 Georgia
-
 Germany
-
 Ghana
Ghana
-
 Greece
-
 Haiti
Haiti
-
 Hong Kong
-
 Hungary
-
 India
India
-
 Indonesia
-
 Iran, Islamic republic
-
 Iraq
Iraq
-
 Ireland
-
 Israel
-
 Italy
Italy
-
 Jamaica
-
 Japan
Japan
-
 Jordan
-
 Kazakhstan
-
 Kenya
Kenya
-
 Korea
Korea
-
 Kuwait
-
 Kyrgyzstan
-
 Laos
Laos
-
 Latvia
-
 Lebanon
-
 Lesotho
-
 Libya
Libya
-
 Lithuania
-
 Luxembourg
-
 Madagascar
-
 Malaysia
-
 Malta
Malta
-
 Mauritius
-
 Mexico
-
 Moldova
-
 Mongolia
-
 Montenegro
-
 Morocco
-
 Mozambique
-
 Myanmar
-
 Namibia
-
 Nepal
Nepal
-
 Netherlands
-
 New Zealand
-
 Nigeria
-
 North Macedonia
-
 Norway
-
 Oman
Oman
-
 Pakistan
-
 Palestine
-
 Panama
-
 Papua New Guinea
-
 Paraguay
-
 Peru
Peru
-
 Philippines
-
 Poland
-
 Portugal
-
 Puerto Rico
-
 Qatar
Qatar
-
 Reunion
-
 Romania
-
 Rwanda
-
 Saudi Arabia
-
 Serbia
-
 Singapore
-
 Slovakia
-
 Slovenia
-
 Somalia
-
 South Africa
-
 Spain
Spain
-
 Sri Lanka
-
 Sweden
-
 Switzerland
-
 Syria
Syria
-
 Taiwan
-
 Tajikistan
-
 Tanzania
-
 Thailand
-
 Trinidad and Tobago
-
 Tunisia
-
 Turkey
-
 UAE
UAE
-
 Uganda
-
 Ukraine
-
 United Kingdom
-
United States
-
 Uruguay
-
 Uzbekistan
-
 Venezuela
-
 Vietnam
-
 Yemen
Yemen
-
 Zambia
-
 Zimbabwe
- Forex
- Crypto











