

Sandbox gains more than 11% after strong technical drivers despite lack of fundamental news

Sandbox (SAND) surged 11.2% on strong upward momentum, as technical signals and upside volatility drew fresh buying interest in the absence of new fundamental catalysts. The rebound looks limited, with SAND still trading below its 200-day moving average and short-term oscillators at overbought extremes.
 0.0441
0.0476
Highlights
- SAND/USD trades above short- and medium-term moving averages but remains below the long-term threshold, indicating positive momentum within a broader bearish trend.
- Momentum indicators are split, with MACD showing strong selling pressure while RSI gives a buy signal, and overbought readings from oscillators call for caution.
- Expected five-day trading range is $0.0444 to $0.0506, with a 55% probability of a downward move and pivotal resistance at $0.0483.
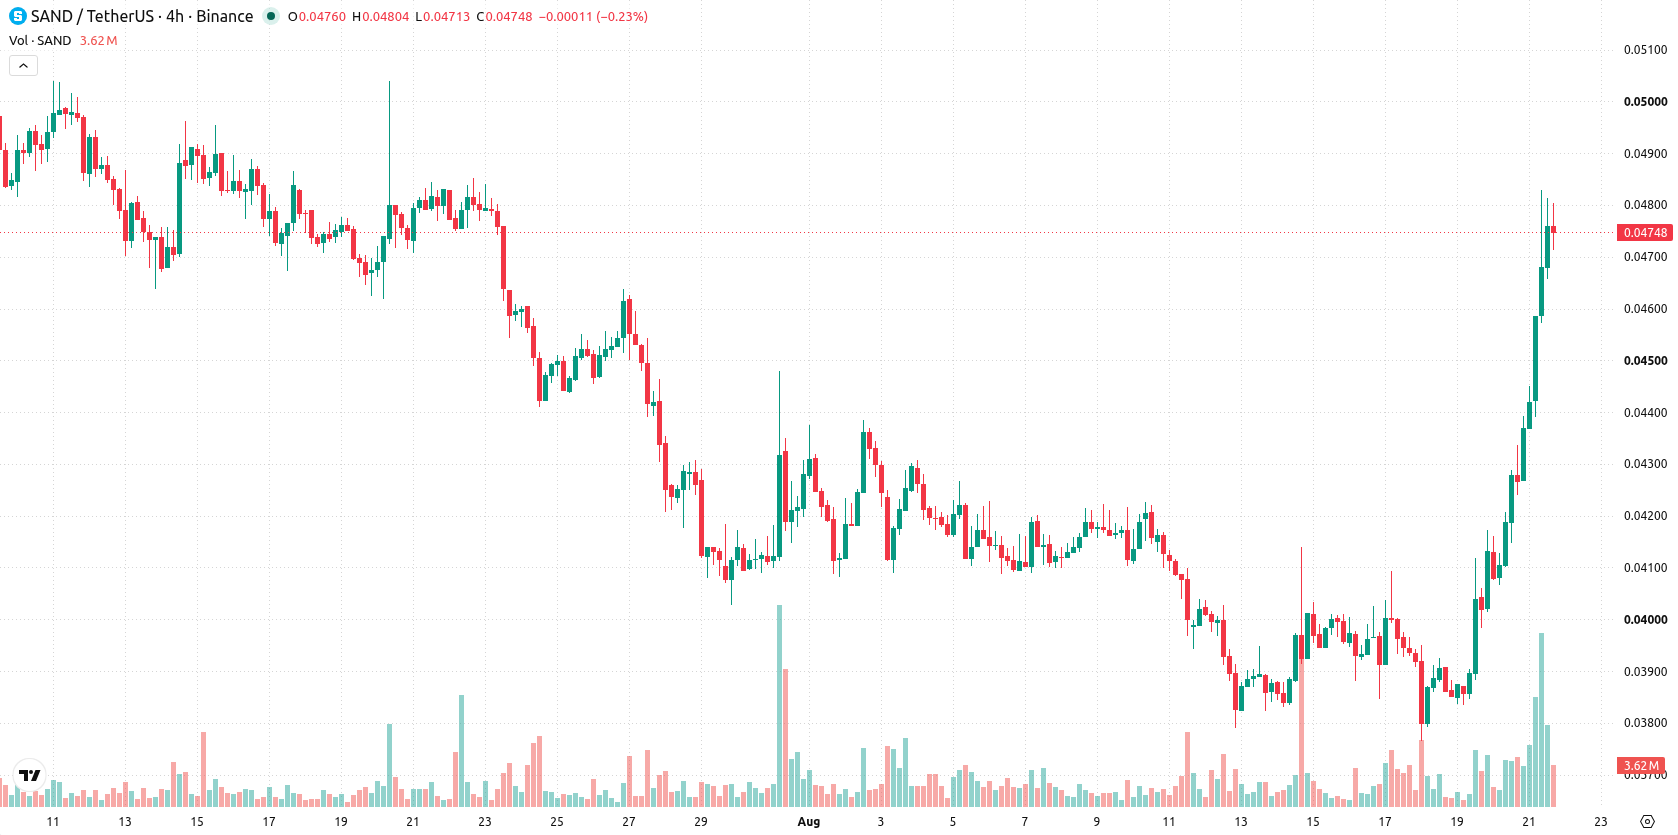
Mixed momentum as overbought technicals offset short-term gains
SAND/USD is positioned above its 20-day and 50-day moving averages, which stand at $0.0408 and $0.0446, respectively, while remaining below the 200-day average of $0.0667. This arrangement indicates positive momentum in the short and medium term, but the longer-term trend stays pressured by bearish dynamics. The nearest resistance level is $0.0483 and support lies at $0.0446. Daily momentum signals are mixed: MACD shows strong selling pressure, ADX is neutral, and RSI registers 56.12, indicating a buying signal. However, both the Stochastic RSI and CCI are at overbought extremes. BBP reflects buyers dominating short-term activity, though overbought warnings suggest caution, with the latest price near session highs after a notable price gap and double-digit gain.
Earlier, analysts noted that Sandbox showed signs of shifting from a bearish bias to a more neutral-to-bullish technical setup. The latest surge and mixed momentum indicators add a layer of short-term volatility, making the $0.0483 resistance and $0.0446 support the critical levels to watch for confirmation of the next directional move.






Latest Sandbox News



-
 Afghanistan
-
 Albania
-
 Algeria
-
 Angola
-
 Argentina
-
 Armenia
-
 Australia
-
 Austria
-
 Azerbaijan
-
 Bahamas
-
 Bahrain
-
 Bangladesh
-
 Belarus
-
 Belgium
-
 Bolivia
-
 Botswana
-
 Brazil
-
 Brunei
-
 Bulgaria
-
 Cambodia
-
 Cameroon
-
 Canada
-
 Chile
-
 China
-
 Colombia
-
 Congo
-
 Costa Rica
-
 Cote d'Ivoire
-
 Croatia
-
 Cuba
-
 Cyprus
-
 Czechia
-
 DR Congo
-
 Denmark
-
 Dominican Republic
-
 Ecuador
-
 Egypt
-
 El Salvador
-
 Estonia
-
 Eswatini
-
 Ethiopia
-
 Finland
-
 France
-
 Georgia
-
 Germany
-
 Ghana
-
 Greece
-
 Haiti
-
 Hong Kong
-
 Hungary
-
 India
-
 Indonesia
-
 Iran, Islamic republic
-
 Iraq
-
 Ireland
-
 Israel
-
 Italy
-
 Jamaica
-
 Japan
-
 Jordan
-
 Kazakhstan
-
 Kenya
-
 Korea
-
 Kuwait
-
 Kyrgyzstan
-
 Laos
-
 Latvia
-
 Lebanon
-
 Lesotho
-
 Libya
-
 Lithuania
-
 Luxembourg
-
 Madagascar
-
 Malaysia
-
 Malta
-
 Mauritius
-
 Mexico
-
 Moldova
-
 Mongolia
-
 Montenegro
-
 Morocco
-
 Mozambique
-
 Myanmar
-
 Namibia
-
 Nepal
-
 Netherlands
-
 New Zealand
-
 Nigeria
-
 North Macedonia
-
 Norway
-
 Oman
-
 Pakistan
-
 Palestine
-
 Panama
-
 Papua New Guinea
-
 Paraguay
-
 Peru
-
 Philippines
-
 Poland
-
 Portugal
-
 Puerto Rico
-
 Qatar
-
 Reunion
-
 Romania
-
 Rwanda
-
 Saudi Arabia
-
 Serbia
-
 Singapore
-
 Slovakia
-
 Slovenia
-
 Somalia
-
 South Africa
-
 Spain
-
 Sri Lanka
-
 Sweden
-
 Switzerland
-
 Syria
-
 Taiwan
-
 Tajikistan
-
 Tanzania
-
 Thailand
-
 Trinidad and Tobago
-
 Tunisia
-
 Turkey
-
 UAE
-
 Uganda
-
 Ukraine
-
 United Kingdom
-
United States
-
 Uruguay
-
 Uzbekistan
-
 Venezuela
-
 Vietnam
-
 Yemen
-
 Zambia
-
 Zimbabwe
- Forex
- Crypto












