

GRT rallies as price remains near session highs amid volatility

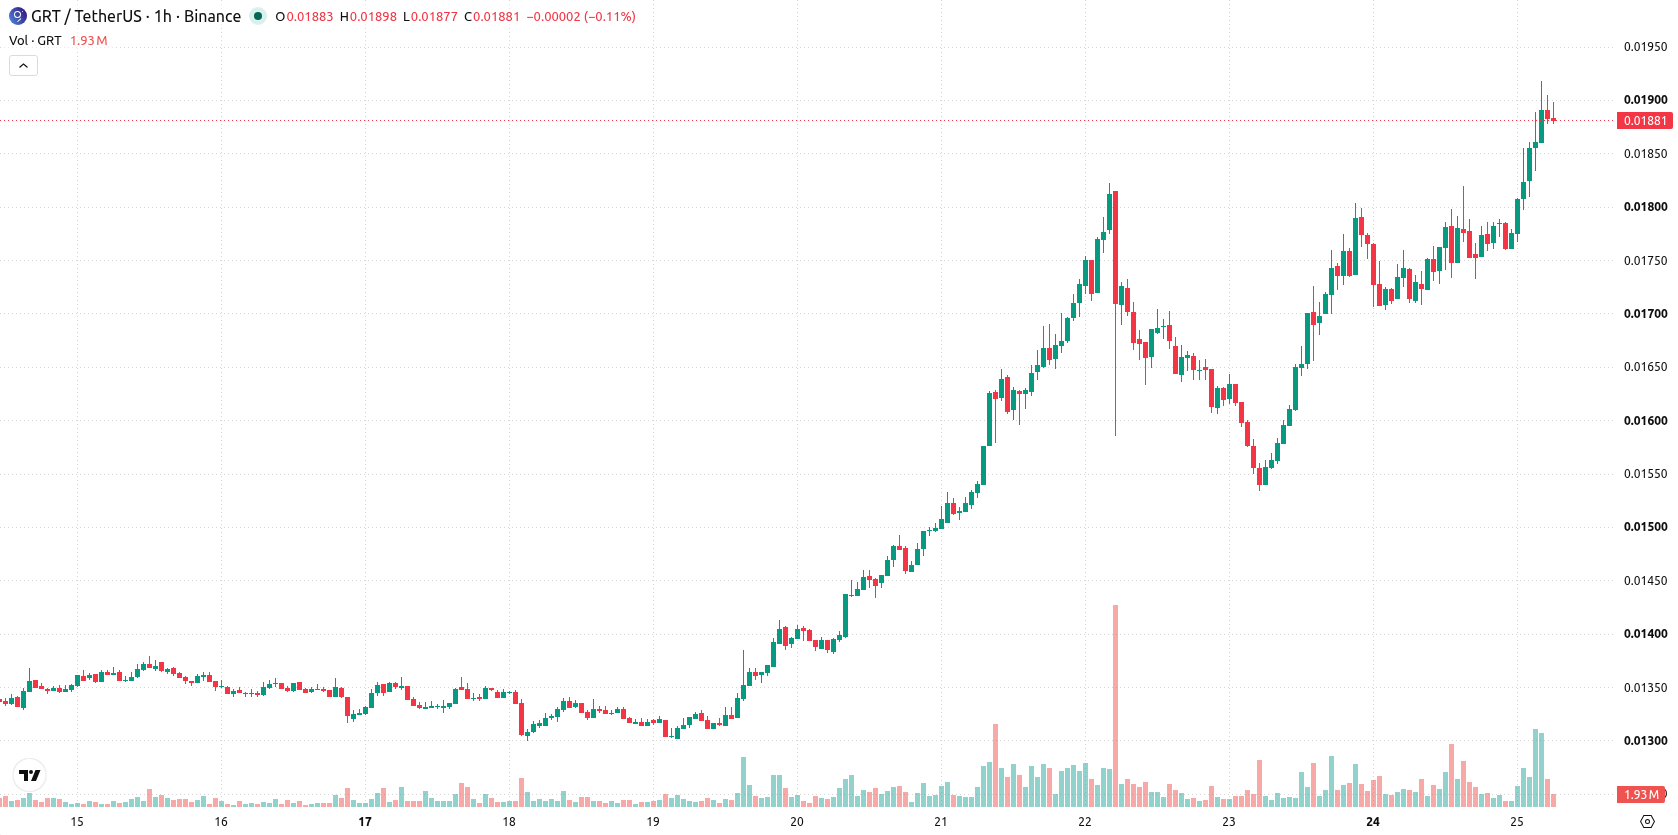
The Graph (GRT) is trading at $0.01891, marking an 8.87% increase over the last day. The asset is positioned above its key short- and medium-term moving averages but remains below longer-term trend markers.
 0.02385
0.02669000
Highlights
- GRT/USD is trading above short- and medium-term moving averages, showing a bullish structure yet remaining below long-term resistance.
- Momentum indicators are strong and in buy mode, but overbought signals suggest increased risk of a late-cycle reversal.
- Expected price range for the next 2 to 3 trading days is $0.01774724 to $0.02007276, with 79% probability of further upward movement.
Overbought momentum heightens risk as bulls sustain upside
On the technical side, price remains above the MA-20 and MA-50 on the working timeframe while staying below the daily MA-200, with immediate support at the Ichimoku Kijun level of $0.01813. Momentum readings reinforce the uptrend: MACD and ADX both reflect Buy mode, RSI registers 72.42, and both Stochastic RSI and CCI show overbought conditions. Bull/Bear Power signals intraday buyer control, while the Awesome Oscillator confirms direction. The session has been volatile with price maintaining proximity to intraday highs, though overbought oscillators point to potential late-stage risk even as bulls dominate.
Consolidation likely as resistance and support define path
Looking ahead over the next two to three trading days, GRT is expected to fluctuate within a volatility band of $0.01774724 to $0.02007276. There is a 79% likelihood of continued upward movement, while the chance of a pullback is estimated at 21%. Baseline expectations call for consolidation within the current corridor, but a move above resistance could trigger a bullish breakout, whereas a fall below support at $0.01813 may open the door to a short-term retracement.
Earlier, analysts noted that The Graph was demonstrating short-term bullish momentum but remained challenged by lingering longer-term resistance. The latest technical picture reinforces and extends this view, with a sustained uptrend now facing potential overbought risks—making price action around the $0.01813 support a key focal point for traders assessing near-term upside or possible retracement.










-
 Afghanistan
-
 Albania
-
 Algeria
-
 Angola
-
 Argentina
-
 Armenia
-
 Australia
-
 Austria
-
 Azerbaijan
-
 Bahamas
-
 Bahrain
-
 Bangladesh
-
 Belarus
-
 Belgium
-
 Bolivia
-
 Botswana
-
 Brazil
-
 Brunei
-
 Bulgaria
-
 Cambodia
-
 Cameroon
-
 Canada
-
 Chile
-
 China
-
 Colombia
-
 Congo
-
 Costa Rica
-
 Cote d'Ivoire
-
 Croatia
-
 Cuba
-
 Cyprus
-
 Czechia
-
 DR Congo
-
 Denmark
-
 Dominican Republic
-
 Ecuador
-
 Egypt
-
 El Salvador
-
 Estonia
-
 Eswatini
-
 Ethiopia
-
 Finland
-
 France
-
 Georgia
-
 Germany
-
 Ghana
-
 Greece
-
 Haiti
-
 Hong Kong
-
 Hungary
-
 India
-
 Indonesia
-
 Iran, Islamic republic
-
 Iraq
-
 Ireland
-
 Israel
-
 Italy
-
 Jamaica
-
 Japan
-
 Jordan
-
 Kazakhstan
-
 Kenya
-
 Korea
-
 Kuwait
-
 Kyrgyzstan
-
 Laos
-
 Latvia
-
 Lebanon
-
 Lesotho
-
 Libya
-
 Lithuania
-
 Luxembourg
-
 Madagascar
-
 Malaysia
-
 Malta
-
 Mauritius
-
 Mexico
-
 Moldova
-
 Mongolia
-
 Montenegro
-
 Morocco
-
 Mozambique
-
 Myanmar
-
 Namibia
-
 Nepal
-
 Netherlands
-
 New Zealand
-
 Nigeria
-
 North Macedonia
-
 Norway
-
 Oman
-
 Pakistan
-
 Palestine
-
 Panama
-
 Papua New Guinea
-
 Paraguay
-
 Peru
-
 Philippines
-
 Poland
-
 Portugal
-
 Puerto Rico
-
 Qatar
-
 Reunion
-
 Romania
-
 Rwanda
-
 Saudi Arabia
-
 Serbia
-
 Singapore
-
 Slovakia
-
 Slovenia
-
 Somalia
-
 South Africa
-
 Spain
-
 Sri Lanka
-
 Sweden
-
 Switzerland
-
 Syria
-
 Taiwan
-
 Tajikistan
-
 Tanzania
-
 Thailand
-
 Trinidad and Tobago
-
 Tunisia
-
 Turkey
-
 UAE
-
 Uganda
-
 Ukraine
-
 United Kingdom
-
United States
-
 Uruguay
-
 Uzbekistan
-
 Venezuela
-
 Vietnam
-
 Yemen
-
 Zambia
-
 Zimbabwe
- Forex
- Crypto












