

Stellar price drops ahead of Protocol 28 vote: Can XLM hold $0.1746?

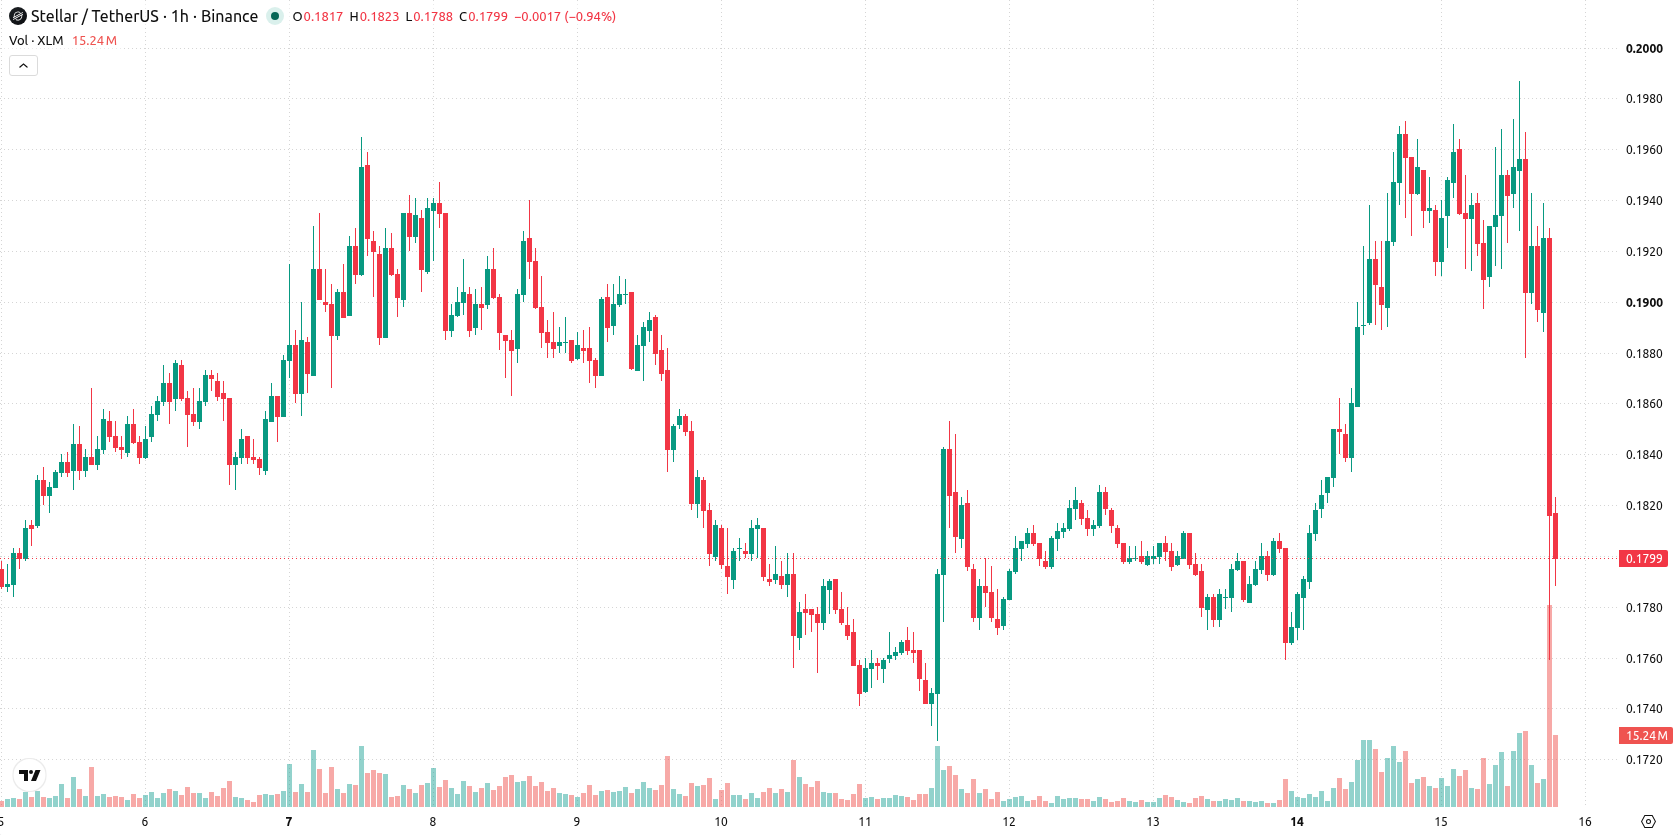
Stellar (XLM) is trading at $0.1801 after a 7.07% daily decline. The asset currently sits below its short- and medium-term moving averages amid heightened trading volatility.
 0.1488
0.1711
Highlights
- Nuvanté Technologies completed a stablecoin clearing prototype on the Stellar network, linking it to the Bank of England's RTGS test environment for central bank settlement flows.
- U.S. Bank achieved a cross-border transfer of its USBDC stablecoin using Stellar's public blockchain, retaining banking compliance between North America and Europe.
- XLM/USD trades below key short- and medium-term moving averages with selling pressure dominant, an expected range of $0.1746 to $0.1856, and a high probability of further downside in the next 2 to 3 days.
Institutional settlement tests and upgrade plans amid persistent sell pressure
Nuvanté Technologies completed a stablecoin clearing prototype on the Stellar network, integrating it with the Bank of England’s RTGS test environment and demonstrating settlement flows with central bank infrastructure, as reported by Coinpedia. This was accompanied by U.S. Bank’s successful cross-border transfer of its USBDC stablecoin between North America and Europe using Stellar’s public blockchain while retaining banking compliance standards, according to Kucoin. The network is also facing a Protocol 28 mainnet upgrade vote scheduled for September 16 that will address contract enhancements and network performance, as noted by Coinpedia. These developments highlight institutional experimentation and technical evolution on the Stellar platform, though price action has remained under broader selling pressure.
Diverging technical signals as xlm tests resistance and mixed momentum
On the technical front, XLM/USD is trading below the MA-20 at $0.1931 and MA-50 at $0.1889 on the hourly chart, while holding above the daily MA-200 at $0.1757. The Ichimoku Kijun at $0.1932 stands as immediate resistance. Momentum indicators show conflicting signals: MACD registers a strong buy and ADX suggests buyers are still active, yet RSI issues a sell and CCI supports further downside. Stochastic RSI is oversold, Bull/Bear Power shows some buyer activity, but the Awesome Oscillator signals ongoing selling pressure in line with today’s drop.
Downside bias persists as near-term range signals pressured outlook
Looking to the next 2–3 days, XLM is expected to trade within a range of $0.1746 to $0.1856, reflecting typical volatility around current levels. There is a 25% probability of an upward move, with the downside scenario more likely as near-term momentum remains pressured. If the price remains in this corridor, it would signal near-term stabilization, while a break above $0.1932 could open the door to further gains. Conversely, sustained movement below $0.1746 may accelerate selling pressure and deepen the decline.
Earlier, analysts noted that Stellar's uptrend was supported by institutional adoption and network partnerships, although momentum indicators gave mixed signals. The current decline below major moving averages and heightened volatility mark a notable shift, making $0.1746 a critical support level to monitor for potential downside acceleration in the near term.










-
 Afghanistan
-
 Albania
-
 Algeria
-
 Angola
-
 Argentina
-
 Armenia
-
 Australia
-
 Austria
-
 Azerbaijan
-
 Bahamas
-
 Bahrain
-
 Bangladesh
-
 Belarus
-
 Belgium
-
 Bolivia
-
 Botswana
-
 Brazil
-
 Brunei
-
 Bulgaria
-
 Cambodia
-
 Cameroon
-
 Canada
-
 Chile
-
 China
-
 Colombia
-
 Congo
-
 Costa Rica
-
 Cote d'Ivoire
-
 Croatia
-
 Cuba
-
 Cyprus
-
 Czechia
-
 DR Congo
-
 Denmark
-
 Dominican Republic
-
 Ecuador
-
 Egypt
-
 El Salvador
-
 Estonia
-
 Eswatini
-
 Ethiopia
-
 Finland
-
 France
-
 Georgia
-
 Germany
-
 Ghana
-
 Greece
-
 Haiti
-
 Hong Kong
-
 Hungary
-
 India
-
 Indonesia
-
 Iran, Islamic republic
-
 Iraq
-
 Ireland
-
 Israel
-
 Italy
-
 Jamaica
-
 Japan
-
 Jordan
-
 Kazakhstan
-
 Kenya
-
 Korea
-
 Kuwait
-
 Kyrgyzstan
-
 Laos
-
 Latvia
-
 Lebanon
-
 Lesotho
-
 Libya
-
 Lithuania
-
 Luxembourg
-
 Madagascar
-
 Malaysia
-
 Malta
-
 Mauritius
-
 Mexico
-
 Moldova
-
 Mongolia
-
 Montenegro
-
 Morocco
-
 Mozambique
-
 Myanmar
-
 Namibia
-
 Nepal
-
 Netherlands
-
 New Zealand
-
 Nigeria
-
 North Macedonia
-
 Norway
-
 Oman
-
 Pakistan
-
 Palestine
-
 Panama
-
 Papua New Guinea
-
 Paraguay
-
 Peru
-
 Philippines
-
 Poland
-
 Portugal
-
 Puerto Rico
-
 Qatar
-
 Reunion
-
 Romania
-
 Rwanda
-
 Saudi Arabia
-
 Serbia
-
 Singapore
-
 Slovakia
-
 Slovenia
-
 Somalia
-
 South Africa
-
 Spain
-
 Sri Lanka
-
 Sweden
-
 Switzerland
-
 Syria
-
 Taiwan
-
 Tajikistan
-
 Tanzania
-
 Thailand
-
 Trinidad and Tobago
-
 Tunisia
-
 Turkey
-
 UAE
-
 Uganda
-
 Ukraine
-
 United Kingdom
-
United States
-
 Uruguay
-
 Uzbekistan
-
 Venezuela
-
 Vietnam
-
 Yemen
-
 Zambia
-
 Zimbabwe
- Forex
- Crypto












