

FLOW slides more than 10% as downside gap increases selling momentum

Flow (FLOW) dropped 10.22% amid strong selling pressure and an absence of fresh catalysts. The selloff is supported by the loss of short-term support, with prices remaining below the longstanding MA-200 resistance despite some technical momentum indicators pointing to underlying bullish potential.
 0.0209
0.0233
Highlights
- FLOW/USD trades above short- and medium-term moving averages but remains below the long-term moving average, reflecting near-term strength with ongoing upward resistance.
- Buyers control intraday momentum with multiple indicators showing bullish signals, although trend strength is still weak and the asset is overbought by some technical measures.
- Over the next five trading days, FLOW/USD is expected to consolidate between $0.0276 and $0.037 with a 67% probability of upward movement.
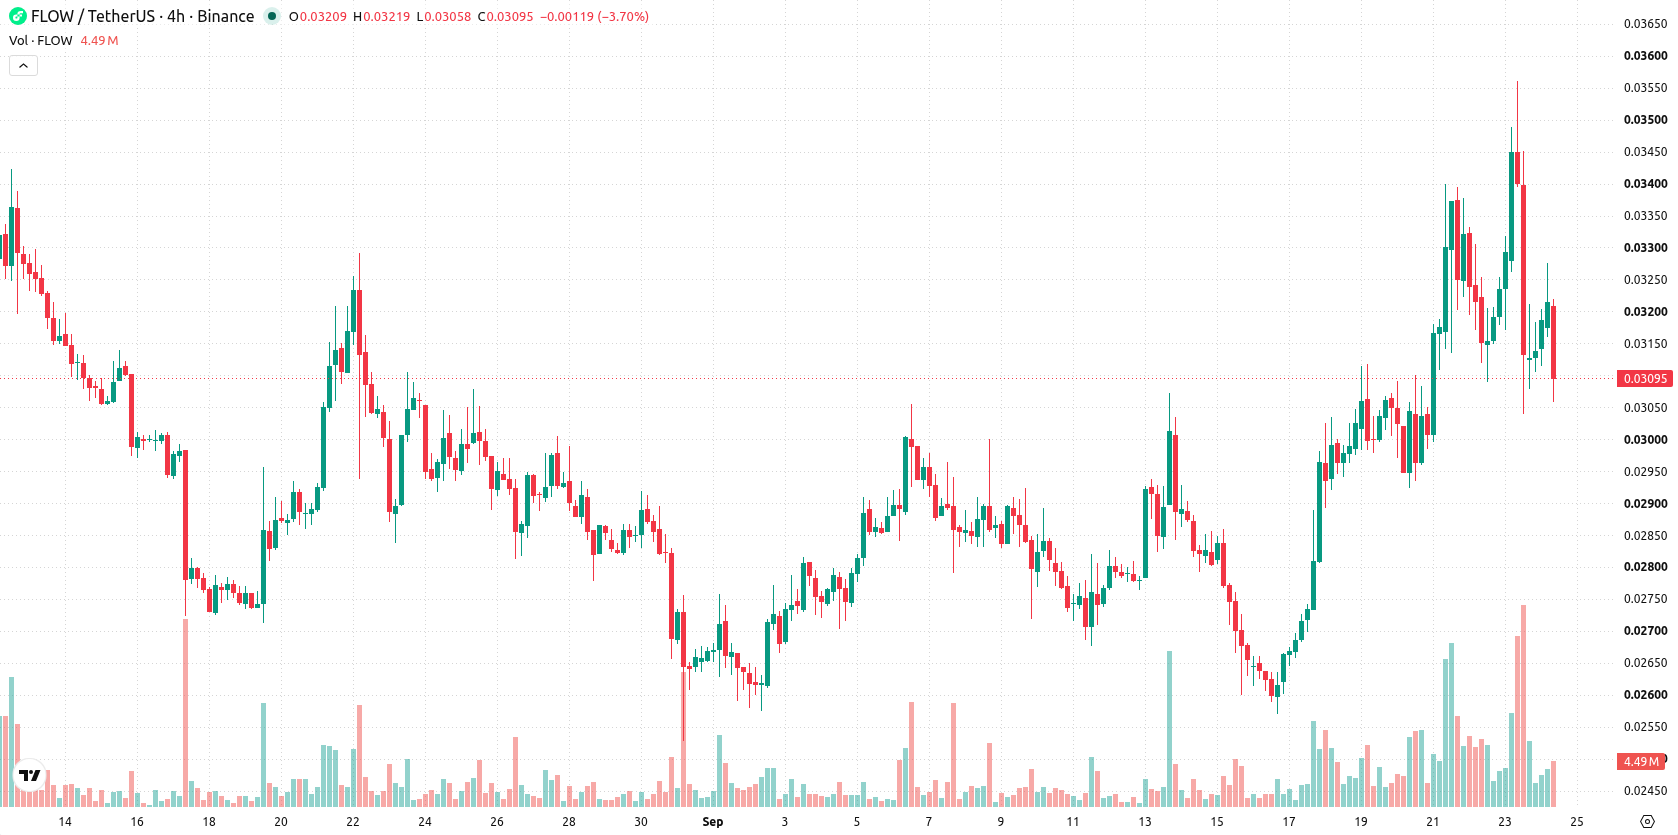
Bullish intraday signals as price nears key resistance
FLOW/USD is trading above both the MA-20 ($0.0291) and MA-50 ($0.0291), but sits below the MA-200 ($0.0318), indicating strength in the short and medium-term timeframe but lingering longer-term resistance. Immediate upside is capped at $0.031, while near-term support is established by the Ichimoku Kijun at $0.0304. Momentum indicators provide mixed signals: MACD and Awesome Oscillator point to potential additional gains, but the ADX remains neutral, reflecting weak trend strength. The RSI and Bull/Bear Power both favor buyers intraday, whereas the Commodity Channel Index signals overbought conditions, and the Stochastic RSI is neutral. FLOW/USD is currently trading near session lows with volatility at 5.81%, and price action pressured after a significant downside gap.
Earlier, analysts noted that FLOW was experiencing mixed technical signals and uncertainty around the sustainability of its trend. The latest movement not only reinforces this indecision but also emphasizes the importance of the $0.031 resistance as a pivotal level for determining short-term direction.










-
 Afghanistan
-
 Albania
-
 Algeria
-
 Angola
-
 Argentina
-
 Armenia
-
 Australia
-
 Austria
-
 Azerbaijan
-
 Bahamas
-
 Bahrain
-
 Bangladesh
-
 Belarus
-
 Belgium
-
 Bolivia
-
 Botswana
-
 Brazil
-
 Brunei
-
 Bulgaria
-
 Cambodia
-
 Cameroon
-
 Canada
-
 Chile
-
 China
-
 Colombia
-
 Congo
-
 Costa Rica
-
 Cote d'Ivoire
-
 Croatia
-
 Cuba
-
 Cyprus
-
 Czechia
-
 DR Congo
-
 Denmark
-
 Dominican Republic
-
 Ecuador
-
 Egypt
-
 El Salvador
-
 Estonia
-
 Eswatini
-
 Ethiopia
-
 Finland
-
 France
-
 Georgia
-
 Germany
-
 Ghana
-
 Greece
-
 Haiti
-
 Hong Kong
-
 Hungary
-
 India
-
 Indonesia
-
 Iran, Islamic republic
-
 Iraq
-
 Ireland
-
 Israel
-
 Italy
-
 Jamaica
-
 Japan
-
 Jordan
-
 Kazakhstan
-
 Kenya
-
 Korea
-
 Kuwait
-
 Kyrgyzstan
-
 Laos
-
 Latvia
-
 Lebanon
-
 Lesotho
-
 Libya
-
 Lithuania
-
 Luxembourg
-
 Madagascar
-
 Malaysia
-
 Malta
-
 Mauritius
-
 Mexico
-
 Moldova
-
 Mongolia
-
 Montenegro
-
 Morocco
-
 Mozambique
-
 Myanmar
-
 Namibia
-
 Nepal
-
 Netherlands
-
 New Zealand
-
 Nigeria
-
 North Macedonia
-
 Norway
-
 Oman
-
 Pakistan
-
 Palestine
-
 Panama
-
 Papua New Guinea
-
 Paraguay
-
 Peru
-
 Philippines
-
 Poland
-
 Portugal
-
 Puerto Rico
-
 Qatar
-
 Reunion
-
 Romania
-
 Rwanda
-
 Saudi Arabia
-
 Serbia
-
 Singapore
-
 Slovakia
-
 Slovenia
-
 Somalia
-
 South Africa
-
 Spain
-
 Sri Lanka
-
 Sweden
-
 Switzerland
-
 Syria
-
 Taiwan
-
 Tajikistan
-
 Tanzania
-
 Thailand
-
 Trinidad and Tobago
-
 Tunisia
-
 Turkey
-
 UAE
-
 Uganda
-
 Ukraine
-
 United Kingdom
-
United States
-
 Uruguay
-
 Uzbekistan
-
 Venezuela
-
 Vietnam
-
 Yemen
-
 Zambia
-
 Zimbabwe
- Forex
- Crypto












