

Movement drops as sellers dominate and price trends lower below resistance

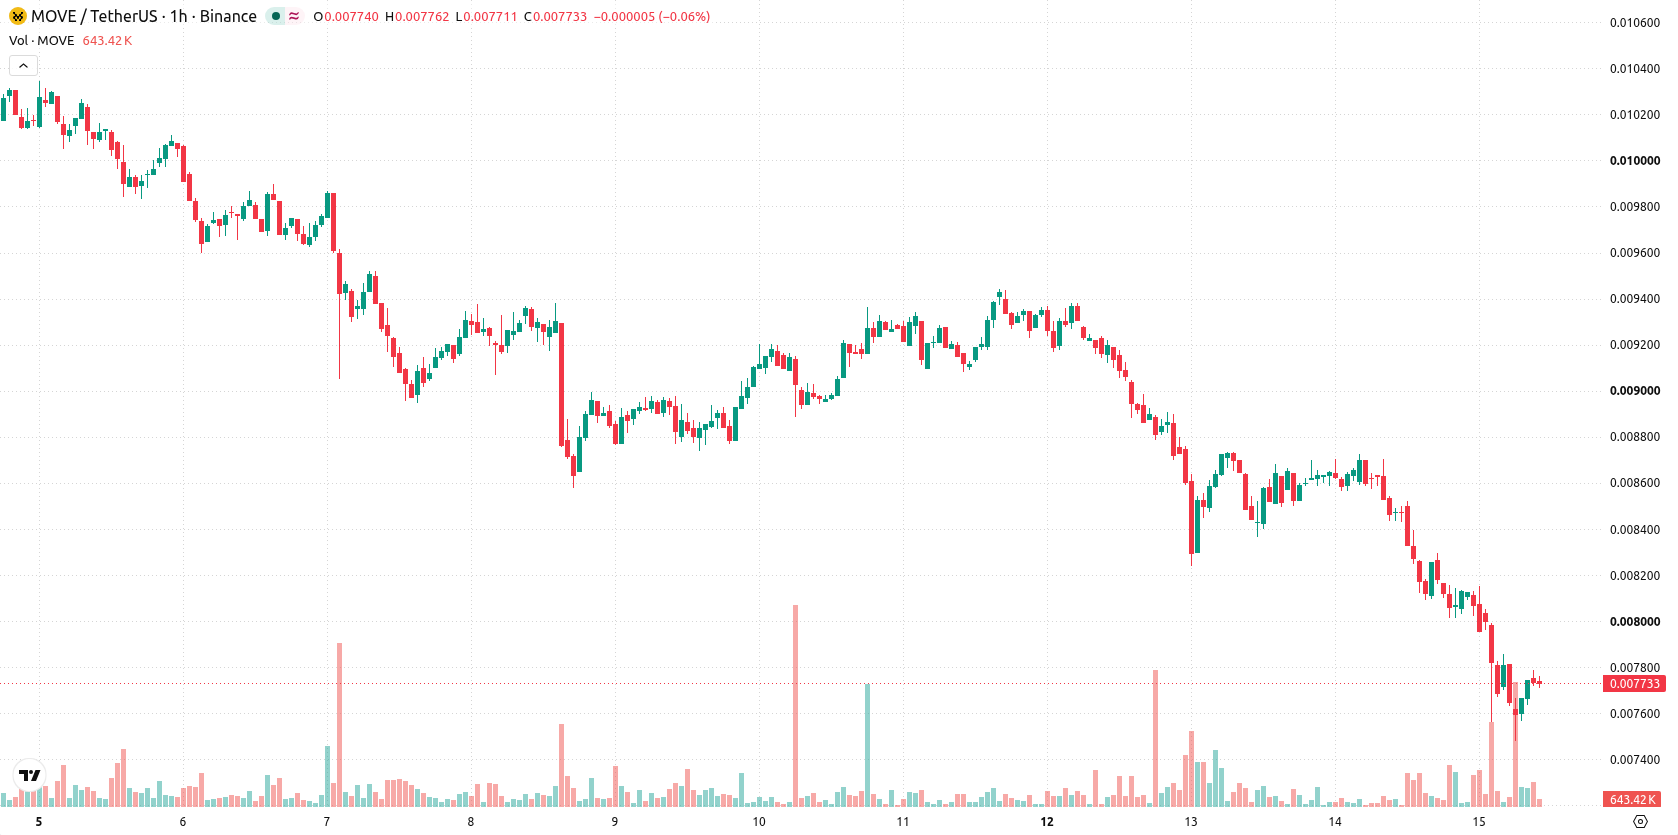
Movement (MOVE) is trading at $0.0077 after a decline of 8.76% on the day, marking one of the steepest daily moves among digital assets. The price is positioned below its key moving averages, indicating the asset remains under pressure against short- and medium-term trend levels.
 0.0076
0.008736
Highlights
- MOVE/USD trades below key moving averages on both intraday and daily charts, confirming a persistent bearish structure.
- Momentum indicators including MACD, ADX, and RSI all show strong seller dominance with further weakness likely in the short term.
- Expected trading range for MOVE/USD over the next 2 to 3 days is $0.0074 to $0.008, with a very high probability of further downside.
Consistent seller momentum as technical barriers limit rebound
On the H1 chart, MOVE/USD is trading below the MA-20 at $0.008 and MA-50 at $0.0083. On the daily chart, the price remains under the MA-200 at $0.0122, while the Ichimoku Kijun sits at $0.0081 as immediate resistance. Momentum indicators are negative: MACD, ADX, RSI, CCI, and Bull/Bear Power all show strong sell signals, highlighting clear seller dominance. Stochastic RSI, however, signals a short-term overbought reading, suggesting a possible pause or minor relief. The Awesome Oscillator remains neutral.
Downside risk elevated as consolidation signals persist
In the short term, MOVE is likely to consolidate within a volatility band between $0.0074 and $0.008 over the next two to three trading days. The probability of an upward move is described as very low, while the likelihood of further downside is very high. The base scenario is for sideways price action within this corridor; a bullish scenario would require a breakout above $0.0081, and a bearish scenario could emerge if support at $0.0074 fails, potentially triggering further losses.
Earlier, analysts noted that Movement faced persistent downside pressure, with technical factors indicating an elevated risk of further weakness. The current price action not only confirms this ongoing bearish trend but also brings attention to $0.0074 as a critical support level that traders should monitor for potential breakdown risk.





Latest Movement News




-
 Afghanistan
-
 Albania
-
 Algeria
-
 Angola
-
 Argentina
-
 Armenia
-
 Australia
-
 Austria
-
 Azerbaijan
-
 Bahamas
-
 Bahrain
-
 Bangladesh
-
 Belarus
-
 Belgium
-
 Bolivia
-
 Botswana
-
 Brazil
-
 Brunei
-
 Bulgaria
-
 Cambodia
-
 Cameroon
-
 Canada
-
 Chile
-
 China
-
 Colombia
-
 Congo
-
 Costa Rica
-
 Cote d'Ivoire
-
 Croatia
-
 Cuba
-
 Cyprus
-
 Czechia
-
 DR Congo
-
 Denmark
-
 Dominican Republic
-
 Ecuador
-
 Egypt
-
 El Salvador
-
 Estonia
-
 Eswatini
-
 Ethiopia
-
 Finland
-
 France
-
 Georgia
-
 Germany
-
 Ghana
-
 Greece
-
 Haiti
-
 Hong Kong
-
 Hungary
-
 India
-
 Indonesia
-
 Iran, Islamic republic
-
 Iraq
-
 Ireland
-
 Israel
-
 Italy
-
 Jamaica
-
 Japan
-
 Jordan
-
 Kazakhstan
-
 Kenya
-
 Korea
-
 Kuwait
-
 Kyrgyzstan
-
 Laos
-
 Latvia
-
 Lebanon
-
 Lesotho
-
 Libya
-
 Lithuania
-
 Luxembourg
-
 Madagascar
-
 Malaysia
-
 Malta
-
 Mauritius
-
 Mexico
-
 Moldova
-
 Mongolia
-
 Montenegro
-
 Morocco
-
 Mozambique
-
 Myanmar
-
 Namibia
-
 Nepal
-
 Netherlands
-
 New Zealand
-
 Nigeria
-
 North Macedonia
-
 Norway
-
 Oman
-
 Pakistan
-
 Palestine
-
 Panama
-
 Papua New Guinea
-
 Paraguay
-
 Peru
-
 Philippines
-
 Poland
-
 Portugal
-
 Puerto Rico
-
 Qatar
-
 Reunion
-
 Romania
-
 Rwanda
-
 Saudi Arabia
-
 Serbia
-
 Singapore
-
 Slovakia
-
 Slovenia
-
 Somalia
-
 South Africa
-
 Spain
-
 Sri Lanka
-
 Sweden
-
 Switzerland
-
 Syria
-
 Taiwan
-
 Tajikistan
-
 Tanzania
-
 Thailand
-
 Trinidad and Tobago
-
 Tunisia
-
 Turkey
-
 UAE
-
 Uganda
-
 Ukraine
-
 United Kingdom
-
United States
-
 Uruguay
-
 Uzbekistan
-
 Venezuela
-
 Vietnam
-
 Yemen
-
 Zambia
-
 Zimbabwe
- Forex
- Crypto












