

Curve hovers below key resistance with technicals signaling seller control: weekly analysis

Curve (CRV) has dropped to around $0.34 after a nearly 6% slide this week, with technical signals showing the asset stretched into oversold territory. Decisive selling has been reinforced by accelerating on-chain developments, but conflicting momentum readings leave the near-term direction uncertain. Traders will be watching whether oversold conditions are enough to draw out buyers or if bearish momentum persists into the next week.
 0.2683
0.2822
Highlights
- Curve fell 6.26% over the past week to $0.3407, currently below key short-term moving averages but above the 200-day level.
- Technical indicators show seller control with flat trend, elevated volatility at 20.43%, and oscillators near oversold territory.
- Curve is expected to consolidate between $0.307 and $0.3743 over the next 7 days, with 65% probability of a further decrease.
LlamaLend v2 rollout and new collateral options reshape Curve’s DeFi outlook
Curve Finance made headlines this week by implementing major updates to its DeFi lending protocol, most notably the rollout of LlamaLend v2, which allows lending pairs that do not require crvUSD as either collateral or the borrowed asset, according to crypto.news. The new system supports Curve liquidity provider tokens as collateral, giving users the ability to maintain pool positions and continue earning trading fees while borrowing, as reported by TokenPost. Hokanews also highlighted that Curve disclosed yields of 9.1% for USG stablecoins and 4.2% for crvUSD lending, spotlighting fresh income opportunities for Ethereum-based users.
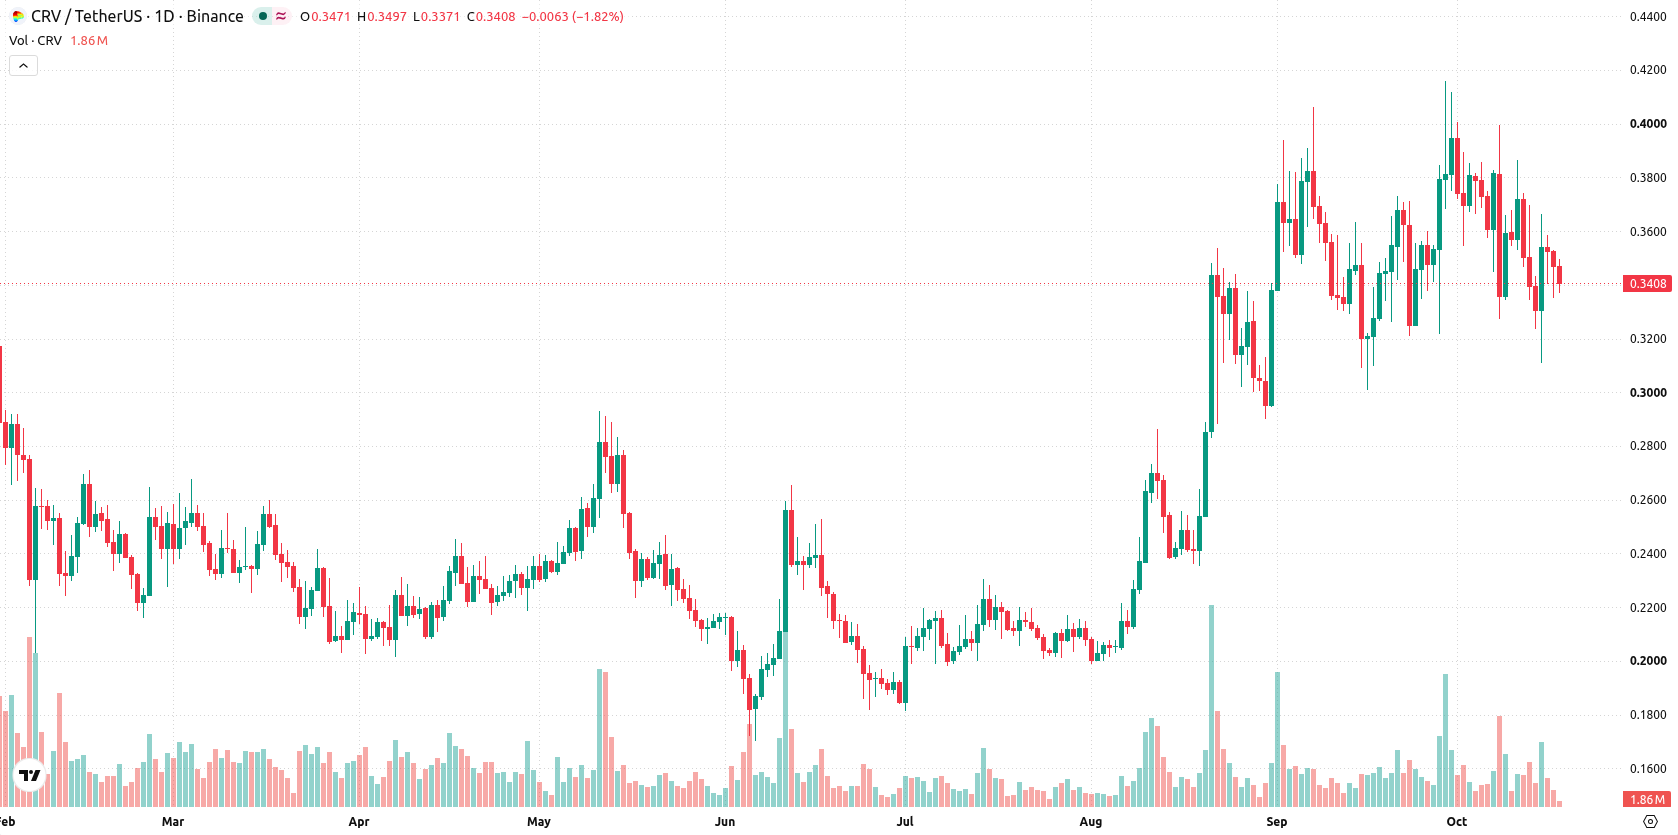
Bearish signals strengthen as volatility surges and oscillators highlight seller control
The daily setup shows a flat trend with a sharp move lower without a sustained trend, as volatility jumped to 20.43%. The RSI is neutral at 48.1912, while the CCI is approaching oversold, hinting at recent selling pressure. Both Bull/Bear Power and the Awesome Oscillator point to seller dominance, enhancing the near-term bearish case. Immediate support stands at $0.3108, with resistance at $0.3536 and the Ichimoku Kijun at $0.3634 acting as another resistance mark.
Consolidation bias persists as downside risk outweighs upside for the week ahead
Over the next 7 days, Curve is expected to trade between $0.307 and $0.3743. The probability of an increase is 35%, while the likelihood of a decrease stands at 65%. The base case is continued consolidation between identified support and resistance as momentum remains bearish. A move above $0.3536 could see a push towards the top of the expected range, while a break below $0.3108 would raise the risk of further downside.
Earlier, analysts noted that Curve’s surge was underpinned by strong loan activity and institutional risk upgrades, but flagged the potential for near-term turbulence given mixed technical signals. With the latest pullback and deepening oversold conditions, traders should watch for signs of reversal or a confirmed breakdown below $0.3108 as the next catalyst for directional momentum.









-
 Afghanistan
-
 Albania
-
 Algeria
-
 Angola
-
 Argentina
-
 Armenia
-
 Australia
-
 Austria
-
 Azerbaijan
-
 Bahamas
-
 Bahrain
-
 Bangladesh
-
 Belarus
-
 Belgium
-
 Bolivia
-
 Botswana
-
 Brazil
-
 Brunei
-
 Bulgaria
-
 Cambodia
-
 Cameroon
-
 Canada
-
 Chile
-
 China
-
 Colombia
-
 Congo
-
 Costa Rica
-
 Cote d'Ivoire
-
 Croatia
-
 Cuba
-
 Cyprus
-
 Czechia
-
 DR Congo
-
 Denmark
-
 Dominican Republic
-
 Ecuador
-
 Egypt
-
 El Salvador
-
 Estonia
-
 Eswatini
-
 Ethiopia
-
 Finland
-
 France
-
 Georgia
-
 Germany
-
 Ghana
-
 Greece
-
 Haiti
-
 Hong Kong
-
 Hungary
-
 India
-
 Indonesia
-
 Iran, Islamic republic
-
 Iraq
-
 Ireland
-
 Israel
-
 Italy
-
 Jamaica
-
 Japan
-
 Jordan
-
 Kazakhstan
-
 Kenya
-
 Korea
-
 Kuwait
-
 Kyrgyzstan
-
 Laos
-
 Latvia
-
 Lebanon
-
 Lesotho
-
 Libya
-
 Lithuania
-
 Luxembourg
-
 Madagascar
-
 Malaysia
-
 Malta
-
 Mauritius
-
 Mexico
-
 Moldova
-
 Mongolia
-
 Montenegro
-
 Morocco
-
 Mozambique
-
 Myanmar
-
 Namibia
-
 Nepal
-
 Netherlands
-
 New Zealand
-
 Nigeria
-
 North Macedonia
-
 Norway
-
 Oman
-
 Pakistan
-
 Palestine
-
 Panama
-
 Papua New Guinea
-
 Paraguay
-
 Peru
-
 Philippines
-
 Poland
-
 Portugal
-
 Puerto Rico
-
 Qatar
-
 Reunion
-
 Romania
-
 Rwanda
-
 Saudi Arabia
-
 Serbia
-
 Singapore
-
 Slovakia
-
 Slovenia
-
 Somalia
-
 South Africa
-
 Spain
-
 Sri Lanka
-
 Sweden
-
 Switzerland
-
 Syria
-
 Taiwan
-
 Tajikistan
-
 Tanzania
-
 Thailand
-
 Trinidad and Tobago
-
 Tunisia
-
 Turkey
-
 UAE
-
 Uganda
-
 Ukraine
-
 United Kingdom
-
United States
-
 Uruguay
-
 Uzbekistan
-
 Venezuela
-
 Vietnam
-
 Yemen
-
 Zambia
-
 Zimbabwe
- Forex
- Crypto












