

Quant support comes into focus after a stretched decline: weekly analysis

Quant (QNT) is trading near $200 after tumbling around 16% over the past week, with a sharp selloff leaving the token in deeply oversold territory. Momentum remains weak, though rapidly stretched signals and a cluster of support levels are attracting attention from traders watching for signs of stabilization or a technical bounce in the days ahead.
 204.7
231.670000
Highlights
- Quant declined 16.06% in the past 7 days to $199.55, entering a corrective phase within a longer-term upward structure.
- Price is actively bearish and trades below its 20-day moving average, but remains above key longer-term trend supports.
- Momentum readings show oversold signals with expected consolidation between $181.74 and $221.2; 7-day range forecast is $173.13 to $239.46 with 64% probability toward the upside.
Infrastructure partnerships bolster sentiment despite delayed network launch
Quant has been selected to provide the interoperability and orchestration layer for the Clearing House's On-Chain Money Initiative, a regulated network for tokenized bank deposits, according to Tickeron. While the network itself is not slated to accept participants until at least the first half of 2027, this institutional partnership signals ongoing infrastructure development. Quant's Fusion Rollup, which connects 74 blockchain networks within a single mainnet environment, has also been operating since June 2026.
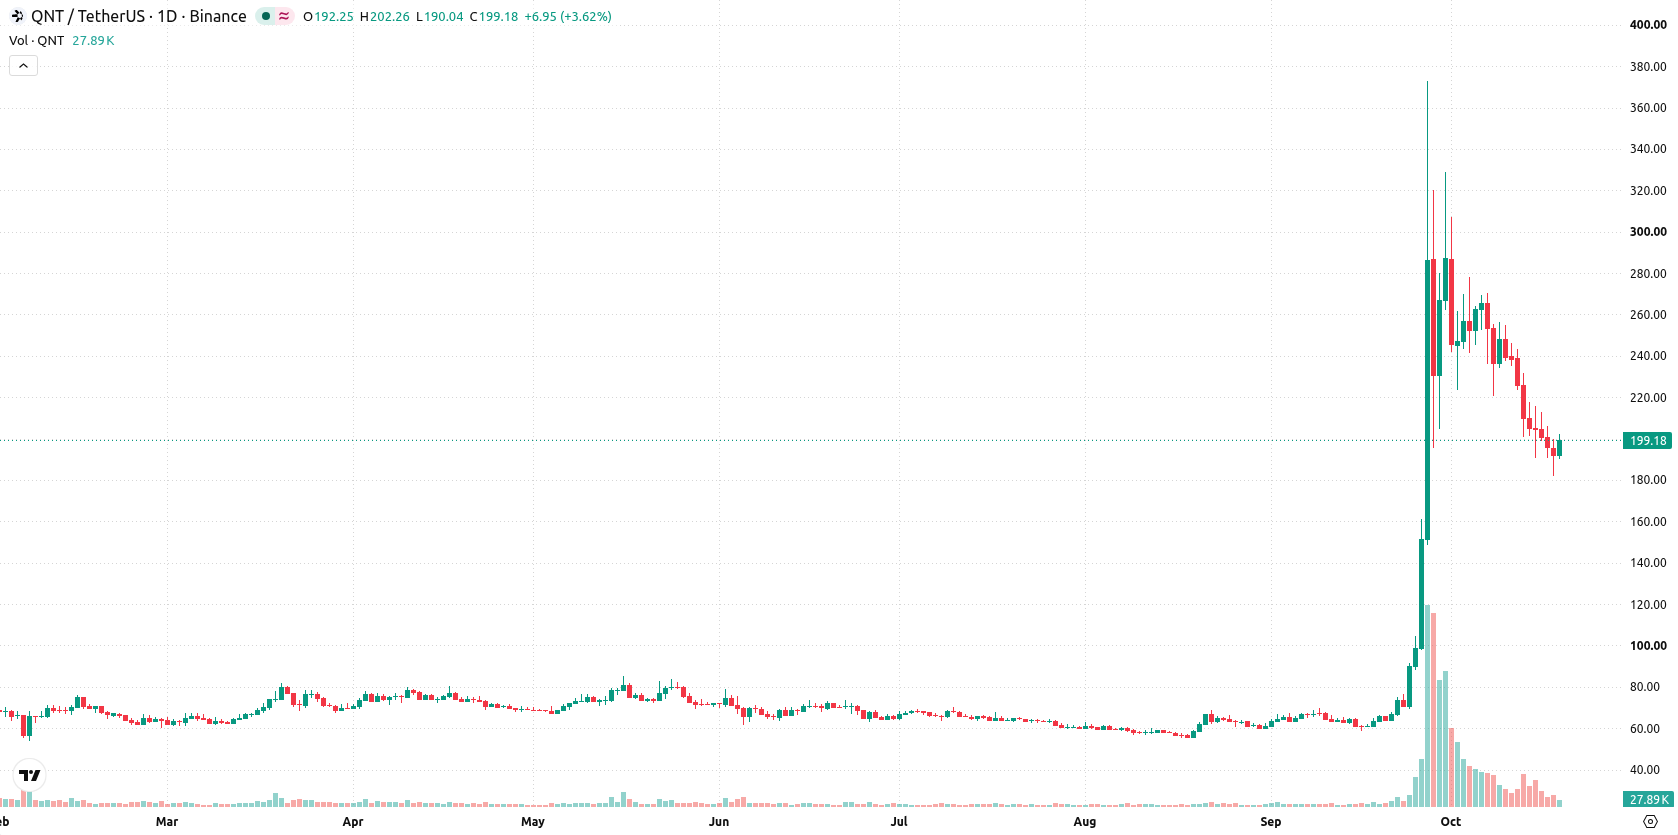
Bearish momentum persists this week as volatility and technical support intersect
On the daily chart, Quant is in a sustained move lower with a firm trend, marked by a high 7-day volatility of 27.47%. Momentum signals show mixed readings with the RSI in a neutral zone at 45.41, but both the CCI and Stochastic RSI flagging oversold conditions, suggesting sellers have dominated but some stabilization could emerge. The price is hovering above support at $181.74, while resistance stands at the Ichimoku Kijun level of $221.2. For now, the setup points to an active bearish phase, though deeply oversold readings highlight potential for a near-term bounce.
Upside bias dominates next week with consolidation likely unless key levels break
For the next 7 days, the expected range is $173.129527 to $239.46. Probabilities favor an increase (64% vs 36%). The base case sees Quant consolidating between $181.74 and $221.2. A sustained push above $221.2 could open the way for a move toward the upper end of the range, while a close below $181.74 would put $173.13 in play and suggest further downside risk.
Earlier, analysts noted that Quant faced persistent short-term selling pressure with a bias toward further downside. The current analysis adds that traders should monitor the $181.74 support and $221.2 resistance levels for signs of either renewed weakness or the start of a technical rebound in the near term.









-
 Afghanistan
-
 Albania
-
 Algeria
-
 Angola
-
 Argentina
-
 Armenia
-
 Australia
-
 Austria
-
 Azerbaijan
-
 Bahamas
-
 Bahrain
-
 Bangladesh
-
 Belarus
-
 Belgium
-
 Bolivia
-
 Botswana
-
 Brazil
-
 Brunei
-
 Bulgaria
-
 Cambodia
-
 Cameroon
-
 Canada
-
 Chile
-
 China
-
 Colombia
-
 Congo
-
 Costa Rica
-
 Cote d'Ivoire
-
 Croatia
-
 Cuba
-
 Cyprus
-
 Czechia
-
 DR Congo
-
 Denmark
-
 Dominican Republic
-
 Ecuador
-
 Egypt
-
 El Salvador
-
 Estonia
-
 Eswatini
-
 Ethiopia
-
 Finland
-
 France
-
 Georgia
-
 Germany
-
 Ghana
-
 Greece
-
 Haiti
-
 Hong Kong
-
 Hungary
-
 India
-
 Indonesia
-
 Iran, Islamic republic
-
 Iraq
-
 Ireland
-
 Israel
-
 Italy
-
 Jamaica
-
 Japan
-
 Jordan
-
 Kazakhstan
-
 Kenya
-
 Korea
-
 Kuwait
-
 Kyrgyzstan
-
 Laos
-
 Latvia
-
 Lebanon
-
 Lesotho
-
 Libya
-
 Lithuania
-
 Luxembourg
-
 Madagascar
-
 Malaysia
-
 Malta
-
 Mauritius
-
 Mexico
-
 Moldova
-
 Mongolia
-
 Montenegro
-
 Morocco
-
 Mozambique
-
 Myanmar
-
 Namibia
-
 Nepal
-
 Netherlands
-
 New Zealand
-
 Nigeria
-
 North Macedonia
-
 Norway
-
 Oman
-
 Pakistan
-
 Palestine
-
 Panama
-
 Papua New Guinea
-
 Paraguay
-
 Peru
-
 Philippines
-
 Poland
-
 Portugal
-
 Puerto Rico
-
 Qatar
-
 Reunion
-
 Romania
-
 Rwanda
-
 Saudi Arabia
-
 Serbia
-
 Singapore
-
 Slovakia
-
 Slovenia
-
 Somalia
-
 South Africa
-
 Spain
-
 Sri Lanka
-
 Sweden
-
 Switzerland
-
 Syria
-
 Taiwan
-
 Tajikistan
-
 Tanzania
-
 Thailand
-
 Trinidad and Tobago
-
 Tunisia
-
 Turkey
-
 UAE
-
 Uganda
-
 Ukraine
-
 United Kingdom
-
United States
-
 Uruguay
-
 Uzbekistan
-
 Venezuela
-
 Vietnam
-
 Yemen
-
 Zambia
-
 Zimbabwe
- Forex
- Crypto












