

Bitcoin price prediction: $79,681 support in view? BTC trades flat

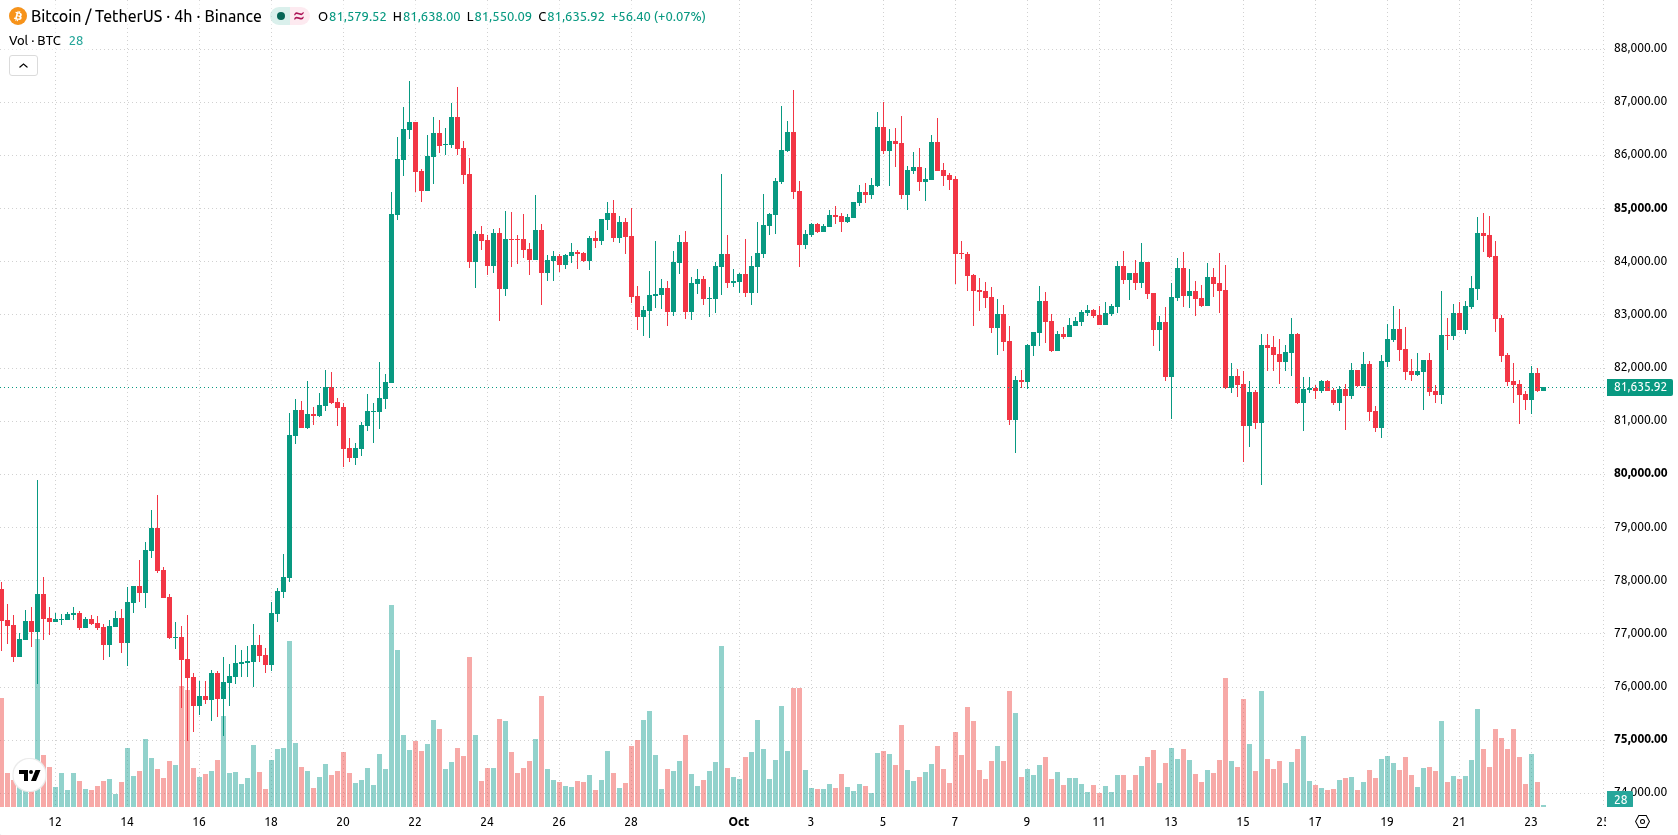
Bitcoin (BTC) is trading at $81,566 in a moderately volatile session, with a slight daily decline. The price currently sits below its key short- and medium-term moving averages but remains well above its longer-term trend lines.
 77253.58
81971.00
Highlights
- U.S. spot Bitcoin ETFs saw $635.5 million in single-day outflows Thursday, their largest withdrawal since June.
- Institutional redemptions are contributing to reduced near-term support for Bitcoin, with persistent volatility among ETF investors.
- BTC/USD trades below key moving averages with oversold momentum readings, expecting a $79,681 to $83,485 range and a bias toward further downside.
Institutional pullback as ETF outflows drive sentiment shift
U.S. spot Bitcoin ETFs experienced their largest single-day outflow since June, with $635.5 million in redemptions occurring on Thursday, according to Cointelegraph. This substantial withdrawal signals a pullback in institutional demand, which can diminish near-term support for Bitcoin and contribute to softer market sentiment. Earlier in October, another $635.6 million in outflows was reported following recent inflows, highlighting ongoing volatility and shifting positioning among U.S. ETF investors, as noted by Tokenpost.
Sell bias intensifies as technical resistance and momentum weaken
On the H4 chart, BTC trades below the MA-20 and MA-50, while the long-term MA-200 remains well below the current price. The Ichimoku Kijun acts as resistance at $82,791. MACD remains neutral, but ADX points to a sell bias. Alongside this, both RSI and CCI confirm a sell scenario. Stoch RSI and Bull/Bear Power indicate oversold conditions and continued seller dominance, while Awesome Oscillator aligns with broader weakness.
Downside favored as range-bound conditions limit breakout odds
In the short term, BTC is likely to remain within the $79,681 to $83,485 range, in line with typical volatility relative to current levels. The forecast assigns a 30% probability to an upside move, so further downside is viewed as more likely. Baseline scenario calls for sideways trading within this band, while a breakout above $82,791 could trigger a test of the range highs. A decline through $79,681 would reinforce seller control and risk deeper losses.
Previously, analysts noted that Bitcoin was exhibiting mixed momentum signals while holding above its longer-term trend support, with downside risk elevated as upside breakout odds diminished. The latest surge in ETF outflows adds to this cautious backdrop, making the $79,681 support a key level to watch for any escalation in selling pressure.






Latest Bitcoin News



-
 Afghanistan
-
 Albania
-
 Algeria
-
 Angola
-
 Argentina
-
 Armenia
-
 Australia
-
 Austria
-
 Azerbaijan
-
 Bahamas
-
 Bahrain
-
 Bangladesh
-
 Belarus
-
 Belgium
-
 Bolivia
-
 Botswana
-
 Brazil
-
 Brunei
-
 Bulgaria
-
 Cambodia
-
 Cameroon
-
 Canada
-
 Chile
-
 China
-
 Colombia
-
 Congo
-
 Costa Rica
-
 Cote d'Ivoire
-
 Croatia
-
 Cuba
-
 Cyprus
-
 Czechia
-
 DR Congo
-
 Denmark
-
 Dominican Republic
-
 Ecuador
-
 Egypt
-
 El Salvador
-
 Estonia
-
 Eswatini
-
 Ethiopia
-
 Finland
-
 France
-
 Georgia
-
 Germany
-
 Ghana
-
 Greece
-
 Haiti
-
 Hong Kong
-
 Hungary
-
 India
-
 Indonesia
-
 Iran, Islamic republic
-
 Iraq
-
 Ireland
-
 Israel
-
 Italy
-
 Jamaica
-
 Japan
-
 Jordan
-
 Kazakhstan
-
 Kenya
-
 Korea
-
 Kuwait
-
 Kyrgyzstan
-
 Laos
-
 Latvia
-
 Lebanon
-
 Lesotho
-
 Libya
-
 Lithuania
-
 Luxembourg
-
 Madagascar
-
 Malaysia
-
 Malta
-
 Mauritius
-
 Mexico
-
 Moldova
-
 Mongolia
-
 Montenegro
-
 Morocco
-
 Mozambique
-
 Myanmar
-
 Namibia
-
 Nepal
-
 Netherlands
-
 New Zealand
-
 Nigeria
-
 North Macedonia
-
 Norway
-
 Oman
-
 Pakistan
-
 Palestine
-
 Panama
-
 Papua New Guinea
-
 Paraguay
-
 Peru
-
 Philippines
-
 Poland
-
 Portugal
-
 Puerto Rico
-
 Qatar
-
 Reunion
-
 Romania
-
 Rwanda
-
 Saudi Arabia
-
 Serbia
-
 Singapore
-
 Slovakia
-
 Slovenia
-
 Somalia
-
 South Africa
-
 Spain
-
 Sri Lanka
-
 Sweden
-
 Switzerland
-
 Syria
-
 Taiwan
-
 Tajikistan
-
 Tanzania
-
 Thailand
-
 Trinidad and Tobago
-
 Tunisia
-
 Turkey
-
 UAE
-
 Uganda
-
 Ukraine
-
 United Kingdom
-
United States
-
 Uruguay
-
 Uzbekistan
-
 Venezuela
-
 Vietnam
-
 Yemen
-
 Zambia
-
 Zimbabwe
- Forex
- Crypto












