

Can Bitcoin ETF outflows pressure Bitcoin price further?

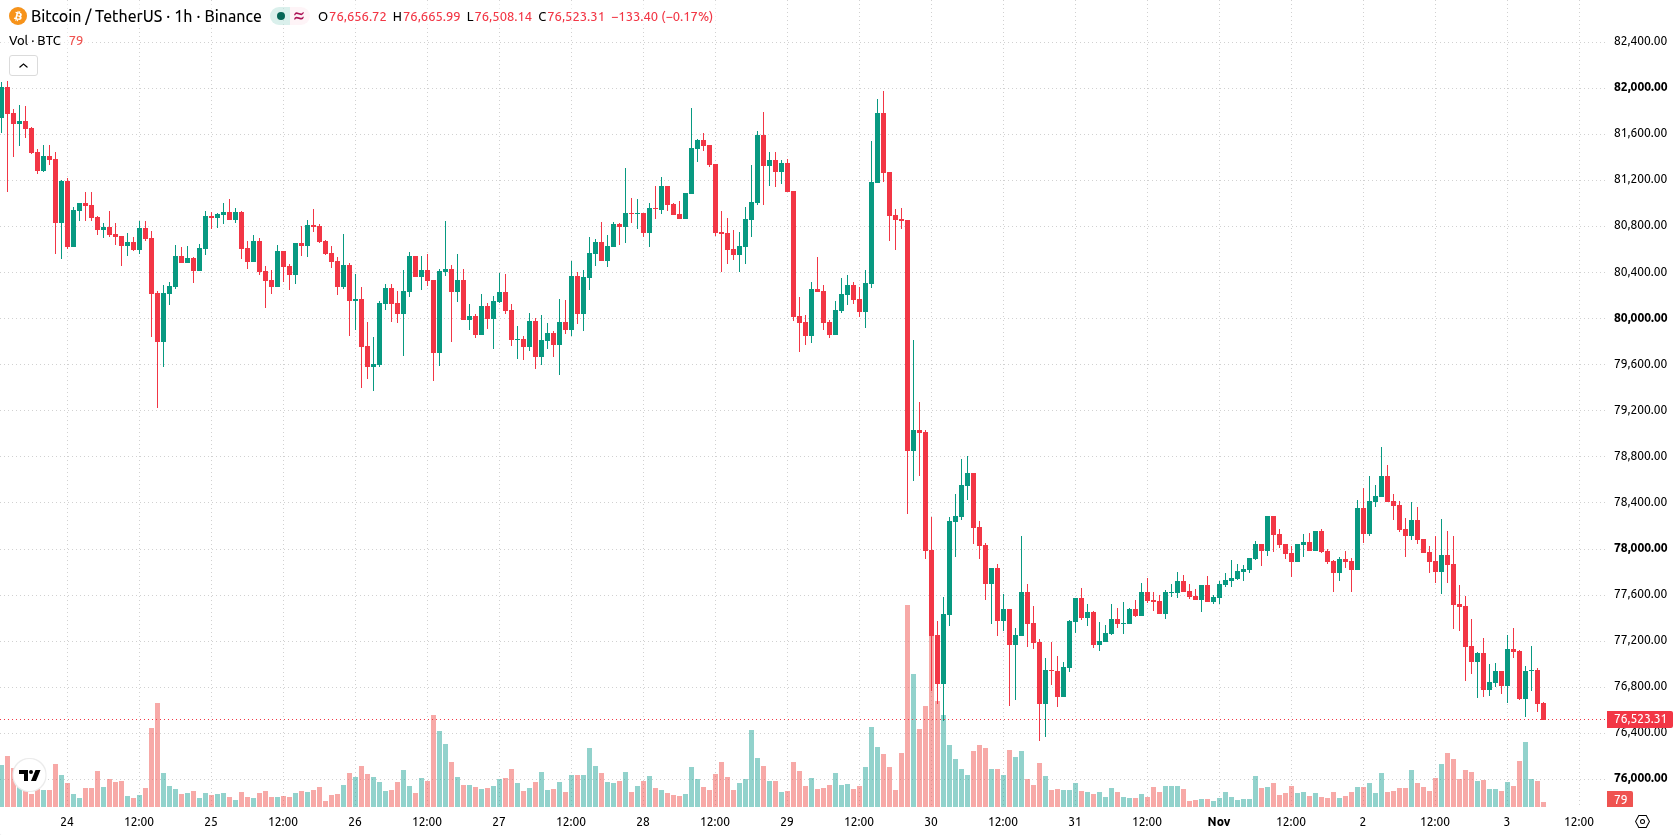
Bitcoin (BTC) is trading at $76,665, marking a daily drop of 2.18%. The cryptocurrency currently sits below its key short- and medium-term moving averages but remains positioned above its long-term average.
 75442.01
81196.01
Highlights
- US spot Bitcoin ETFs recorded net outflows of $643.3 million, with BlackRock and Fidelity leading withdrawals and reducing institutional exposure.
- Strategy added 811 BTC worth about $65.5 million, absorbing supply and indicating sustained corporate demand even as technical updates arrived and Binance faced a security incident.
- Bitcoin trades below key moving averages in the short and medium term, with technical indicators showing dominant downside risk and a forecast range of $75,403 to $77,928.
Institutional outflows and corporate accumulation reshape near-term Bitcoin demand
US spot Bitcoin ETFs saw net outflows of $643.3 million on October 30, with BlackRock's IBIT and Fidelity's FBTC leading the withdrawals, according to Alpha Maven; this reduction in institutional exposure has added noticeable downward pressure on Bitcoin demand in the short term. At the same time, Strategy accumulated 811 BTC worth approximately $65.5 million between October 26 and November 1, a move that absorbs some available supply and reflects ongoing interest from corporate buyers, as The Block reported. Additional developments included the release of Bitcoin Core 32.1, which brought network privacy and compatibility updates according to TradingView, and a major Binance security incident that contributed to brief volatility, as noted by Crypto.
Bearish technical momentum as BTC hits key resistance and support
On the technical front, BTC is trading below both the MA-20 and MA-50 on the H1 timeframe, but remains above the MA-200 on the daily chart. The Ichimoku Kijun level at $77,709 stands as immediate resistance. Momentum indicators reflect a bearish landscape: MACD and ADX both signal weakness, while RSI, CCI, and Bull/Bear Power point to seller dominance. The Stochastic RSI is currently overbought, which could lead to short-term volatility or possible rebound attempts, and the Awesome Oscillator remains neutral, not confirming any particular direction.
Sideways bias dominates as downside risk exceeds bullish breakout odds
Looking ahead, the forecast range for Bitcoin spans $75,403 to $77,928 over the next few days, with a higher probability (76%) of a move to the downside and just a 24% chance of an upward move. The baseline outlook is for price to remain confined within a sideways corridor, reflecting restrained volatility relative to current levels. Should BTC break above the immediate resistance near $77,709, a bullish scenario could unfold with further gains. Conversely, sustained trading below present support opens the door to further downside risk in the near term.
Earlier, analysts noted how Bitcoin’s distinctive branding and broad adoption have helped reinforce its status as a globally recognized financial asset. With recent volatility driven by shifting institutional flows, technical resistance at $77,709 remains a crucial level for traders to monitor amid ongoing short-term downside risks.











-
 Afghanistan
-
 Albania
-
 Algeria
-
 Angola
-
 Argentina
-
 Armenia
-
 Australia
-
 Austria
-
 Azerbaijan
-
 Bahamas
-
 Bahrain
-
 Bangladesh
-
 Belarus
-
 Belgium
-
 Bolivia
-
 Botswana
-
 Brazil
-
 Brunei
-
 Bulgaria
-
 Cambodia
-
 Cameroon
-
 Canada
-
 Chile
-
 China
-
 Colombia
-
 Congo
-
 Costa Rica
-
 Cote d'Ivoire
-
 Croatia
-
 Cuba
-
 Cyprus
-
 Czechia
-
 DR Congo
-
 Denmark
-
 Dominican Republic
-
 Ecuador
-
 Egypt
-
 El Salvador
-
 Estonia
-
 Eswatini
-
 Ethiopia
-
 Finland
-
 France
-
 Georgia
-
 Germany
-
 Ghana
-
 Greece
-
 Haiti
-
 Hong Kong
-
 Hungary
-
 India
-
 Indonesia
-
 Iran, Islamic republic
-
 Iraq
-
 Ireland
-
 Israel
-
 Italy
-
 Jamaica
-
 Japan
-
 Jordan
-
 Kazakhstan
-
 Kenya
-
 Korea
-
 Kuwait
-
 Kyrgyzstan
-
 Laos
-
 Latvia
-
 Lebanon
-
 Lesotho
-
 Libya
-
 Lithuania
-
 Luxembourg
-
 Madagascar
-
 Malaysia
-
 Malta
-
 Mauritius
-
 Mexico
-
 Moldova
-
 Mongolia
-
 Montenegro
-
 Morocco
-
 Mozambique
-
 Myanmar
-
 Namibia
-
 Nepal
-
 Netherlands
-
 New Zealand
-
 Nigeria
-
 North Macedonia
-
 Norway
-
 Oman
-
 Pakistan
-
 Palestine
-
 Panama
-
 Papua New Guinea
-
 Paraguay
-
 Peru
-
 Philippines
-
 Poland
-
 Portugal
-
 Puerto Rico
-
 Qatar
-
 Reunion
-
 Romania
-
 Rwanda
-
 Saudi Arabia
-
 Serbia
-
 Singapore
-
 Slovakia
-
 Slovenia
-
 Somalia
-
 South Africa
-
 Spain
-
 Sri Lanka
-
 Sweden
-
 Switzerland
-
 Syria
-
 Taiwan
-
 Tajikistan
-
 Tanzania
-
 Thailand
-
 Trinidad and Tobago
-
 Tunisia
-
 Turkey
-
 UAE
-
 Uganda
-
 Ukraine
-
 United Kingdom
-
United States
-
 Uruguay
-
 Uzbekistan
-
 Venezuela
-
 Vietnam
-
 Yemen
-
 Zambia
-
 Zimbabwe
- Forex
- Crypto












