

RAY climbs nearly 11% after rebound from recent Solana ecosystem volatility

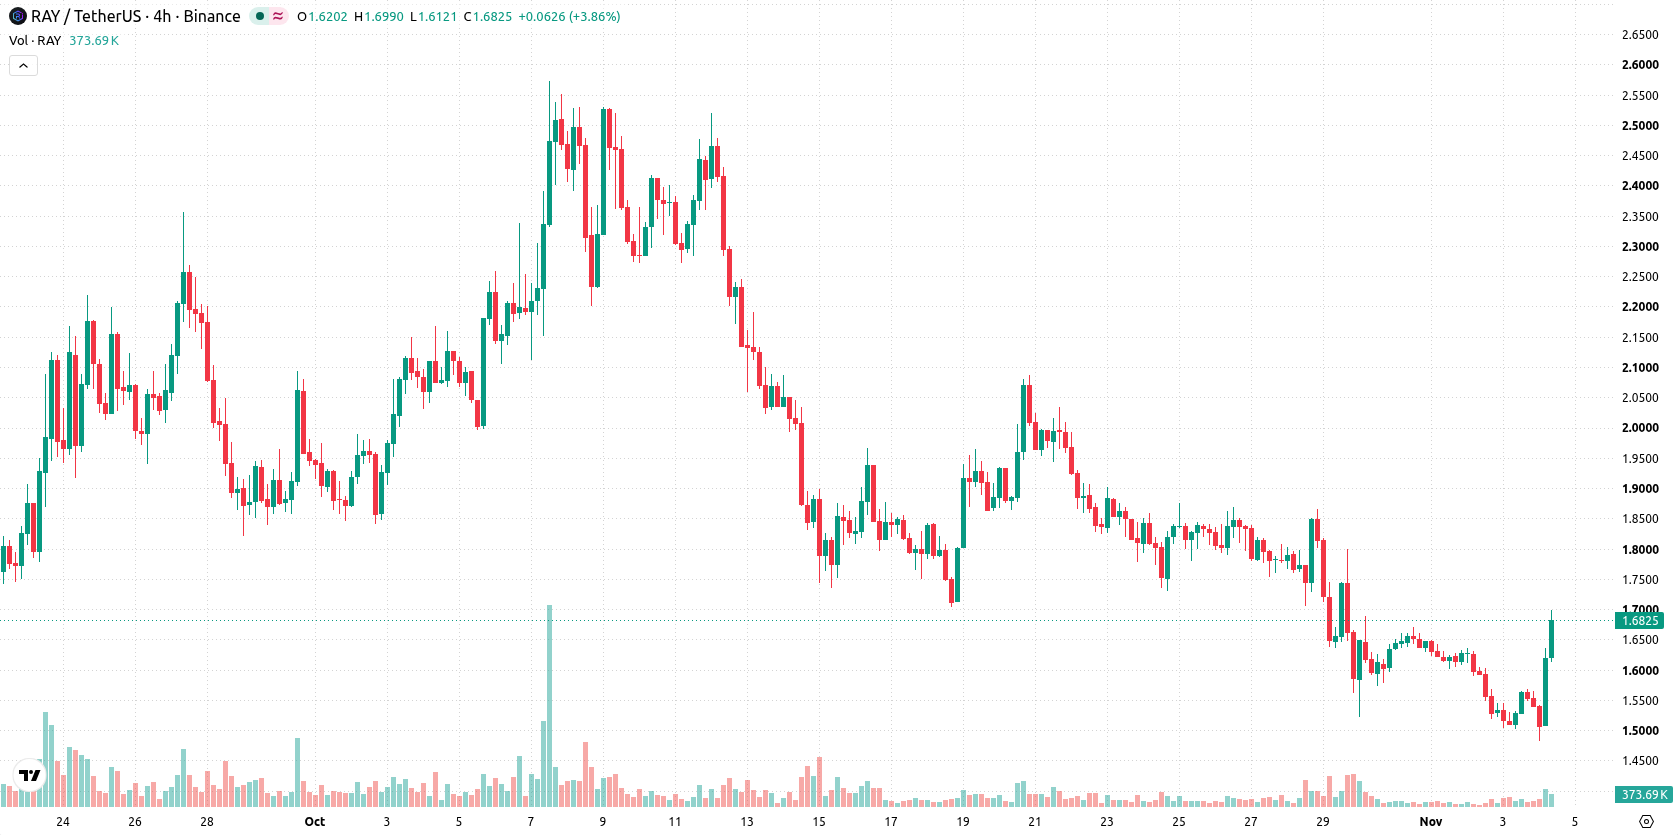
Raydium (RAY) climbed 10.8% as traders reacted to renewed buying interest following a period of heavy losses and broader crypto market liquidations, with concerns over Solana ecosystem security mentioned as a factor in recent sessions. The up move looks limited, as the token remains below both its 20-day and 50-day moving averages, even with long-term bullish structure intact above the 200-day average.
 1.7897
1.8648
Highlights
- Raydium has experienced significant declines in the past week and month, with a market capitalization of about $408 million.
- Performance remains directly linked to liquidity demand, trading volumes, and heightened competition among Solana-based decentralized platforms.
- RAY/USD faces short- and medium-term selling pressure despite a long-term bullish structure, with a projected five-day trading range of $1.3207 to $1.8501 and a 62% probability of a downward move.
Liquidity pressures and Solana competition drive ongoing RAY volatility
Raydium, a decentralized exchange protocol on Solana, has faced notable declines over the last week and month, accompanied by broader crypto market liquidations and concerns related to Binance and Solana ecosystem security. Its performance remains closely tied to liquidity demand, trading volume, and competition among Solana-based decentralized platforms. Market capitalization was reported at about $408 million.
Short-term selling persists despite long-term bullish structure
RAY/USD is trading below both the 20-day moving average ($1.7724) and the 50-day moving average ($1.896), but remains above the 200-day moving average ($1.0237). This configuration suggests short- and medium-term pressure from sellers, even as long-term bullish structure is preserved. The near-term ceiling is set at $1.7724 and support is defined at $1.6085, with the Ichimoku Kijun line at $2.0155 and the 50-day moving average well above, confirming the prevailing long-term positive trend. Daily momentum indicators show mixed signals: MACD and Average Directional Index (ADX) both reflect a sell bias, while the Relative Strength Index (RSI) remains neutral. The Stochastic RSI and Commodity Channel Index (CCI) are in oversold zones, indicating possible short-term rebound risk rather than sustained bearish confirmation. Bull/Bear Power (BBP) is negative, showing seller control over intraday momentum, and the Awesome Oscillator signals ongoing bearish momentum. The pair recently saw strong intraday recovery near session highs, with daily volatility at 8.58%, and price action demonstrating a rebound but conflicted momentum signals overall.
Earlier, analysts noted that Raydium was staging a recovery on improving financials and a shift in technical momentum. The current article adds that despite recent gains, sellers maintain short- to medium-term control, making the ability to hold support at $1.6085 a key risk factor in the coming days.










-
 Afghanistan
-
 Albania
-
 Algeria
-
 Angola
-
 Argentina
-
 Armenia
-
 Australia
-
 Austria
-
 Azerbaijan
-
 Bahamas
-
 Bahrain
-
 Bangladesh
-
 Belarus
-
 Belgium
-
 Bolivia
-
 Botswana
-
 Brazil
-
 Brunei
-
 Bulgaria
-
 Cambodia
-
 Cameroon
-
 Canada
-
 Chile
-
 China
-
 Colombia
-
 Congo
-
 Costa Rica
-
 Cote d'Ivoire
-
 Croatia
-
 Cuba
-
 Cyprus
-
 Czechia
-
 DR Congo
-
 Denmark
-
 Dominican Republic
-
 Ecuador
-
 Egypt
-
 El Salvador
-
 Estonia
-
 Eswatini
-
 Ethiopia
-
 Finland
-
 France
-
 Georgia
-
 Germany
-
 Ghana
-
 Greece
-
 Haiti
-
 Hong Kong
-
 Hungary
-
 India
-
 Indonesia
-
 Iran, Islamic republic
-
 Iraq
-
 Ireland
-
 Israel
-
 Italy
-
 Jamaica
-
 Japan
-
 Jordan
-
 Kazakhstan
-
 Kenya
-
 Korea
-
 Kuwait
-
 Kyrgyzstan
-
 Laos
-
 Latvia
-
 Lebanon
-
 Lesotho
-
 Libya
-
 Lithuania
-
 Luxembourg
-
 Madagascar
-
 Malaysia
-
 Malta
-
 Mauritius
-
 Mexico
-
 Moldova
-
 Mongolia
-
 Montenegro
-
 Morocco
-
 Mozambique
-
 Myanmar
-
 Namibia
-
 Nepal
-
 Netherlands
-
 New Zealand
-
 Nigeria
-
 North Macedonia
-
 Norway
-
 Oman
-
 Pakistan
-
 Palestine
-
 Panama
-
 Papua New Guinea
-
 Paraguay
-
 Peru
-
 Philippines
-
 Poland
-
 Portugal
-
 Puerto Rico
-
 Qatar
-
 Reunion
-
 Romania
-
 Rwanda
-
 Saudi Arabia
-
 Serbia
-
 Singapore
-
 Slovakia
-
 Slovenia
-
 Somalia
-
 South Africa
-
 Spain
-
 Sri Lanka
-
 Sweden
-
 Switzerland
-
 Syria
-
 Taiwan
-
 Tajikistan
-
 Tanzania
-
 Thailand
-
 Trinidad and Tobago
-
 Tunisia
-
 Turkey
-
 UAE
-
 Uganda
-
 Ukraine
-
 United Kingdom
-
United States
-
 Uruguay
-
 Uzbekistan
-
 Venezuela
-
 Vietnam
-
 Yemen
-
 Zambia
-
 Zimbabwe
- Forex
- Crypto












