

Can ETF outflows and tech selloff pressure Bitcoin?

Bitcoin (BTC) is trading at $75,698, down 5.89% for the day. The asset currently sits below its key short- and medium-term moving averages, with longer-term structure remaining intact above historical trend levels.
 75442.01
81196.01
Highlights
- Bitcoin spot ETFs saw $74.6 million in net inflows, with Fidelity's FBTC attracting meaningful institutional allocations.
- Around $800 million in short positions were unwound over the last 24 hours, leading to increased volatility.
- BTC/USD trades below key short- and medium-term moving averages, with downside momentum dominating and the expected price range at $74,359 to $77,036 for the next two to three days.
Institutional inflows offset by liquidations and risk-off sentiment
Bitcoin spot ETFs recorded a net inflow of $74.6 million on November 4, with Fidelity's FBTC attracting significant allocations, according to Cryptoticker. This institutional buying delivered a temporary increase in demand and liquidity, but was followed by heightened volatility tied to large-scale liquidations—approximately $800 million in shorts were unwound over the last 24 hours, as reported by FXStreet. Broader risk-off sentiment was reinforced by ETF outflows and declines in chip stocks, contributing to pronounced swings in Bitcoin trading conditions.
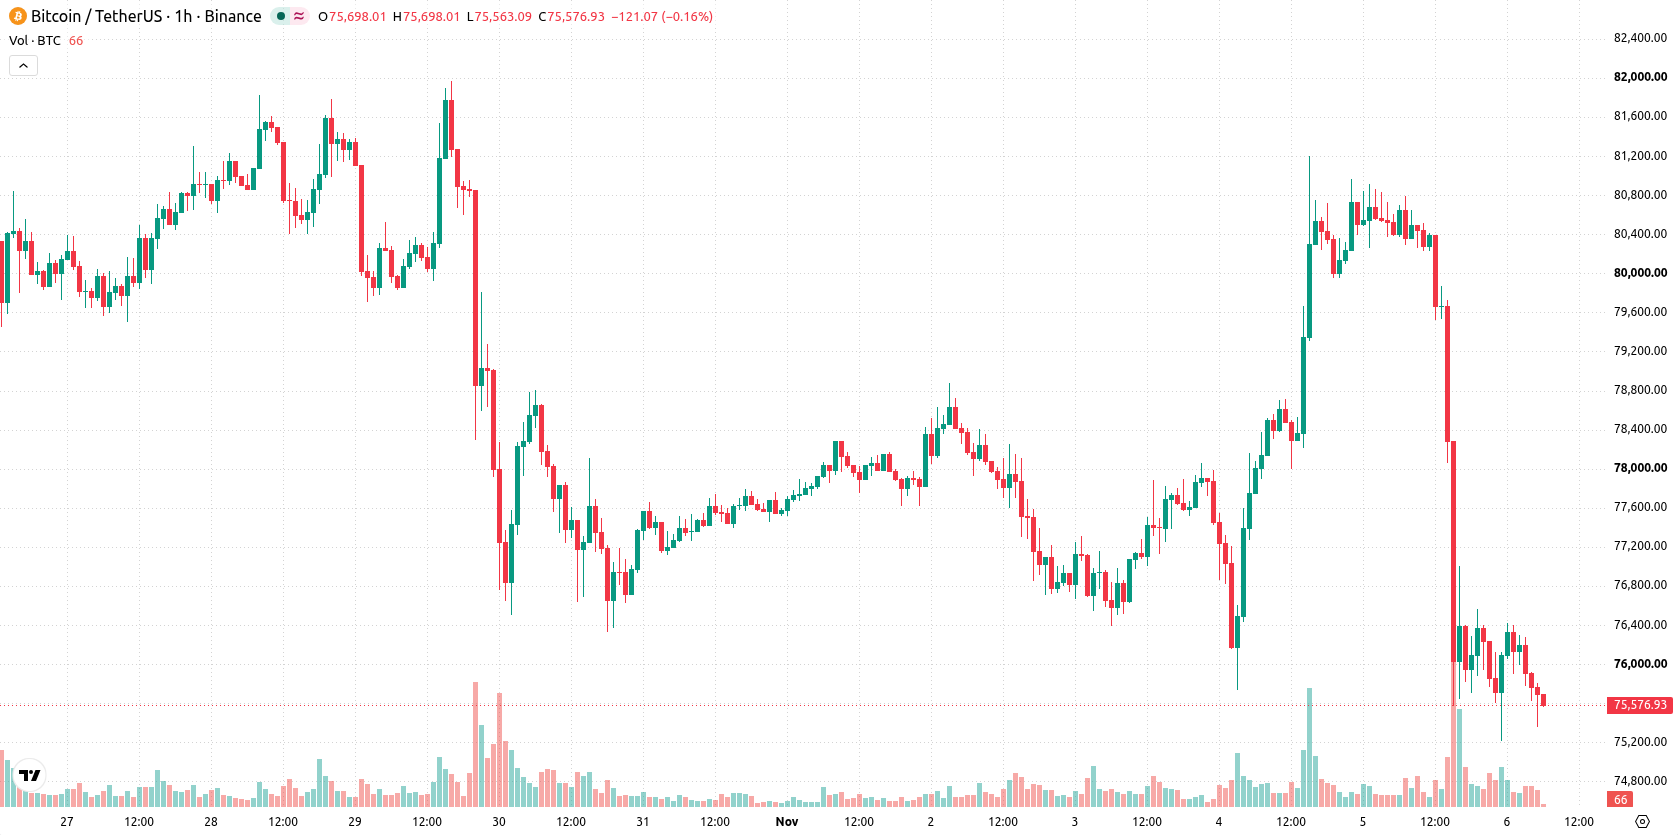
Bearish momentum persists under resistance amid mixed indicator signals
On the technical front, BTC/USD is trading below both the MA-20 ($77,189) and MA-50 ($78,590), while remaining above the long-term MA-200 ($73,243). Immediate resistance is identified at the Ichimoku Kijun level of $78,022, and near-term support is set at $74,359. Momentum indicators further reflect a bearish bias: MACD signals a strong sell, ADX also registers a sell, and Bull/Bear Power is sharply negative at -562.67, confirming intraday seller dominance. In contrast, RSI, Stoch RSI, and CCI are all positioned in their neutral zones, and the Awesome Oscillator is neutral, showing little conviction for an imminent reversal.
Downside risk elevated as breakout probability remains limited
Over the next 2–3 trading days, BTC is expected to remain in a volatility band between $74,359 and $77,036. The probability of a breakout to the upside is currently very low, while downside risk is elevated. Baseline scenario calls for continued range-bound action within these levels, with a bullish breakout requiring a move above $78,022 and a bearish scenario unfolding if support at $74,359 breaks.
Earlier, analysts noted that Bitcoin faced persistent selling pressure driven by sustained outflows from U.S.-listed spot ETFs and strong short-term resistance. The latest market action reinforces this outlook as Bitcoin remains under pronounced downside risk, with traders advised to monitor the $74,359 support level for potential breakdown or stabilization.






Latest Bitcoin News





-
 Afghanistan
-
 Albania
-
 Algeria
-
 Angola
-
 Argentina
-
 Armenia
-
 Australia
-
 Austria
-
 Azerbaijan
-
 Bahamas
-
 Bahrain
-
 Bangladesh
-
 Belarus
-
 Belgium
-
 Bolivia
-
 Botswana
-
 Brazil
-
 Brunei
-
 Bulgaria
-
 Cambodia
-
 Cameroon
-
 Canada
-
 Chile
-
 China
-
 Colombia
-
 Congo
-
 Costa Rica
-
 Cote d'Ivoire
-
 Croatia
-
 Cuba
-
 Cyprus
-
 Czechia
-
 DR Congo
-
 Denmark
-
 Dominican Republic
-
 Ecuador
-
 Egypt
-
 El Salvador
-
 Estonia
-
 Eswatini
-
 Ethiopia
-
 Finland
-
 France
-
 Georgia
-
 Germany
-
 Ghana
-
 Greece
-
 Haiti
-
 Hong Kong
-
 Hungary
-
 India
-
 Indonesia
-
 Iran, Islamic republic
-
 Iraq
-
 Ireland
-
 Israel
-
 Italy
-
 Jamaica
-
 Japan
-
 Jordan
-
 Kazakhstan
-
 Kenya
-
 Korea
-
 Kuwait
-
 Kyrgyzstan
-
 Laos
-
 Latvia
-
 Lebanon
-
 Lesotho
-
 Libya
-
 Lithuania
-
 Luxembourg
-
 Madagascar
-
 Malaysia
-
 Malta
-
 Mauritius
-
 Mexico
-
 Moldova
-
 Mongolia
-
 Montenegro
-
 Morocco
-
 Mozambique
-
 Myanmar
-
 Namibia
-
 Nepal
-
 Netherlands
-
 New Zealand
-
 Nigeria
-
 North Macedonia
-
 Norway
-
 Oman
-
 Pakistan
-
 Palestine
-
 Panama
-
 Papua New Guinea
-
 Paraguay
-
 Peru
-
 Philippines
-
 Poland
-
 Portugal
-
 Puerto Rico
-
 Qatar
-
 Reunion
-
 Romania
-
 Rwanda
-
 Saudi Arabia
-
 Serbia
-
 Singapore
-
 Slovakia
-
 Slovenia
-
 Somalia
-
 South Africa
-
 Spain
-
 Sri Lanka
-
 Sweden
-
 Switzerland
-
 Syria
-
 Taiwan
-
 Tajikistan
-
 Tanzania
-
 Thailand
-
 Trinidad and Tobago
-
 Tunisia
-
 Turkey
-
 UAE
-
 Uganda
-
 Ukraine
-
 United Kingdom
-
United States
-
 Uruguay
-
 Uzbekistan
-
 Venezuela
-
 Vietnam
-
 Yemen
-
 Zambia
-
 Zimbabwe
- Forex
- Crypto












