

QNT slides around 8.5% amid downside gap and ongoing technical headwinds

Quant (QNT) dropped 8.44% after a downside gap, as a lack of fresh company-specific developments left price action driven by technical selling. The move is supported by ongoing short- and medium-term headwinds, with the token trading below both its 20-day and 50-day moving averages.
 198.43
210.980000
Highlights
- There are no reported regulatory, ecosystem, or tokenomic updates currently affecting Quant Network or its token.
- Recent headlines using the QNT ticker pertain to unrelated entities and do not involve core developments at Quant Network.
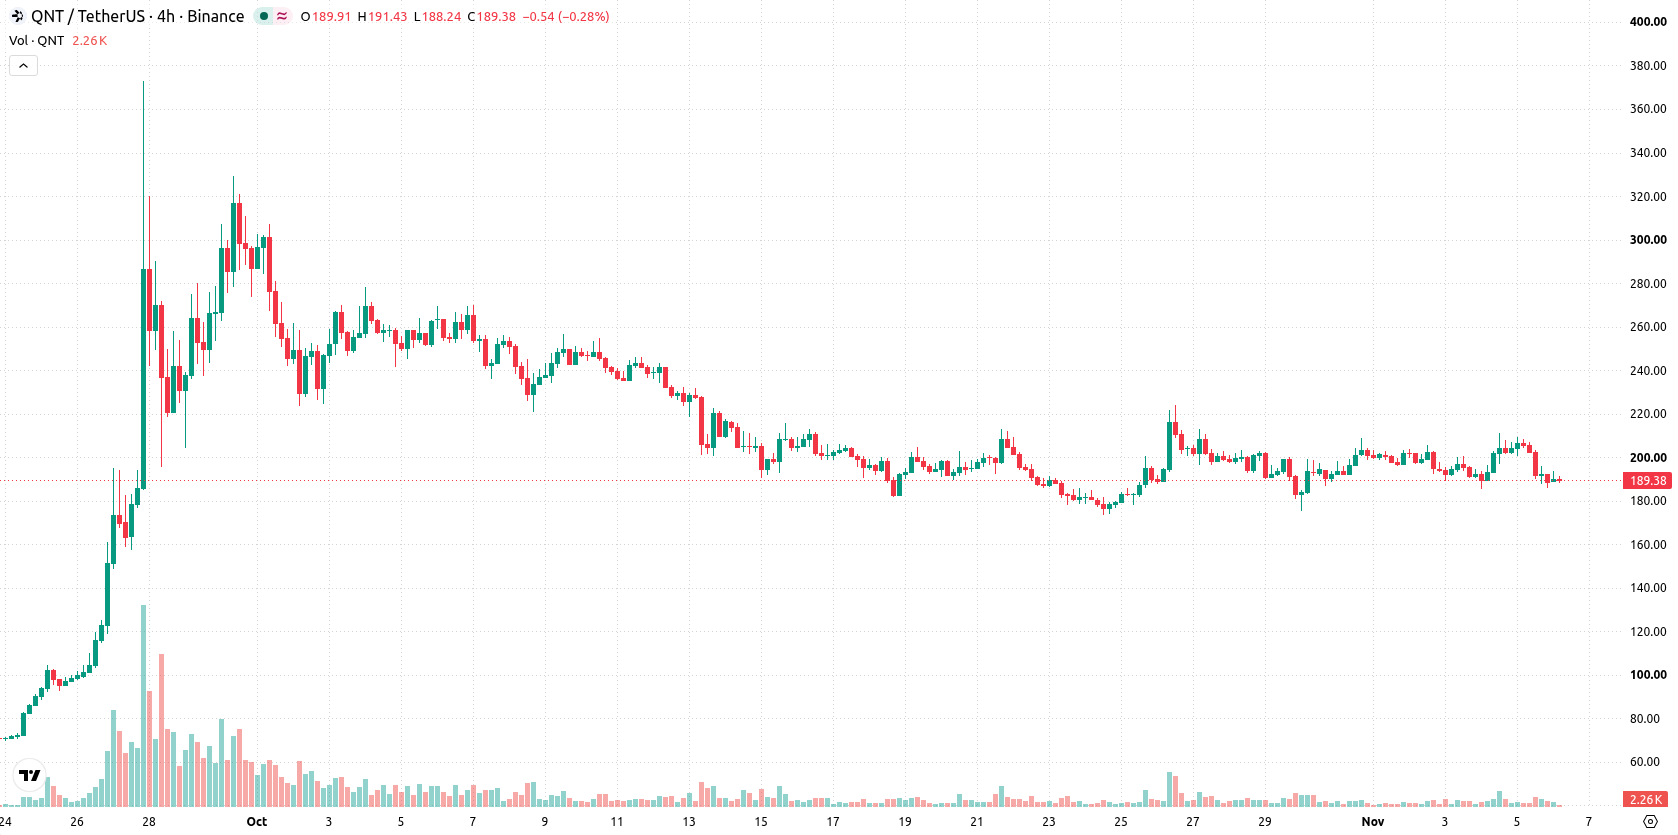
- QNT/USD trades below short- and medium-term moving averages with downside pressure after an 8.44% drop to $189.35; the forecast range for the next five sessions is $176.535 to $210.57, with a 70% probability of further declines.
Muted sentiment persists amid absence of Quant-specific news
There have been no recent ecosystem, regulatory, or tokenomic updates directly tied to the Quant crypto project. All other headlines referencing the ticker relate to entities unrelated to Quant Network.
Neutral momentum signals diverge from persistent selling pressure
QNT/USD is trading below its 20-day and 50-day moving averages at $194.176 and $191.0822, reflecting short- and medium-term headwinds. The pair remains well above the 200-day average at $97.9886, indicating that the long-term structure retains a bullish bias due to the positive alignment between the 50-day and 200-day averages. Resistance is seen at $191.0822, while support stands at $188.52. Daily momentum indicators, including MACD and ADX, are neutral, as are the RSI, Stochastic RSI, and CCI. Bull/Bear Power signals intraday buyer dominance. Price action is clustered near the session low, daily volatility is 2.69%, and selling pressure has remained persistent after the open. The neutral oscillators diverge from the pronounced price drop, highlighting limited near-term trend clarity.
Earlier, analysts noted that Quant was experiencing persistent short-term bearish momentum while maintaining a constructive long-term outlook. The latest price action reinforces these themes, with traders advised to monitor the $191.0822 resistance and $176.535 support as key levels for potential breakout or further downside risk in the coming sessions.










-
 Afghanistan
-
 Albania
-
 Algeria
-
 Angola
-
 Argentina
-
 Armenia
-
 Australia
-
 Austria
-
 Azerbaijan
-
 Bahamas
-
 Bahrain
-
 Bangladesh
-
 Belarus
-
 Belgium
-
 Bolivia
-
 Botswana
-
 Brazil
-
 Brunei
-
 Bulgaria
-
 Cambodia
-
 Cameroon
-
 Canada
-
 Chile
-
 China
-
 Colombia
-
 Congo
-
 Costa Rica
-
 Cote d'Ivoire
-
 Croatia
-
 Cuba
-
 Cyprus
-
 Czechia
-
 DR Congo
-
 Denmark
-
 Dominican Republic
-
 Ecuador
-
 Egypt
-
 El Salvador
-
 Estonia
-
 Eswatini
-
 Ethiopia
-
 Finland
-
 France
-
 Georgia
-
 Germany
-
 Ghana
-
 Greece
-
 Haiti
-
 Hong Kong
-
 Hungary
-
 India
-
 Indonesia
-
 Iran, Islamic republic
-
 Iraq
-
 Ireland
-
 Israel
-
 Italy
-
 Jamaica
-
 Japan
-
 Jordan
-
 Kazakhstan
-
 Kenya
-
 Korea
-
 Kuwait
-
 Kyrgyzstan
-
 Laos
-
 Latvia
-
 Lebanon
-
 Lesotho
-
 Libya
-
 Lithuania
-
 Luxembourg
-
 Madagascar
-
 Malaysia
-
 Malta
-
 Mauritius
-
 Mexico
-
 Moldova
-
 Mongolia
-
 Montenegro
-
 Morocco
-
 Mozambique
-
 Myanmar
-
 Namibia
-
 Nepal
-
 Netherlands
-
 New Zealand
-
 Nigeria
-
 North Macedonia
-
 Norway
-
 Oman
-
 Pakistan
-
 Palestine
-
 Panama
-
 Papua New Guinea
-
 Paraguay
-
 Peru
-
 Philippines
-
 Poland
-
 Portugal
-
 Puerto Rico
-
 Qatar
-
 Reunion
-
 Romania
-
 Rwanda
-
 Saudi Arabia
-
 Serbia
-
 Singapore
-
 Slovakia
-
 Slovenia
-
 Somalia
-
 South Africa
-
 Spain
-
 Sri Lanka
-
 Sweden
-
 Switzerland
-
 Syria
-
 Taiwan
-
 Tajikistan
-
 Tanzania
-
 Thailand
-
 Trinidad and Tobago
-
 Tunisia
-
 Turkey
-
 UAE
-
 Uganda
-
 Ukraine
-
 United Kingdom
-
United States
-
 Uruguay
-
 Uzbekistan
-
 Venezuela
-
 Vietnam
-
 Yemen
-
 Zambia
-
 Zimbabwe
- Forex
- Crypto












