

RAY climbs around 10.5% after strong buying and technical momentum in Solana ecosystem

Raydium (RAY) surged 10.5% today on strong technical momentum and intensified intraday buying interest as the price moved decisively higher. The rally looks limited for now, with the token still capped by the 50-day moving average and the Ichimoku Kijun acting as resistance overhead.
 1.761
1.8648
Highlights
- No new fundamental events or protocol developments have been reported for Raydium, with no recent regulatory or technical incidents.
- Recent price moves in Raydium are tied to technical trading activity and speculative positioning within the broader Solana ecosystem.
- RAY/USD trades in a bullish structure with mixed short-term indicators, an expected five-day range of $1.6328 to $2.017, and a baseline scenario of sideways movement.
Speculative momentum drives gains despite lack of fundamentals
Recent news shows no confirmed fundamental catalysts or protocol events influencing Raydium. There have been no reported Raydium announcements, regulatory actions, technical incidents, or on-chain data developments tied to the latest price move. The token's price activity instead reflects technical trading and speculative sentiment within the broader Solana ecosystem.
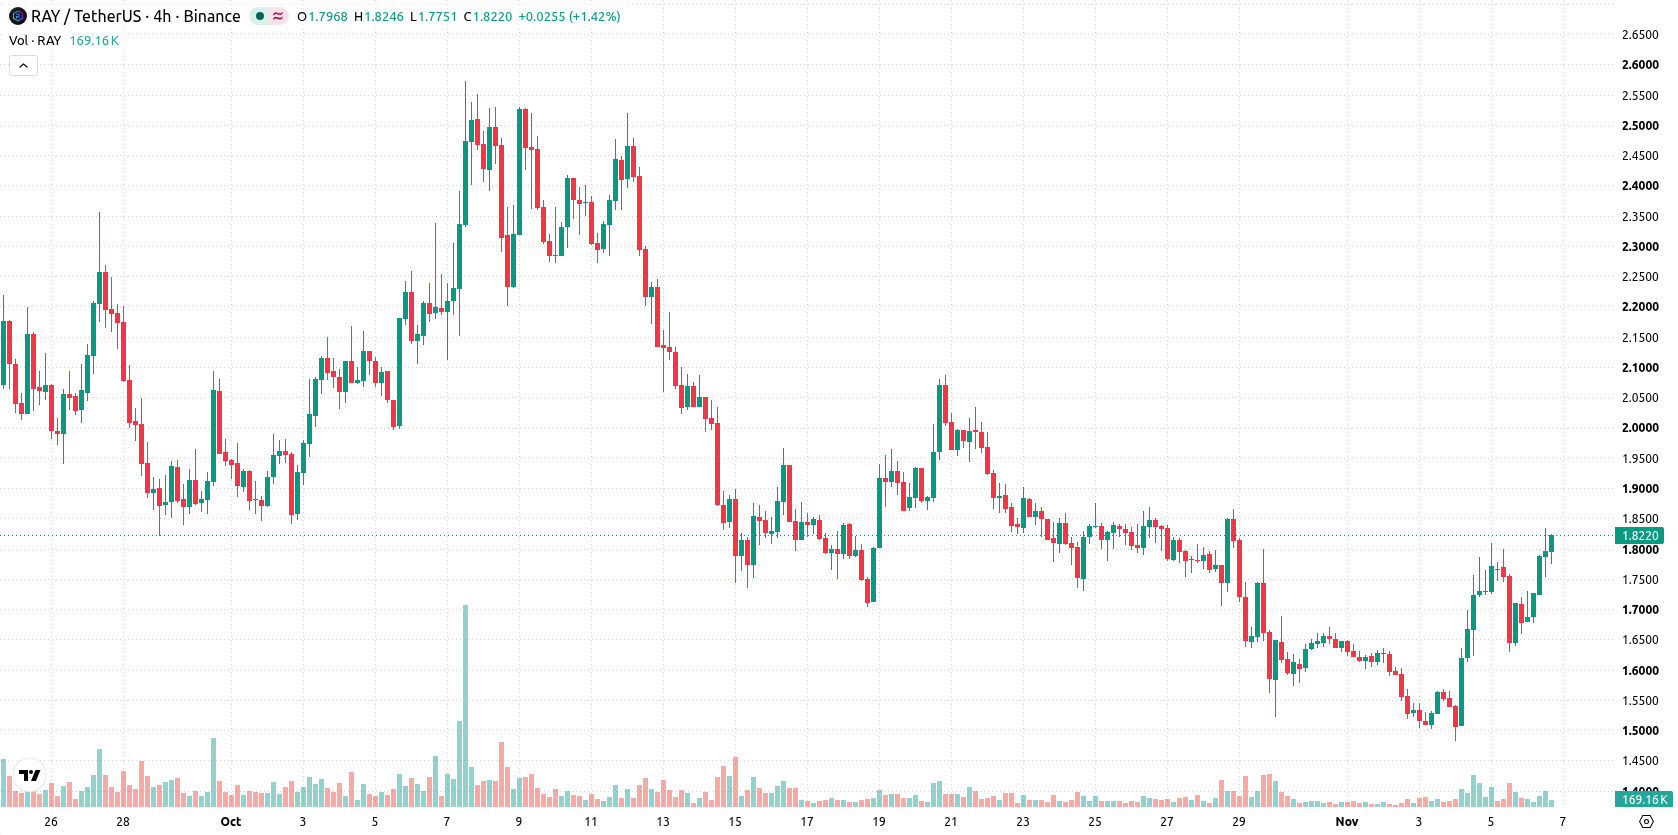
Bullish structure faces resistance as momentum remains mixed
RAY/USD trades above the 20-day moving average ($1.7594) and well above the 200-day ($1.0343), but remains under the 50-day moving average ($1.9118). This technical setup points to a firm short- and long-term bullish structure, with medium-term resistance zones defined by the 50-day average and Ichimoku Kijun at $2.0006. The nearest resistance stands at $1.9118 and immediate support is at $1.809. Momentum signals are mixed. Both the MACD and ADX suggest a sell bias, while the CCI and RSI remain neutral. The Stochastic RSI is in the overbought zone, highlighting potential short-term correction risk. Bull/Bear Power is positive, reflecting strong intraday buying. The daily move is strong, with RAY/USD up by $0.173 or 10.5% and trading near its session high, as volatility registers at 6.93%. Despite mixed momentum signals, price action shows strength toward the highs.
Earlier, analysts noted that Raydium was exhibiting sustained technical strength supported by a rotation in revenue sources and stable bullish momentum. The current technical setup reinforces this directional bias but introduces heightened near-term volatility, with traders advised to monitor the $1.6328–$2.017 band for potential breakouts or reversals.










-
 Afghanistan
-
 Albania
-
 Algeria
-
 Angola
-
 Argentina
-
 Armenia
-
 Australia
-
 Austria
-
 Azerbaijan
-
 Bahamas
-
 Bahrain
-
 Bangladesh
-
 Belarus
-
 Belgium
-
 Bolivia
-
 Botswana
-
 Brazil
-
 Brunei
-
 Bulgaria
-
 Cambodia
-
 Cameroon
-
 Canada
-
 Chile
-
 China
-
 Colombia
-
 Congo
-
 Costa Rica
-
 Cote d'Ivoire
-
 Croatia
-
 Cuba
-
 Cyprus
-
 Czechia
-
 DR Congo
-
 Denmark
-
 Dominican Republic
-
 Ecuador
-
 Egypt
-
 El Salvador
-
 Estonia
-
 Eswatini
-
 Ethiopia
-
 Finland
-
 France
-
 Georgia
-
 Germany
-
 Ghana
-
 Greece
-
 Haiti
-
 Hong Kong
-
 Hungary
-
 India
-
 Indonesia
-
 Iran, Islamic republic
-
 Iraq
-
 Ireland
-
 Israel
-
 Italy
-
 Jamaica
-
 Japan
-
 Jordan
-
 Kazakhstan
-
 Kenya
-
 Korea
-
 Kuwait
-
 Kyrgyzstan
-
 Laos
-
 Latvia
-
 Lebanon
-
 Lesotho
-
 Libya
-
 Lithuania
-
 Luxembourg
-
 Madagascar
-
 Malaysia
-
 Malta
-
 Mauritius
-
 Mexico
-
 Moldova
-
 Mongolia
-
 Montenegro
-
 Morocco
-
 Mozambique
-
 Myanmar
-
 Namibia
-
 Nepal
-
 Netherlands
-
 New Zealand
-
 Nigeria
-
 North Macedonia
-
 Norway
-
 Oman
-
 Pakistan
-
 Palestine
-
 Panama
-
 Papua New Guinea
-
 Paraguay
-
 Peru
-
 Philippines
-
 Poland
-
 Portugal
-
 Puerto Rico
-
 Qatar
-
 Reunion
-
 Romania
-
 Rwanda
-
 Saudi Arabia
-
 Serbia
-
 Singapore
-
 Slovakia
-
 Slovenia
-
 Somalia
-
 South Africa
-
 Spain
-
 Sri Lanka
-
 Sweden
-
 Switzerland
-
 Syria
-
 Taiwan
-
 Tajikistan
-
 Tanzania
-
 Thailand
-
 Trinidad and Tobago
-
 Tunisia
-
 Turkey
-
 UAE
-
 Uganda
-
 Ukraine
-
 United Kingdom
-
United States
-
 Uruguay
-
 Uzbekistan
-
 Venezuela
-
 Vietnam
-
 Yemen
-
 Zambia
-
 Zimbabwe
- Forex
- Crypto












