

Overbought Stochastic RSI places pressure on Arbitrum advance amid governance uncertainties: weekly analysis

Arbitrum (ARB) is trading near $0.17 after gaining just over 2% this week, as price momentum lost steam near key resistance. The chart reveals conflicting signals, with volatility elevated but no clear trend, highlighting the market's struggle to break higher. Attention now turns to whether technical barriers will hold, shaping the week ahead.
 0.1752
0.1725
Highlights
- Arbitrum trades at $0.1664 with a 2.15% gain in the past seven days, showing a mild up move.
- Price remains below short-term moving averages and momentum signals are mixed, with overbought stochastic indicating potential short-term exhaustion.
- Expected trading range for the week is $0.1545 to $0.1782, with 62% odds for gains and a risk of correction if resistance holds.
Binance exploit and DAO vote drive sentiment as new integrations gain attention
On October 30, Arbitrum's Security Council froze over 8,400 ETH and 74.5 million ARB tokens after linking them to a Binance exploit, according to The BSCN Debrief. Binance later requested that ArbitrumDAO consider the return of these funds, which will be decided through a governance vote that could influence market sentiment as it develops. Meanwhile, Coinpedia reported that teams integrating the USDG stablecoin can earn ARB rewards for reaching value-locked benchmarks, and Cryptonews.net highlighted recent institutional integrations by LG and Robinhood.
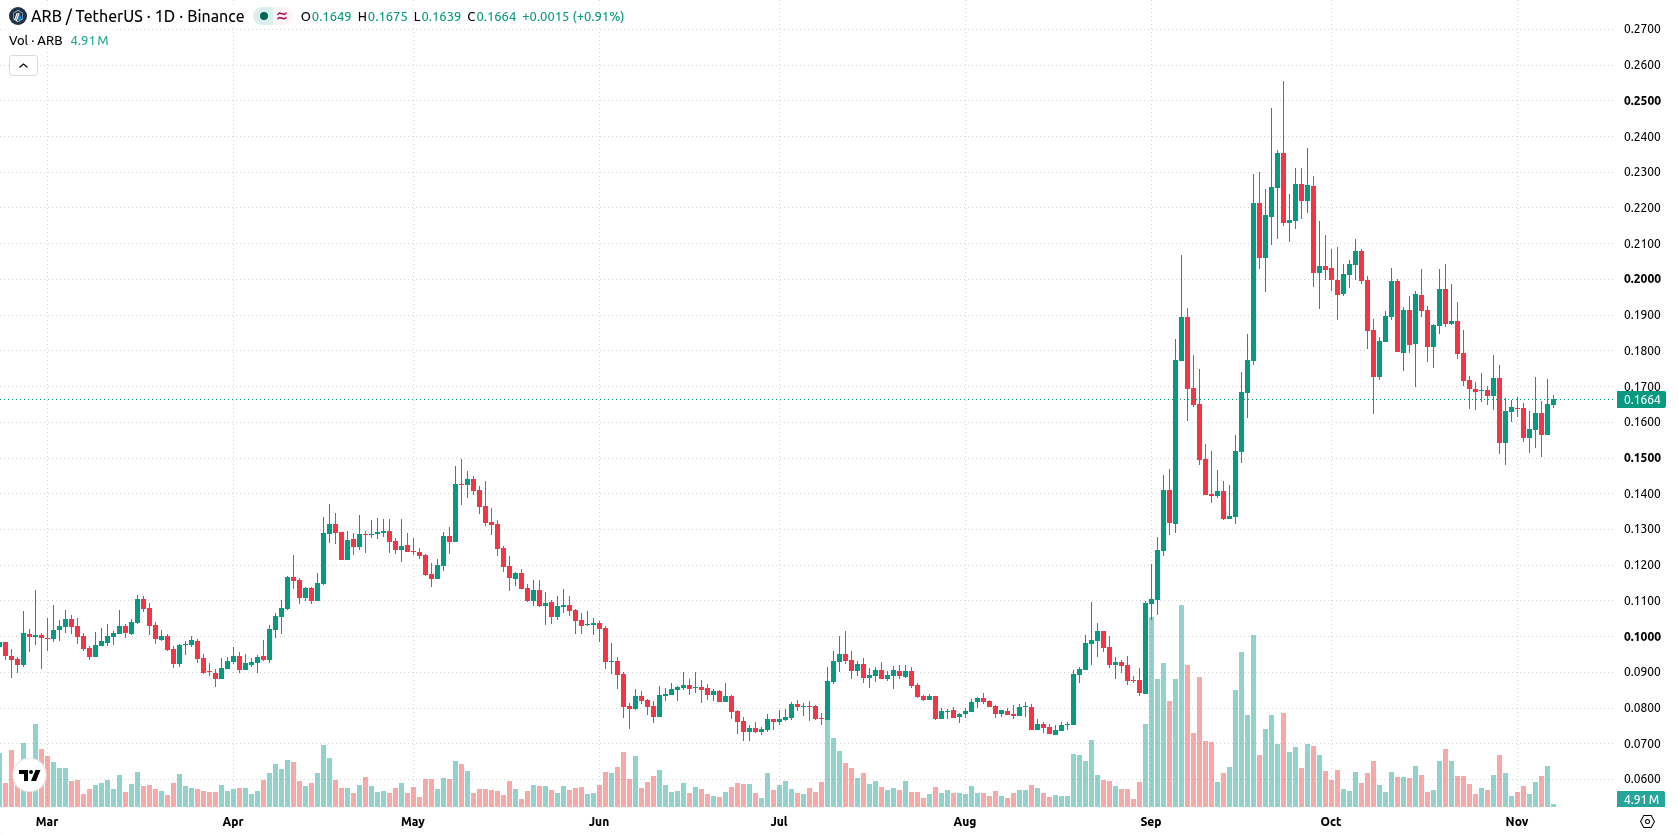
Overbought indicators flag correction risk amid range-bound structure this week
On the daily chart, the trend is flat, with a sharp move higher but no sustained direction as volatility reached 14.92% over the week. Momentum signals are mixed: Stochastic RSI is fully overbought at 100, pointing to potential short-term overheating, while both RSI and CCI remain in neutral zones. Immediate support is at $0.1501, with resistance found at the $0.1701 20-day average and reinforced by the Ichimoku Kijun at $0.176. This setup indicates the potential for range-bound action, but overbought signals suggest a downside correction risk if resistance holds.
Consolidation favored unless resistance breaks open upside in the coming week
In the week ahead, Arbitrum is expected to trade between $0.1545 and $0.1782. The probability of an increase stands at 62%, while the chance of a decrease is 38%. The base case is for consolidation inside the range. A break above $0.1701 could open the way toward the $0.1782 area, while a move below support at $0.1501 would signal further downside risk.
Previously it was reported that Arbitrum maintained bullish technical positioning and operational resilience, with the network demonstrating strong governance amid recent security challenges. The current analysis introduces mixed momentum signals and highlights elevated volatility, making the hold of the $0.1701 resistance a key technical level to monitor for any potential breakout or correction this week.






Latest Arbitrum News





-
 Afghanistan
-
 Albania
-
 Algeria
-
 Angola
-
 Argentina
-
 Armenia
-
 Australia
-
 Austria
-
 Azerbaijan
-
 Bahamas
-
 Bahrain
-
 Bangladesh
-
 Belarus
-
 Belgium
-
 Bolivia
-
 Botswana
-
 Brazil
-
 Brunei
-
 Bulgaria
-
 Cambodia
-
 Cameroon
-
 Canada
-
 Chile
-
 China
-
 Colombia
-
 Congo
-
 Costa Rica
-
 Cote d'Ivoire
-
 Croatia
-
 Cuba
-
 Cyprus
-
 Czechia
-
 DR Congo
-
 Denmark
-
 Dominican Republic
-
 Ecuador
-
 Egypt
-
 El Salvador
-
 Estonia
-
 Eswatini
-
 Ethiopia
-
 Finland
-
 France
-
 Georgia
-
 Germany
-
 Ghana
-
 Greece
-
 Haiti
-
 Hong Kong
-
 Hungary
-
 India
-
 Indonesia
-
 Iran, Islamic republic
-
 Iraq
-
 Ireland
-
 Israel
-
 Italy
-
 Jamaica
-
 Japan
-
 Jordan
-
 Kazakhstan
-
 Kenya
-
 Korea
-
 Kuwait
-
 Kyrgyzstan
-
 Laos
-
 Latvia
-
 Lebanon
-
 Lesotho
-
 Libya
-
 Lithuania
-
 Luxembourg
-
 Madagascar
-
 Malaysia
-
 Malta
-
 Mauritius
-
 Mexico
-
 Moldova
-
 Mongolia
-
 Montenegro
-
 Morocco
-
 Mozambique
-
 Myanmar
-
 Namibia
-
 Nepal
-
 Netherlands
-
 New Zealand
-
 Nigeria
-
 North Macedonia
-
 Norway
-
 Oman
-
 Pakistan
-
 Palestine
-
 Panama
-
 Papua New Guinea
-
 Paraguay
-
 Peru
-
 Philippines
-
 Poland
-
 Portugal
-
 Puerto Rico
-
 Qatar
-
 Reunion
-
 Romania
-
 Rwanda
-
 Saudi Arabia
-
 Serbia
-
 Singapore
-
 Slovakia
-
 Slovenia
-
 Somalia
-
 South Africa
-
 Spain
-
 Sri Lanka
-
 Sweden
-
 Switzerland
-
 Syria
-
 Taiwan
-
 Tajikistan
-
 Tanzania
-
 Thailand
-
 Trinidad and Tobago
-
 Tunisia
-
 Turkey
-
 UAE
-
 Uganda
-
 Ukraine
-
 United Kingdom
-
United States
-
 Uruguay
-
 Uzbekistan
-
 Venezuela
-
 Vietnam
-
 Yemen
-
 Zambia
-
 Zimbabwe
- Forex
- Crypto












