

Quant faces potential pause as price is pinned to the 50-day moving average: weekly analysis

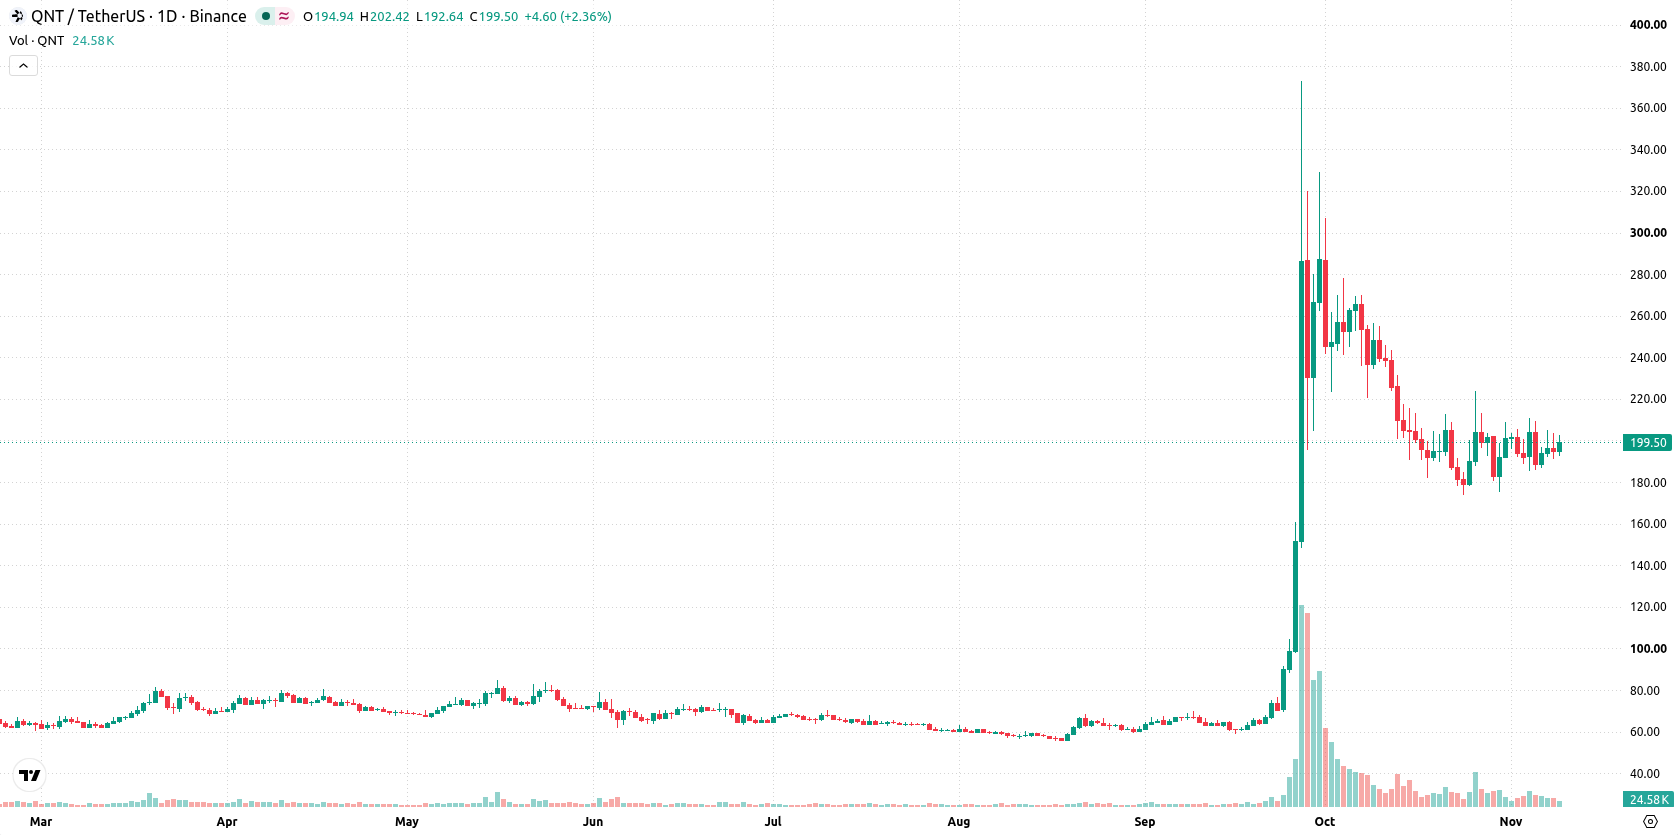
Quant (QNT) is holding near $200 after gaining around 1.6% over the past week, as momentum pushed buyers higher, but several signals now show a stretched setup. The chart highlights a standoff between robust upward price action and evidence of technical exhaustion, setting up a tense week where breakout conviction is uncertain.
 201.5
210.980000
Highlights
- Quant trades at $199.86, gaining $2.17 over the past 7 days and maintaining a bullish long-term price structure.
- The asset consolidates in the $185.35 to $210.98 weekly range, with oscillators remaining neutral but the Stochastic RSI indicating overbought conditions.
- Next week, the price is forecast to trade between $159.888 and $213.422121, with a 57% probability of further upside and key support at $199.1124.
Revenue surge and cloud deal boost confidence as Quantinuum reports
Quantinuum Inc. reported third-quarter 2026 financial results showing a 233% year-over-year revenue increase, according to PR Newswire. The company also raised its full-year revenue outlook and secured its largest-ever cloud agreement, pointing to accelerating business momentum (source: PR Newswire). Additional announcements included new enterprise partnerships and technological progress, further supporting confidence in corporate growth.
Consolidation persists as volatility climbs and overbought signals emerge
On the daily chart, Quant is consolidating in the middle of its $185.35 to $210.98 weekly range after a sharp move higher without a sustained trend, with volatility at 13.83%. Oscillator readings remain neutral overall, though Stochastic RSI is in the overbought zone at 88.28, highlighting a potential risk of near-term overheating. The price is pinned to the MA-50 at $199.1124, with the Ichimoku Kijun at $198.76 also acting as a support, while the nearest resistance is at $210.98. This setup suggests a pause within the broader uptrend, as trend-following signals diverge.
Breakout scenarios hinge on $210.98 resistance as range narrows next week
Next week, the expected range is $159.888 to $213.422121, with a 57% probability of an increase and a 43% chance of a decrease. The base case sees continued consolidation between support at $199.1124 and resistance at $210.98. A sustained break above $210.98 would be bullish, opening the way for further upside toward the range high. Conversely, price slipping below $199.1124 could trigger a move toward the lower end of the expected range.
Previously it was reported that Quant showed strong bullish momentum supported by robust corporate developments and institutional interest. The current setup adds a layer of caution, as technical signals highlight consolidation and potential exhaustion, making sustained moves above or below the $199.11 support key for near-term direction.










-
 Afghanistan
-
 Albania
-
 Algeria
-
 Angola
-
 Argentina
-
 Armenia
-
 Australia
-
 Austria
-
 Azerbaijan
-
 Bahamas
-
 Bahrain
-
 Bangladesh
-
 Belarus
-
 Belgium
-
 Bolivia
-
 Botswana
-
 Brazil
-
 Brunei
-
 Bulgaria
-
 Cambodia
-
 Cameroon
-
 Canada
-
 Chile
-
 China
-
 Colombia
-
 Congo
-
 Costa Rica
-
 Cote d'Ivoire
-
 Croatia
-
 Cuba
-
 Cyprus
-
 Czechia
-
 DR Congo
-
 Denmark
-
 Dominican Republic
-
 Ecuador
-
 Egypt
-
 El Salvador
-
 Estonia
-
 Eswatini
-
 Ethiopia
-
 Finland
-
 France
-
 Georgia
-
 Germany
-
 Ghana
-
 Greece
-
 Haiti
-
 Hong Kong
-
 Hungary
-
 India
-
 Indonesia
-
 Iran, Islamic republic
-
 Iraq
-
 Ireland
-
 Israel
-
 Italy
-
 Jamaica
-
 Japan
-
 Jordan
-
 Kazakhstan
-
 Kenya
-
 Korea
-
 Kuwait
-
 Kyrgyzstan
-
 Laos
-
 Latvia
-
 Lebanon
-
 Lesotho
-
 Libya
-
 Lithuania
-
 Luxembourg
-
 Madagascar
-
 Malaysia
-
 Malta
-
 Mauritius
-
 Mexico
-
 Moldova
-
 Mongolia
-
 Montenegro
-
 Morocco
-
 Mozambique
-
 Myanmar
-
 Namibia
-
 Nepal
-
 Netherlands
-
 New Zealand
-
 Nigeria
-
 North Macedonia
-
 Norway
-
 Oman
-
 Pakistan
-
 Palestine
-
 Panama
-
 Papua New Guinea
-
 Paraguay
-
 Peru
-
 Philippines
-
 Poland
-
 Portugal
-
 Puerto Rico
-
 Qatar
-
 Reunion
-
 Romania
-
 Rwanda
-
 Saudi Arabia
-
 Serbia
-
 Singapore
-
 Slovakia
-
 Slovenia
-
 Somalia
-
 South Africa
-
 Spain
-
 Sri Lanka
-
 Sweden
-
 Switzerland
-
 Syria
-
 Taiwan
-
 Tajikistan
-
 Tanzania
-
 Thailand
-
 Trinidad and Tobago
-
 Tunisia
-
 Turkey
-
 UAE
-
 Uganda
-
 Ukraine
-
 United Kingdom
-
United States
-
 Uruguay
-
 Uzbekistan
-
 Venezuela
-
 Vietnam
-
 Yemen
-
 Zambia
-
 Zimbabwe
- Forex
- Crypto












