

What's behind Jupiter's latest price surge?

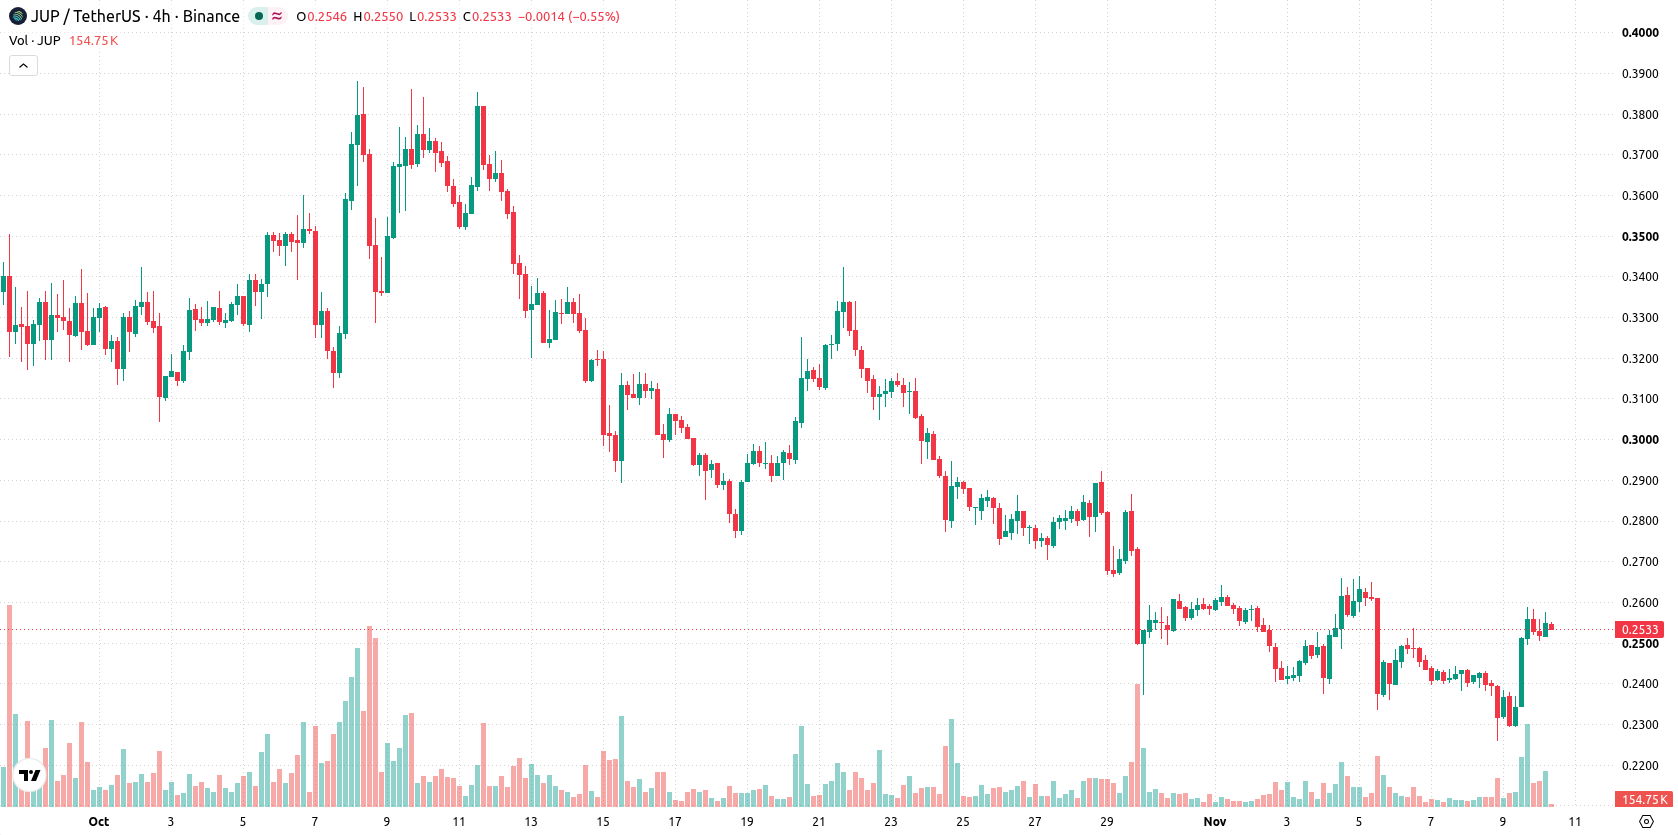
Jupiter (JUP) surged 9.92% today as technical momentum and intraday volatility drove fresh buying interest. The move looks limited, with the token still trading below its 20-day and 50-day moving averages.
 0.2574
0.2663
Highlights
- JUP/USD trades below its short- and medium-term moving averages but remains above its 200-day average, preserving a long-term bullish structure.
- Momentum indicators are mixed, with renewed selling pressure from MACD and ADX, while oscillators are neutral to overbought.
- JUP/USD is projected to trade between $0.2324 and $0.274 over the next five days, with neither upward nor downward breakout confirmed.
Mixed momentum and boundary pressures shape technical outlook
JUP/USD remains below its 20-day and 50-day moving averages ($0.2672 and $0.3033), while staying above the 200-day moving average ($0.2287), which suggests a bearish short- and medium-term structure but preserves bullish long-term alignment. The nearest ceiling is $0.2574 and the immediate floor is $0.2505, with distant overhead trend confirmation provided by the Ichimoku Kijun at $0.284 and the MA-50. Momentum signals are mixed; the MACD and Average Directional Index (ADX) both point to renewed selling pressure. The Relative Strength Index (RSI) and Commodity Channel Index (CCI) are both neutral, indicating neither overbought nor oversold conditions for those oscillators. The Stochastic RSI is in the overbought zone, which raises potential for an interim correction or pause in upside momentum. Bull/Bear Power (BBP) is slightly positive, showing buyers dominate intraday trade, and the Hull Moving Average signals a strong buy. JUP/USD is up $0.0229 or 9.92% today, opening with an upside gap of 9.53%. Price holds mid-range for the day, with intraday volatility reaching 2.75%. Trading began strong after the open, but momentum signals suggest caution as price consolidates.
In a recent review, Jupiter was highlighted for strong bullish momentum and increased speculative activity ahead of a service aggregation announcement. The current technical configuration introduces greater short-term uncertainty and signals that traders should closely monitor the $0.2574 resistance and $0.2505 support as pivotal levels for the next decisive move.










-
 Afghanistan
-
 Albania
-
 Algeria
-
 Angola
-
 Argentina
-
 Armenia
-
 Australia
-
 Austria
-
 Azerbaijan
-
 Bahamas
-
 Bahrain
-
 Bangladesh
-
 Belarus
-
 Belgium
-
 Bolivia
-
 Botswana
-
 Brazil
-
 Brunei
-
 Bulgaria
-
 Cambodia
-
 Cameroon
-
 Canada
-
 Chile
-
 China
-
 Colombia
-
 Congo
-
 Costa Rica
-
 Cote d'Ivoire
-
 Croatia
-
 Cuba
-
 Cyprus
-
 Czechia
-
 DR Congo
-
 Denmark
-
 Dominican Republic
-
 Ecuador
-
 Egypt
-
 El Salvador
-
 Estonia
-
 Eswatini
-
 Ethiopia
-
 Finland
-
 France
-
 Georgia
-
 Germany
-
 Ghana
-
 Greece
-
 Haiti
-
 Hong Kong
-
 Hungary
-
 India
-
 Indonesia
-
 Iran, Islamic republic
-
 Iraq
-
 Ireland
-
 Israel
-
 Italy
-
 Jamaica
-
 Japan
-
 Jordan
-
 Kazakhstan
-
 Kenya
-
 Korea
-
 Kuwait
-
 Kyrgyzstan
-
 Laos
-
 Latvia
-
 Lebanon
-
 Lesotho
-
 Libya
-
 Lithuania
-
 Luxembourg
-
 Madagascar
-
 Malaysia
-
 Malta
-
 Mauritius
-
 Mexico
-
 Moldova
-
 Mongolia
-
 Montenegro
-
 Morocco
-
 Mozambique
-
 Myanmar
-
 Namibia
-
 Nepal
-
 Netherlands
-
 New Zealand
-
 Nigeria
-
 North Macedonia
-
 Norway
-
 Oman
-
 Pakistan
-
 Palestine
-
 Panama
-
 Papua New Guinea
-
 Paraguay
-
 Peru
-
 Philippines
-
 Poland
-
 Portugal
-
 Puerto Rico
-
 Qatar
-
 Reunion
-
 Romania
-
 Rwanda
-
 Saudi Arabia
-
 Serbia
-
 Singapore
-
 Slovakia
-
 Slovenia
-
 Somalia
-
 South Africa
-
 Spain
-
 Sri Lanka
-
 Sweden
-
 Switzerland
-
 Syria
-
 Taiwan
-
 Tajikistan
-
 Tanzania
-
 Thailand
-
 Trinidad and Tobago
-
 Tunisia
-
 Turkey
-
 UAE
-
 Uganda
-
 Ukraine
-
 United Kingdom
-
United States
-
 Uruguay
-
 Uzbekistan
-
 Venezuela
-
 Vietnam
-
 Yemen
-
 Zambia
-
 Zimbabwe
- Forex
- Crypto












