
Nvidia stock: Advanced memory deal and upcoming earnings drive 2.30% gain

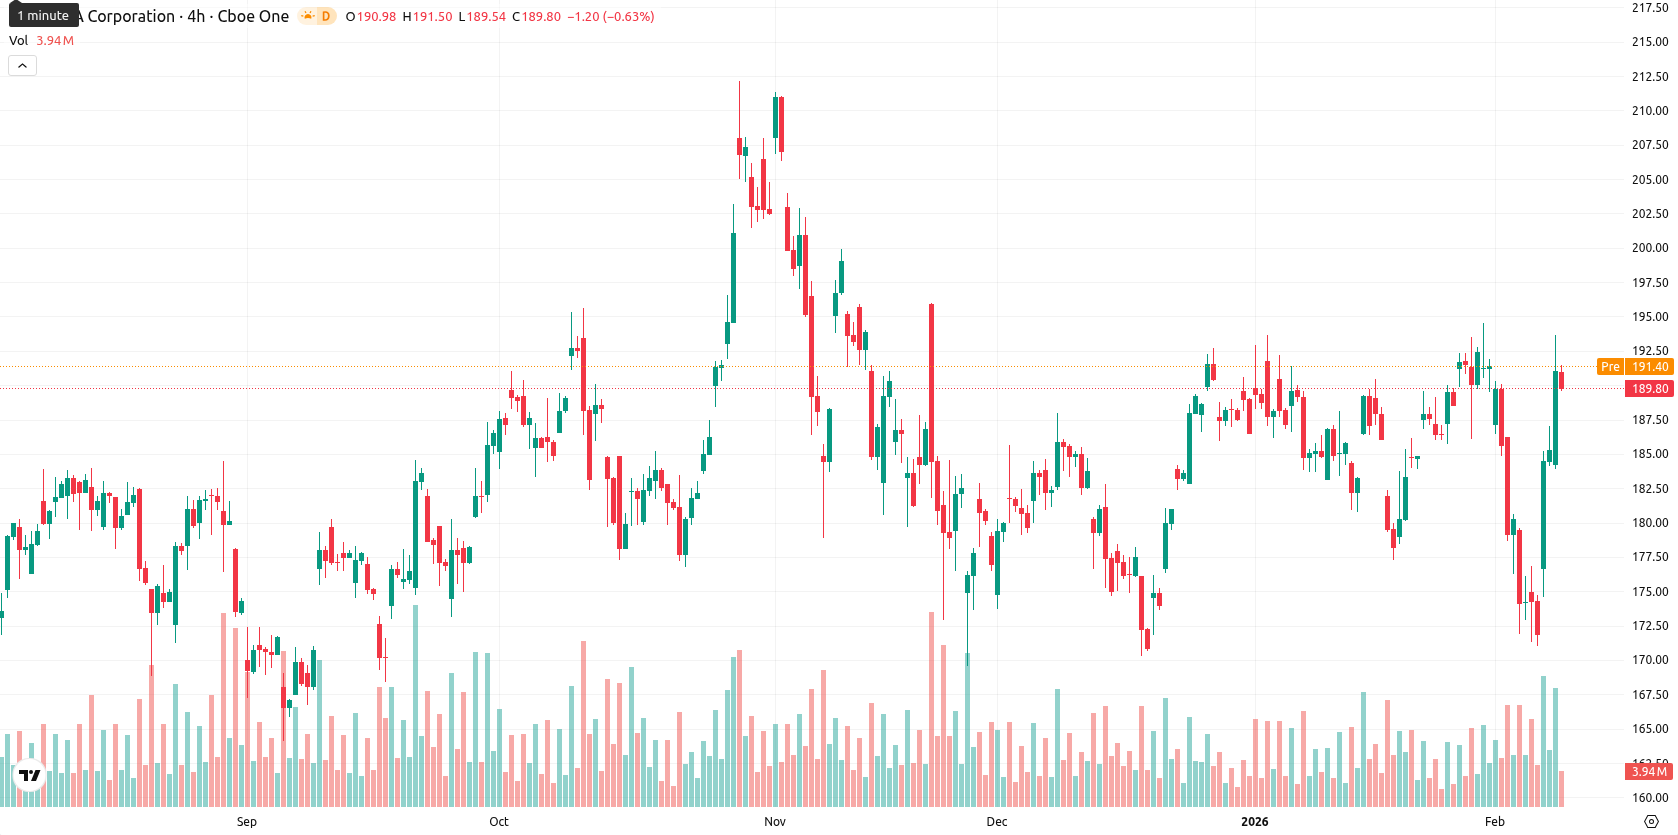
NVIDIA Corporation (NVDA) is trading at $190.04, showing a daily gain of $4.28 or 2.30%. The price remains firmly above MA-20 ($184.96), MA-50 ($183.82), and MA-200 ($170.11), confirming a bullish bias across all timeframes.
 212.56
212.56
212.56
Highlights
- Nvidia will report its Q4 and full-year fiscal 2026 earnings on February 25, 2026, amid rising investor focus on AI initiatives.
- The company announced new partnerships with major Korean firms to develop HBM4 memory supporting large-scale GPU deployments for sovereign AI in South Korea.
- Nvidia trades at $190.04, above support levels (Ichimoku Kijun $182.74), with expected consolidation between $187–$193 and an 80%+ probability of further gains.
Earnings anticipation and Korean partnerships spur focus on AI expansion
Nvidia is preparing to report its fourth-quarter and full-year fiscal 2026 earnings on February 25, 2026. The company recently announced partnerships with leading Korean firms for the development of advanced memory technology (HBM4), supporting large-scale GPU deployments for sovereign AI initiatives in South Korea. Nvidia also faces ongoing industry challenges around power and cooling needs as it ramps up next-generation data center infrastructure.
Mixed momentum and overbought signals as volatility heightens near resistance
The nearest dynamic support is located at the Ichimoku Kijun level of $182.74, with MA-50 and the round number at $190 acting as immediate resistance. Technical momentum is mixed: MACD on the daily chart signals a sell while ADX reads neutral, underscoring limited trend strength. The Relative Strength Index is moderately bullish at 55.33, but intraday indicators — Stochastic RSI (82.63) and Bull/Bear Power (9.36) — signal significant overbought conditions and strong buyer dominance. The Commodity Channel Index remains supportive at 76.66. However, the Awesome Oscillator does not confirm the uptrend, revealing a divergence between various oscillators. Today’s strong move was achieved with little to no gap at open, as the price closed near the session’s highs ($184.92 – $193.66), highlighting increased intraday volatility.
High upside probability as volatility band narrows and consolidation looms
Over the next five trading days, the expected volatility band relative to current levels is $186.90 to $193.50. The probability of further price increases remains high (above 80%), while downside risks are limited. Baseline scenario: price consolidates between $187 and $193 as mixed momentum prevails. A break above $193.50 may catalyze renewed buying, while a failure at $186.90 could trigger a pullback toward the Ichimoku Kijun at $182.74.
Last time, analysts noted that Nvidia remains in a bullish technical structure, with shares trading above key moving averages and the 50-day average firmly above the 200-day, indicating sustained institutional demand. Momentum indicators such as the RSI are supportive of further gains, while the $175–$180 area acts as key support and resistance is seen near $200 and in the $212–$220 range.









-
 Afghanistan
-
 Albania
-
 Algeria
-
 Angola
-
 Argentina
-
 Armenia
-
 Australia
-
 Austria
-
 Azerbaijan
-
 Bahamas
-
 Bahrain
-
 Bangladesh
-
 Belarus
-
 Belgium
-
 Bolivia
-
 Botswana
-
 Brazil
-
 Brunei
-
 Bulgaria
-
 Cambodia
-
 Cameroon
-
 Canada
-
 Chile
Chile
-
 China
China
-
 Colombia
-
 Congo
Congo
-
 Costa Rica
-
 Cote d'Ivoire
-
 Croatia
-
 Cuba
Cuba
-
 Cyprus
-
 Czechia
-
 DR Congo
-
 Denmark
-
 Dominican Republic
-
 Ecuador
-
 Egypt
Egypt
-
 El Salvador
-
 Estonia
-
 Eswatini
-
 Ethiopia
-
 Finland
-
 France
-
 Georgia
-
 Germany
-
 Ghana
Ghana
-
 Greece
-
 Haiti
Haiti
-
 Hong Kong
-
 Hungary
-
 India
India
-
 Indonesia
-
 Iran, Islamic republic
-
 Iraq
Iraq
-
 Ireland
-
 Israel
-
 Italy
Italy
-
 Jamaica
-
 Japan
Japan
-
 Jordan
-
 Kazakhstan
-
 Kenya
Kenya
-
 Korea
Korea
-
 Kuwait
-
 Kyrgyzstan
-
 Laos
Laos
-
 Latvia
-
 Lebanon
-
 Lesotho
-
 Libya
Libya
-
 Lithuania
-
 Luxembourg
-
 Madagascar
-
 Malaysia
-
 Malta
Malta
-
 Mauritius
-
 Mexico
-
 Moldova
-
 Mongolia
-
 Montenegro
-
 Morocco
-
 Mozambique
-
 Myanmar
-
 Namibia
-
 Nepal
Nepal
-
 Netherlands
-
 New Zealand
-
 Nigeria
-
 North Macedonia
-
 Norway
-
 Oman
Oman
-
 Pakistan
-
 Palestine
-
 Panama
-
 Papua New Guinea
-
 Paraguay
-
 Peru
Peru
-
 Philippines
-
 Poland
-
 Portugal
-
 Puerto Rico
-
 Qatar
Qatar
-
 Reunion
-
 Romania
-
 Rwanda
-
 Saudi Arabia
-
 Serbia
-
 Singapore
-
 Slovakia
-
 Slovenia
-
 Somalia
-
 South Africa
-
 Spain
Spain
-
 Sri Lanka
-
 Sweden
-
 Switzerland
-
 Syria
Syria
-
 Taiwan
-
 Tajikistan
-
 Tanzania
-
 Thailand
-
 Trinidad and Tobago
-
 Tunisia
-
 Turkey
-
 UAE
UAE
-
 Uganda
-
 Ukraine
-
 United Kingdom
-
United States
-
 Uruguay
-
 Uzbekistan
-
 Venezuela
-
 Vietnam
-
 Yemen
Yemen
-
 Zambia
-
 Zimbabwe
- Forex
- Crypto











