
Nvidia stock climbs as chip supply chain reels from Strait of Hormuz tensions

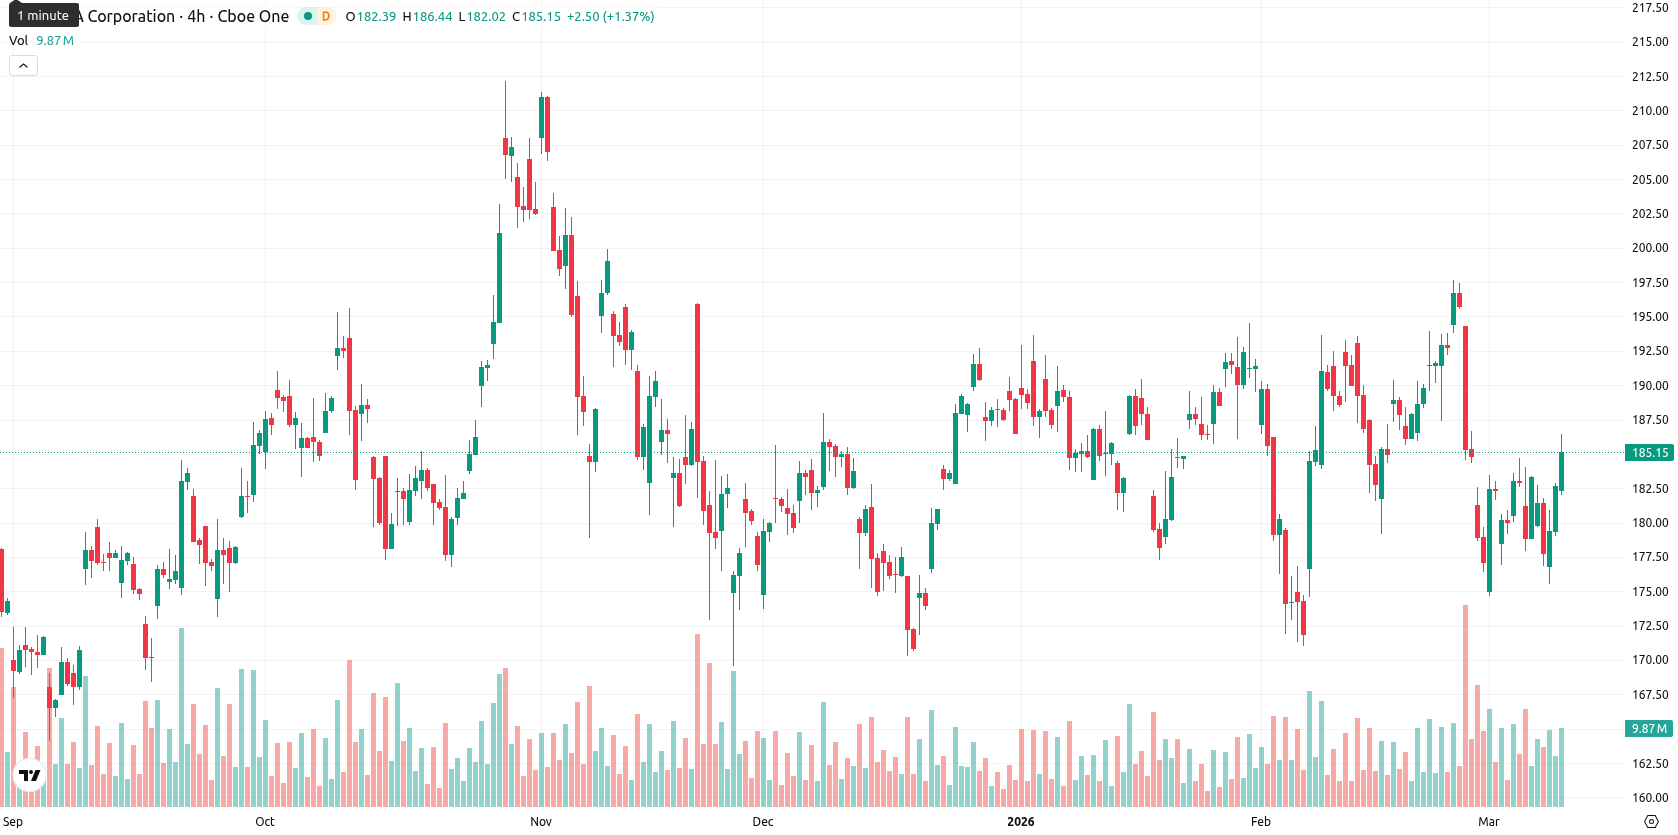
NVIDIA Corporation (NVDA) is trading at $185.57, up 1.74% on the day. The price is slightly below both the SMA-20 ($185.98) and SMA-50 ($185.87), but remains well above the SMA-200 ($176.37), highlighting near-term seller pressure while preserving long-term support.
 212.56
212.56
212.56
Highlights
- Escalating military conflict in the Middle East has disrupted key semiconductor supply chains, threatening Nvidia's production continuity and costs.
- Soaring oil prices above $100 per barrel are increasing input costs and inflationary pressures across Nvidia and the broader technology sector.
- NVDA is trading in a consolidation range with a projected 5-day span of $182.50–$189.50, and technicals signal high probability of an upward move pending resistance at $186–$189.
Chip supply disruptions and rising costs as conflict escalates in Middle East
On March 9, 2026, escalating military conflict in the Middle East has disrupted key segments of the global chip supply chain, directly impacting semiconductor suppliers such as TSMC, SK Hynix, and Samsung, which Nvidia relies upon for the manufacturing of its graphics processing units. The resulting supply chain instability, coupled with a surge in oil prices above $100 per barrel due to disruptions around the Strait of Hormuz, is increasing production costs and fueling inflationary pressures for Nvidia and the broader technology sector. Heightened geopolitical uncertainty from these events is raising operational and distribution risks for Nvidia, threatening both the continuity and affordability of semiconductor production.
Mixed short-term momentum amid medium resistance and oversold signals
Technically, NVDA's current close is just below its 20- and 50-day moving averages, with the 200-day MA far lower, suggesting persistent short- and medium-term resistance but reinforced long-term structural support. The Ichimoku Kijun at $184.33 offers immediate backing for prices. Daily momentum indicators remain mixed: MACD signals a sell, while a low and neutral ADX points to weak trend stability. Oscillators like RSI (47.62) and CCI (-85.36) show mild bearishness but avoid extreme conditions; meanwhile, both Stoch RSI and Bull/Bear Power classifiers place the asset in oversold territory, highlighting increased potential for buying interest. After a gap at the open, NVDA is trading near session highs on moderate volatility, hinting at persistent buyer control despite diverging short-term oscillator signals.
Bullish breakout potential grows as indicators favor upward move
Over the next five trading days, NVDA is likely to remain in a price band between $182.50 and $189.50, representing the typical volatility range relative to current levels. The probability of an upward move is high (above 80%), as all four weekly indicators — RSI, ADX, MACD, and the 50-day moving average — are bullish. The baseline scenario is continued sideways trading just below recent highs, but a bullish breakout could occur above the $186–$189 resistance zone. A bearish reversal would likely test support near the $184 level.
Previously it was reported that NVIDIA is currently trading below its short- and medium-term moving averages but remains above its long-term trend, with immediate resistance at $184.33 and support near the SMA-200. Mixed momentum indicators—including a sell-biased MACD, low-conviction ADX, and mildly oversold RSI and CCI—suggest rangebound trading within a $180–$187.50 band, reflecting uncertainty and favoring a sideways consolidation.









-
 Afghanistan
-
 Albania
-
 Algeria
-
 Angola
-
 Argentina
-
 Armenia
-
 Australia
-
 Austria
-
 Azerbaijan
-
 Bahamas
-
 Bahrain
-
 Bangladesh
-
 Belarus
-
 Belgium
-
 Bolivia
-
 Botswana
-
 Brazil
-
 Brunei
-
 Bulgaria
-
 Cambodia
-
 Cameroon
-
 Canada
-
 Chile
Chile
-
 China
China
-
 Colombia
-
 Congo
Congo
-
 Costa Rica
-
 Cote d'Ivoire
-
 Croatia
-
 Cuba
Cuba
-
 Cyprus
-
 Czechia
-
 DR Congo
-
 Denmark
-
 Dominican Republic
-
 Ecuador
-
 Egypt
Egypt
-
 El Salvador
-
 Estonia
-
 Eswatini
-
 Ethiopia
-
 Finland
-
 France
-
 Georgia
-
 Germany
-
 Ghana
Ghana
-
 Greece
-
 Haiti
Haiti
-
 Hong Kong
-
 Hungary
-
 India
India
-
 Indonesia
-
 Iran, Islamic republic
-
 Iraq
Iraq
-
 Ireland
-
 Israel
-
 Italy
Italy
-
 Jamaica
-
 Japan
Japan
-
 Jordan
-
 Kazakhstan
-
 Kenya
Kenya
-
 Korea
Korea
-
 Kuwait
-
 Kyrgyzstan
-
 Laos
Laos
-
 Latvia
-
 Lebanon
-
 Lesotho
-
 Libya
Libya
-
 Lithuania
-
 Luxembourg
-
 Madagascar
-
 Malaysia
-
 Malta
Malta
-
 Mauritius
-
 Mexico
-
 Moldova
-
 Mongolia
-
 Montenegro
-
 Morocco
-
 Mozambique
-
 Myanmar
-
 Namibia
-
 Nepal
Nepal
-
 Netherlands
-
 New Zealand
-
 Nigeria
-
 North Macedonia
-
 Norway
-
 Oman
Oman
-
 Pakistan
-
 Palestine
-
 Panama
-
 Papua New Guinea
-
 Paraguay
-
 Peru
Peru
-
 Philippines
-
 Poland
-
 Portugal
-
 Puerto Rico
-
 Qatar
Qatar
-
 Reunion
-
 Romania
-
 Rwanda
-
 Saudi Arabia
-
 Serbia
-
 Singapore
-
 Slovakia
-
 Slovenia
-
 Somalia
-
 South Africa
-
 Spain
Spain
-
 Sri Lanka
-
 Sweden
-
 Switzerland
-
 Syria
Syria
-
 Taiwan
-
 Tajikistan
-
 Tanzania
-
 Thailand
-
 Trinidad and Tobago
-
 Tunisia
-
 Turkey
-
 UAE
UAE
-
 Uganda
-
 Ukraine
-
 United Kingdom
-
United States
-
 Uruguay
-
 Uzbekistan
-
 Venezuela
-
 Vietnam
-
 Yemen
Yemen
-
 Zambia
-
 Zimbabwe
- Forex
- Crypto











