
Silver AI price forecast: Price steadies near $88 as consolidation takes shape
Silver is trading near $88.32 after rebounding from the recent pullback that briefly pushed the metal toward the $84 region. The market has gradually recovered over the past sessions, with prices moving back above several short-term moving averages as buying interest returned.
The immediate structure has shifted toward stabilization. Silver is currently trading above the 20-period EMA near $87.19 and the 50-period EMA around $86.28, while the 100-period EMA sits close to $85.88. These moving averages are now forming a layered support zone beneath the current price, suggesting that the recent rebound has started to rebuild momentum.
Silver is currently holding the $87 to $88 region as near-term support following the recovery. The sequence of higher lows formed over the past many sessions indicates that selling pressure has eased, although resistance near the $89 to $90 area could slow further upside expansion.Near-term models suggest the market may continue consolidating between $87 and $90 unless a clear breakout above resistance triggers a stronger upward move.
Chart and technical overview
Silver is trading above the 20, 50, and 100-period EMAs, indicating that short-term momentum has improved after the earlier decline. The 20-period EMA sits near $87.19, the 50-period EMA around $86.28, and the 100-period EMA close to $85.88. The 200-period EMA remains slightly below the current price structure and continues to support the broader recovery pattern.RSI is currently hovering around the mid-50s, indicating moderate momentum after recovering from weaker readings earlier in the week. The oscillator has started to stabilize rather than accelerate, proposing the market may enter a short period of sideways movement before the next directional attempt.
Immediate support sits near $87, followed by $86 and then $85.80. Resistance is forming near $89, with the next major barrier appearing around the $90 region. Market structure reflects stabilization following the previous pullback rather than a continuation of the earlier decline.
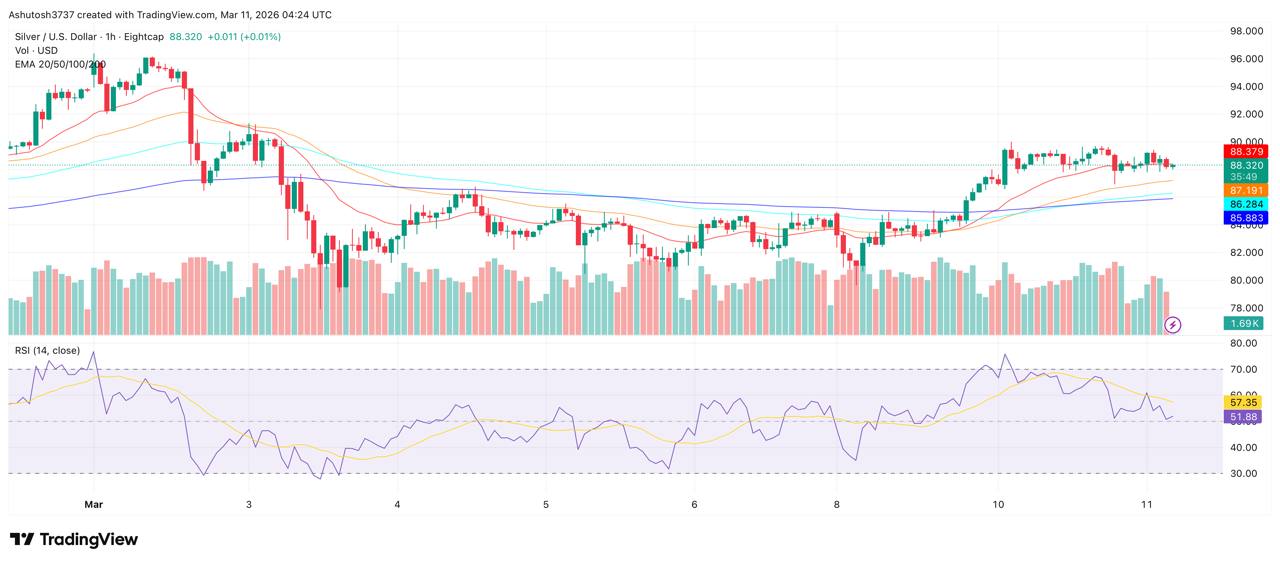
Silver price dynamics (Source: TradingView)
Technical summary
- Trend. Slightly bullish while trading above $87.
- Momentum reading. Stabilizing with RSI holding in the mid-range.
- Market structure. Recovery phase following the decline toward $84.
- Support and resistance. Support at $87 and $86. Resistance near $89 and $90.
- Risk trigger. A sustained move above $90 would strengthen bullish momentum. A break below $85 would increase downside pressure.
- Technical bias. Consolidation with gradual recovery potential.
Fundamental pulse
Silver sentiment often moves alongside broader precious metals demand and macroeconomic conditions. The metal plays a dual role as both an industrial material and a monetary asset, meaning its price is influenced by manufacturing demand as well as investment flows.Industrial demand for silver remains closely tied to sectors such as electronics, solar technology, and semiconductor manufacturing. As these industries expand, they continue to contribute to structural demand for the metal.
At the same time, investors typically monitor inflation expectations, currency movements, and interest rate trends when assessing precious metals. Changes in these macro conditions can influence short-term sentiment and trading activity.
Summary section
Silver is consolidating near $88 after recovering from the earlier decline toward the $84 region. As long as the price remains above the $87 support band, the current move is likely to be viewed as stabilization rather than the beginning of a renewed downtrend.What’s next
- Upside trigger. A sustained move above $89 could open the path toward $90 and potentially the $92 region.
- Downside risk. A decisive break below $85 would increase the probability of a deeper retracement toward $83.


Latest Silver News






-
 Afghanistan
-
 Albania
-
 Algeria
-
 Angola
-
 Argentina
-
 Armenia
-
 Australia
-
 Austria
-
 Azerbaijan
-
 Bahamas
-
 Bahrain
-
 Bangladesh
-
 Belarus
-
 Belgium
-
 Bolivia
-
 Botswana
-
 Brazil
-
 Brunei
-
 Bulgaria
-
 Cambodia
-
 Cameroon
-
 Canada
-
 Chile
Chile
-
 China
China
-
 Colombia
-
 Congo
Congo
-
 Costa Rica
-
 Cote d'Ivoire
-
 Croatia
-
 Cuba
Cuba
-
 Cyprus
-
 Czechia
-
 DR Congo
-
 Denmark
-
 Dominican Republic
-
 Ecuador
-
 Egypt
Egypt
-
 El Salvador
-
 Estonia
-
 Eswatini
-
 Ethiopia
-
 Finland
-
 France
-
 Georgia
-
 Germany
-
 Ghana
Ghana
-
 Greece
-
 Haiti
Haiti
-
 Hong Kong
-
 Hungary
-
 India
India
-
 Indonesia
-
 Iran, Islamic republic
-
 Iraq
Iraq
-
 Ireland
-
 Israel
-
 Italy
Italy
-
 Jamaica
-
 Japan
Japan
-
 Jordan
-
 Kazakhstan
-
 Kenya
Kenya
-
 Korea
Korea
-
 Kuwait
-
 Kyrgyzstan
-
 Laos
Laos
-
 Latvia
-
 Lebanon
-
 Lesotho
-
 Libya
Libya
-
 Lithuania
-
 Luxembourg
-
 Madagascar
-
 Malaysia
-
 Malta
Malta
-
 Mauritius
-
 Mexico
-
 Moldova
-
 Mongolia
-
 Montenegro
-
 Morocco
-
 Mozambique
-
 Myanmar
-
 Namibia
-
 Nepal
Nepal
-
 Netherlands
-
 New Zealand
-
 Nigeria
-
 North Macedonia
-
 Norway
-
 Oman
Oman
-
 Pakistan
-
 Palestine
-
 Panama
-
 Papua New Guinea
-
 Paraguay
-
 Peru
Peru
-
 Philippines
-
 Poland
-
 Portugal
-
 Puerto Rico
-
 Qatar
Qatar
-
 Reunion
-
 Romania
-
 Rwanda
-
 Saudi Arabia
-
 Serbia
-
 Singapore
-
 Slovakia
-
 Slovenia
-
 Somalia
-
 South Africa
-
 Spain
Spain
-
 Sri Lanka
-
 Sweden
-
 Switzerland
-
 Syria
Syria
-
 Taiwan
-
 Tajikistan
-
 Tanzania
-
 Thailand
-
 Trinidad and Tobago
-
 Tunisia
-
 Turkey
-
 UAE
UAE
-
 Uganda
-
 Ukraine
-
 United Kingdom
-
United States
-
 Uruguay
-
 Uzbekistan
-
 Venezuela
-
 Vietnam
-
 Yemen
Yemen
-
 Zambia
-
 Zimbabwe
- Forex
- Crypto











