
Intuit stock falls 3.21% as Premier Fund Managers reduces stake

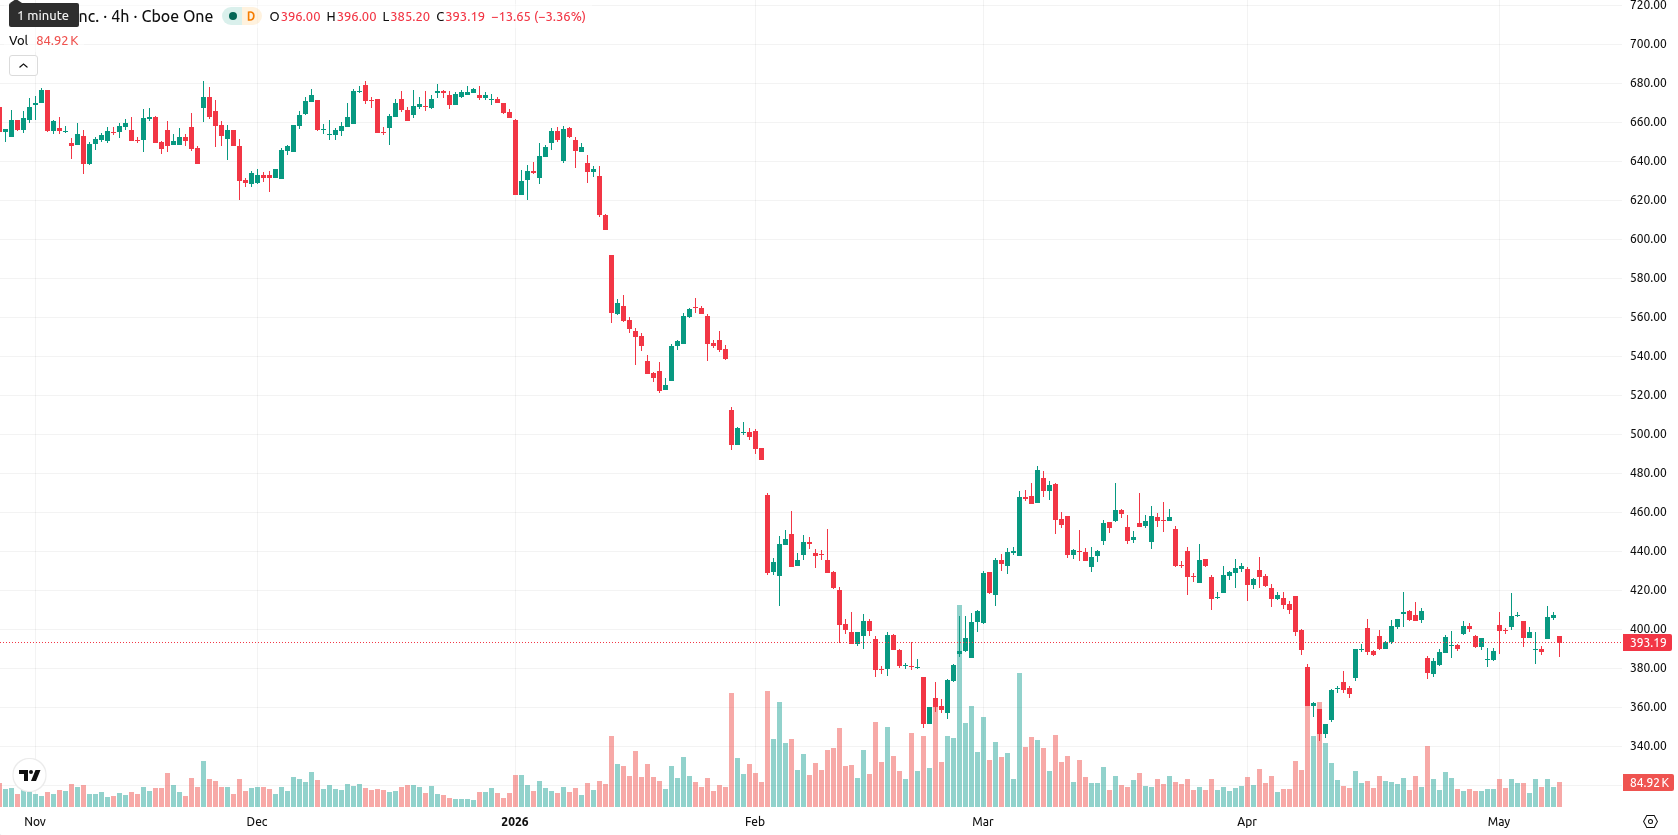
Intuit Inc. (INTU) is trading at $394.83 after a daily decline of 3.21%. The price currently sits above its short-term moving average but remains below longer-term averages.
Highlights
- Intuit exceeded analyst expectations with Q2 FY26 EPS of $4.15 and revenue up 17.4% year-over-year to $4.65 billion.
- The company expanded its SMB product offering through the launch of AI-powered QuickBooks Workforce and a Vestwell partnership for integrated 401(k) solutions.
- Technical signals indicate sustained selling pressure, with INTU likely to trade between $375.00 and $410.00 and an 80% probability of further downside.
Earnings beat sparks product expansion amid outflows and persistent selling
Intuit reported second-quarter fiscal year 2026 earnings with EPS of $4.15 and revenue reaching $4.65 billion, both surpassing consensus estimates and showing a 17.4% increase year-over-year. The company also launched QuickBooks Workforce, an AI-driven human capital management platform, and partnered with Vestwell to integrate 401(k) solutions into QuickBooks, broadening its suite of products for small and medium-sized businesses. Additionally, Credit Karma announced an initiative to improve credit access for credit-invisible Americans, while Premier Fund Managers Ltd disclosed a 19.3% reduction in its stake during the fourth quarter. These corporate actions occurred as price action has remained under broader selling pressure.
Mixed signals as short-term strength collides with bearish momentum
The $394.83 level places INTU above its 20-day simple moving average ($391.42), but the price remains below the 50-day ($416.77) and is far under the 200-day ($581.62). The Ichimoku Kijun at $389.45 is the nearest support. Momentum readings are mixed: MACD on both daily and weekly timeframes indicate strong bearish momentum, and while the ADX is neutral on D1, sell signals persist on longer timeframes. Daily RSI is mildly positive, but the weekly RSI sits low at 38.54. Stoch RSI is overbought, indicating possible exhaustion in the recent rebound. CCI suggests a tentative buy, yet BBP is overbought, and the Awesome Oscillator remains noncommittal. The session opened with a pronounced gap down, and INTU is currently near the upper half of today’s range amid elevated volatility.
Renewed downside risk as range-bound outlook dominates
For the next five trading days, price is expected to fluctuate within a typical volatility band of $375.00 to $410.00. There is a very high probability (over 80%) of renewed downside, with a low likelihood of a significant rebound. The base scenario is continued sideways action between immediate support and resistance. A bullish scenario would require a breakout above $410.00, while a break below $375.00 would expose further selling risk.
Previously, analysts noted persistent bearish momentum and heightened risk of reversal for Intuit despite notable corporate initiatives. The latest earnings beat and continued volatility reinforce this cautious outlook, making a close watch on the $410.00 resistance and $375.00 support critical for potential breakout or breakdown scenarios in the near term.


Latest Intuit News


-
 Afghanistan
-
 Albania
-
 Algeria
-
 Angola
-
 Argentina
-
 Armenia
-
 Australia
-
 Austria
-
 Azerbaijan
-
 Bahamas
-
 Bahrain
-
 Bangladesh
-
 Belarus
-
 Belgium
-
 Bolivia
-
 Botswana
-
 Brazil
-
 Brunei
-
 Bulgaria
-
 Cambodia
-
 Cameroon
-
 Canada
-
 Chile
Chile
-
 China
China
-
 Colombia
-
 Congo
Congo
-
 Costa Rica
-
 Cote d'Ivoire
-
 Croatia
-
 Cuba
Cuba
-
 Cyprus
-
 Czechia
-
 DR Congo
-
 Denmark
-
 Dominican Republic
-
 Ecuador
-
 Egypt
Egypt
-
 El Salvador
-
 Estonia
-
 Eswatini
-
 Ethiopia
-
 Finland
-
 France
-
 Georgia
-
 Germany
-
 Ghana
Ghana
-
 Greece
-
 Haiti
Haiti
-
 Hong Kong
-
 Hungary
-
 India
India
-
 Indonesia
-
 Iran, Islamic republic
-
 Iraq
Iraq
-
 Ireland
-
 Israel
-
 Italy
Italy
-
 Jamaica
-
 Japan
Japan
-
 Jordan
-
 Kazakhstan
-
 Kenya
Kenya
-
 Korea
Korea
-
 Kuwait
-
 Kyrgyzstan
-
 Laos
Laos
-
 Latvia
-
 Lebanon
-
 Lesotho
-
 Libya
Libya
-
 Lithuania
-
 Luxembourg
-
 Madagascar
-
 Malaysia
-
 Malta
Malta
-
 Mauritius
-
 Mexico
-
 Moldova
-
 Mongolia
-
 Montenegro
-
 Morocco
-
 Mozambique
-
 Myanmar
-
 Namibia
-
 Nepal
Nepal
-
 Netherlands
-
 New Zealand
-
 Nigeria
-
 North Macedonia
-
 Norway
-
 Oman
Oman
-
 Pakistan
-
 Palestine
-
 Panama
-
 Papua New Guinea
-
 Paraguay
-
 Peru
Peru
-
 Philippines
-
 Poland
-
 Portugal
-
 Puerto Rico
-
 Qatar
Qatar
-
 Reunion
-
 Romania
-
 Rwanda
-
 Saudi Arabia
-
 Serbia
-
 Singapore
-
 Slovakia
-
 Slovenia
-
 Somalia
-
 South Africa
-
 Spain
Spain
-
 Sri Lanka
-
 Sweden
-
 Switzerland
-
 Syria
Syria
-
 Taiwan
-
 Tajikistan
-
 Tanzania
-
 Thailand
-
 Trinidad and Tobago
-
 Tunisia
-
 Turkey
-
 UAE
UAE
-
 Uganda
-
 Ukraine
-
 United Kingdom
-
United States
-
 Uruguay
-
 Uzbekistan
-
 Venezuela
-
 Vietnam
-
 Yemen
Yemen
-
 Zambia
-
 Zimbabwe
- Forex
- Crypto
