
Monopar Therapeutics stock price forecast: Holding $60.25 support as MNPR declines 2.47%

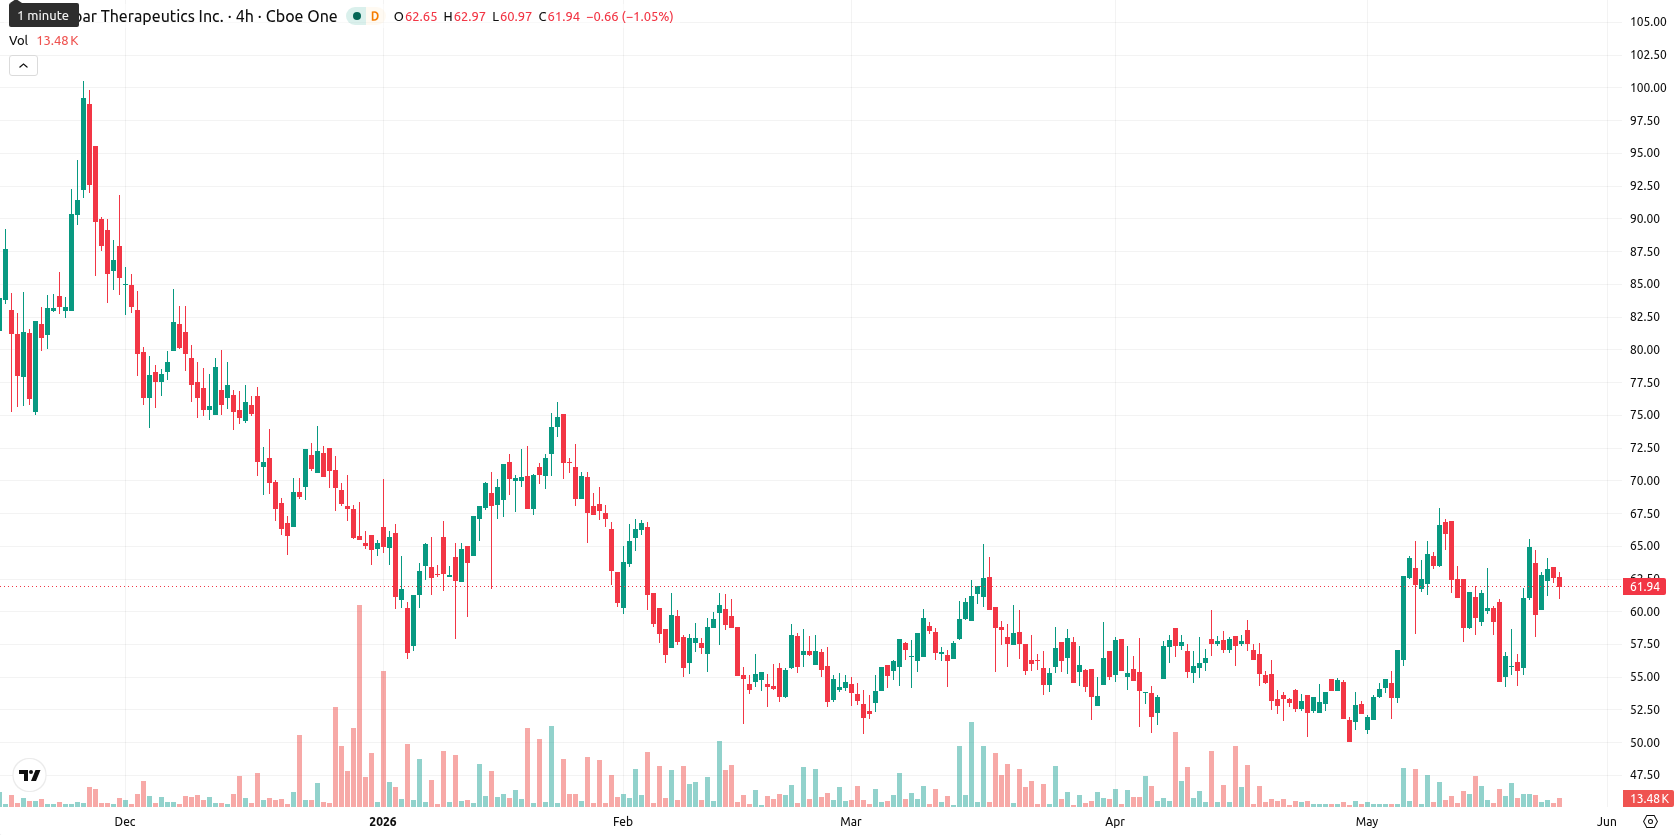
Monopar Therapeutics Inc. (MNPR) stock is trading at $61.70, registering a daily decline of 2.47%. The price currently sits above its key short- and medium-term moving averages, while staying just below the long-term threshold.
Highlights
- MNPR maintains short- and medium-term bullish momentum, trading above key moving averages but below longer-term resistance.
- Momentum indicators show moderate bullish bias, yet the intraday session is under pressure, revealing divergence and near-term exhaustion risk.
- For the next five sessions, expect tight range-bound trading between $60.25 and $62.50, with a greater likelihood of downside movement.
Momentum divergence as bullish signals confront intraday weakness
Technically, MNPR is trading above the SMA-20 ($58.82) and SMA-50 ($57.19), while remaining below the SMA-200 ($64.10). The Ichimoku Kijun on the D1 timeframe stands at $58.99, acting as immediate support. Momentum readings show a bullish MACD on both daily and most intraday timeframes, with a neutral ADX indicating that trend strength is limited. The RSI is at 57.67 and CCI at 75.47, both placing the stock in bullish territory but not yet overbought. Stochastic RSI is neutral, and BBP registers as overbought, suggesting dominance by buyers but some near-term caution. The Awesome Oscillator supports the daily uptrend, though today’s price opened with a minor downside gap and now trades near the session’s intraday low, indicating moderate volatility and some immediate pressure. Overall, there is notable divergence, as strong momentum indicators are contrasted by bearish intraday price action.
Sideways bias prevails as upside risks fade below resistance
For the next five sessions, MNPR is expected to trade within a $60.25–$62.50 band, in line with typical volatility relative to current levels. Weekly indicators including RSI, ADX, MACD, and MA-50 point to low probability (less than 20%) for further upside, implying that renewed downside is more likely in the near term. The baseline view is for price to oscillate in a tight sideways range, with buyers and sellers competing for short-term direction. A decisive move above $62.50 would signal a potential test of the $64.00 region, while a sustained break below $60.25 would likely open the way for a deeper pullback toward medium-term moving averages.


Latest Monopar Therapeutics News


-
 Afghanistan
-
 Albania
-
 Algeria
-
 Angola
-
 Argentina
-
 Armenia
-
 Australia
-
 Austria
-
 Azerbaijan
-
 Bahamas
-
 Bahrain
-
 Bangladesh
-
 Belarus
-
 Belgium
-
 Bolivia
-
 Botswana
-
 Brazil
-
 Brunei
-
 Bulgaria
-
 Cambodia
-
 Cameroon
-
 Canada
-
 Chile
Chile
-
 China
China
-
 Colombia
-
 Congo
Congo
-
 Costa Rica
-
 Cote d'Ivoire
-
 Croatia
-
 Cuba
Cuba
-
 Cyprus
-
 Czechia
-
 DR Congo
-
 Denmark
-
 Dominican Republic
-
 Ecuador
-
 Egypt
Egypt
-
 El Salvador
-
 Estonia
-
 Eswatini
-
 Ethiopia
-
 Finland
-
 France
-
 Georgia
-
 Germany
-
 Ghana
Ghana
-
 Greece
-
 Haiti
Haiti
-
 Hong Kong
-
 Hungary
-
 India
India
-
 Indonesia
-
 Iran, Islamic republic
-
 Iraq
Iraq
-
 Ireland
-
 Israel
-
 Italy
Italy
-
 Jamaica
-
 Japan
Japan
-
 Jordan
-
 Kazakhstan
-
 Kenya
Kenya
-
 Korea
Korea
-
 Kuwait
-
 Kyrgyzstan
-
 Laos
Laos
-
 Latvia
-
 Lebanon
-
 Lesotho
-
 Libya
Libya
-
 Lithuania
-
 Luxembourg
-
 Madagascar
-
 Malaysia
-
 Malta
Malta
-
 Mauritius
-
 Mexico
-
 Moldova
-
 Mongolia
-
 Montenegro
-
 Morocco
-
 Mozambique
-
 Myanmar
-
 Namibia
-
 Nepal
Nepal
-
 Netherlands
-
 New Zealand
-
 Nigeria
-
 North Macedonia
-
 Norway
-
 Oman
Oman
-
 Pakistan
-
 Palestine
-
 Panama
-
 Papua New Guinea
-
 Paraguay
-
 Peru
Peru
-
 Philippines
-
 Poland
-
 Portugal
-
 Puerto Rico
-
 Qatar
Qatar
-
 Reunion
-
 Romania
-
 Rwanda
-
 Saudi Arabia
-
 Serbia
-
 Singapore
-
 Slovakia
-
 Slovenia
-
 Somalia
-
 South Africa
-
 Spain
Spain
-
 Sri Lanka
-
 Sweden
-
 Switzerland
-
 Syria
Syria
-
 Taiwan
-
 Tajikistan
-
 Tanzania
-
 Thailand
-
 Trinidad and Tobago
-
 Tunisia
-
 Turkey
-
 UAE
UAE
-
 Uganda
-
 Ukraine
-
 United Kingdom
-
United States
-
 Uruguay
-
 Uzbekistan
-
 Venezuela
-
 Vietnam
-
 Yemen
Yemen
-
 Zambia
-
 Zimbabwe
- Forex
- Crypto
