
A dominant selling trend pressures Bit Digital stock to a sharp decline

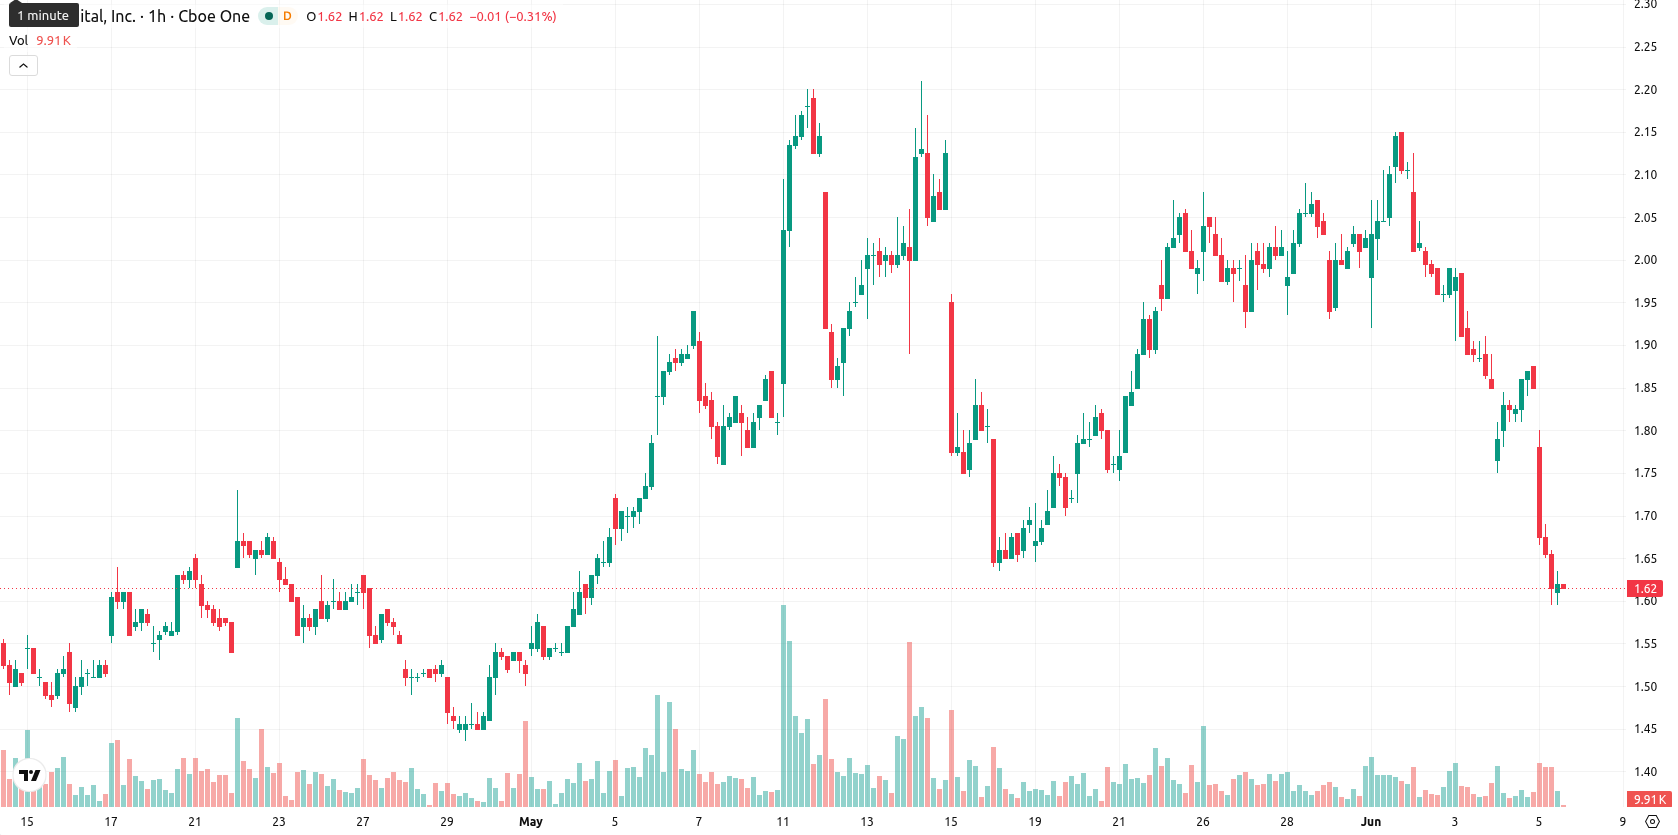
Bit Digital Inc (BTBT) stock is trading at $1.62, marking a daily decline of 12.41%. The price remains positioned below its key moving averages, signaling continued pressure from short-term and long-term trends.
Highlights
- BTBT remains under significant bearish pressure as price trades below all key moving averages across daily and intraday charts.
- Momentum and oscillator signals confirm strong seller dominance, with multiple indicators in oversold territory and no divergence suggesting reversal.
- Price closed at $1.62, down 12.41%, with a projected trading range of $1.42 to $1.80 and risk skewed toward further downside.
Bearish momentum prevails as BTBT tests multiple resistance levels
On the hourly chart, BTBT is trading below the MA-20 at $1.83 and the MA-50 at $1.95, while also remaining under the long-term MA-200 at $2.30 on the daily timeframe. The Ichimoku Kijun level stands at $1.86 and acts as immediate resistance. Momentum signals are clearly negative, with the MACD and ADX both indicating a sell bias. The RSI is at 21.02, with both Stoch RSI and CCI confirming oversold conditions. BBP shows strong seller dominance intraday, and the Awesome Oscillator supports the prevailing downtrend. No notable divergences between oscillators and trend indicators are present.
Sideways bias with heightened downside risks barring resistance breakout
Over the next several trading days, BTBT is expected to trade within a typical volatility band between $1.42 and $1.80. The probability of an upward move is very low, while downside risk remains elevated, and the baseline scenario is that price continues sideways within this range. If BTBT breaks above the $1.86 Ichimoku Kijun resistance, it could trigger potential upward momentum, while a drop below $1.42 would expose the stock to further declines.
Earlier, analysts noted that Bit Digital faced persistent downside risk amid mixed technical signals and heightened volatility. The confirmation of a strongly bearish momentum profile now increases the importance of monitoring for any potential break below $1.42, as this would expose the stock to further significant declines.


Latest Bit Digital News


-
 Afghanistan
-
 Albania
-
 Algeria
-
 Angola
-
 Argentina
-
 Armenia
-
 Australia
-
 Austria
-
 Azerbaijan
-
 Bahamas
-
 Bahrain
-
 Bangladesh
-
 Belarus
-
 Belgium
-
 Bolivia
-
 Botswana
-
 Brazil
-
 Brunei
-
 Bulgaria
-
 Cambodia
-
 Cameroon
-
 Canada
-
 Chile
Chile
-
 China
China
-
 Colombia
-
 Congo
Congo
-
 Costa Rica
-
 Cote d'Ivoire
-
 Croatia
-
 Cuba
Cuba
-
 Cyprus
-
 Czechia
-
 DR Congo
-
 Denmark
-
 Dominican Republic
-
 Ecuador
-
 Egypt
Egypt
-
 El Salvador
-
 Estonia
-
 Eswatini
-
 Ethiopia
-
 Finland
-
 France
-
 Georgia
-
 Germany
-
 Ghana
Ghana
-
 Greece
-
 Haiti
Haiti
-
 Hong Kong
-
 Hungary
-
 India
India
-
 Indonesia
-
 Iran, Islamic republic
-
 Iraq
Iraq
-
 Ireland
-
 Israel
-
 Italy
Italy
-
 Jamaica
-
 Japan
Japan
-
 Jordan
-
 Kazakhstan
-
 Kenya
Kenya
-
 Korea
Korea
-
 Kuwait
-
 Kyrgyzstan
-
 Laos
Laos
-
 Latvia
-
 Lebanon
-
 Lesotho
-
 Libya
Libya
-
 Lithuania
-
 Luxembourg
-
 Madagascar
-
 Malaysia
-
 Malta
Malta
-
 Mauritius
-
 Mexico
-
 Moldova
-
 Mongolia
-
 Montenegro
-
 Morocco
-
 Mozambique
-
 Myanmar
-
 Namibia
-
 Nepal
Nepal
-
 Netherlands
-
 New Zealand
-
 Nigeria
-
 North Macedonia
-
 Norway
-
 Oman
Oman
-
 Pakistan
-
 Palestine
-
 Panama
-
 Papua New Guinea
-
 Paraguay
-
 Peru
Peru
-
 Philippines
-
 Poland
-
 Portugal
-
 Puerto Rico
-
 Qatar
Qatar
-
 Reunion
-
 Romania
-
 Rwanda
-
 Saudi Arabia
-
 Serbia
-
 Singapore
-
 Slovakia
-
 Slovenia
-
 Somalia
-
 South Africa
-
 Spain
Spain
-
 Sri Lanka
-
 Sweden
-
 Switzerland
-
 Syria
Syria
-
 Taiwan
-
 Tajikistan
-
 Tanzania
-
 Thailand
-
 Trinidad and Tobago
-
 Tunisia
-
 Turkey
-
 UAE
UAE
-
 Uganda
-
 Ukraine
-
 United Kingdom
-
United States
-
 Uruguay
-
 Uzbekistan
-
 Venezuela
-
 Vietnam
-
 Yemen
Yemen
-
 Zambia
-
 Zimbabwe
- Forex
- Crypto
